
Key takeaways
This is lesson 4.2 of the seasonal-tendencies teaching: ICT uses the New Zealand dollar, or Kiwi, to show that bearish seasonality is a higher-timeframe timing roadmap rather than an automatic sell signal (0:25), comparing 19-year and 15-year composites and favoring periods when both lines agree (5:44).
Read the full summary
This is lesson 4.2 of the seasonal-tendencies teaching: ICT uses the New Zealand dollar, or Kiwi, to show that bearish seasonality is a higher-timeframe timing roadmap rather than an automatic sell signal (0:25), comparing 19-year and 15-year composites and favoring periods when both lines agree (5:44). Recurring weakness appears around mid-February to mid-March, May into June or July, mid-June into early or mid-July, mid-August toward September or October, and mid-September into October (10:04, 14:32), while potential bullish quarterly lows cluster in March to April, June to July, and September to October. Bearish windows matter more when the higher-timeframe trend, market structure, a rally above an old high, premium or overbought valuation, dollar conditions, and interest rates support weakness (12:46). Kiwi futures and spot generally move in the same direction but not pip for pip, unlike Canadian-dollar futures versus USD/CAD, which requires inversion because CAD is the quote currency. Futures are organized around March, June, September, and December deliveries, with notable June rises and declines and historical late-year strength in December. Reviews of 2007 through 2016 include failures such as little February to March weakness in 2014 and 2016, while 2008 illustrates how major macro conditions can override quarterly tendencies, so price confirmation remains necessary and the composites are retrospective rather than a reproducible controlled test.
How we researched this article
BestProps used document-based research from primary firm sources, checked September 24, 2026. The complete source list, scope, limitations, and commercial-state record appear near the end of this article.
What this lesson covers
In ICT Mentorship Core Content (Month 05): How To Use Bearish Seasonal Tendencies In HTF Analysis, ICT explains his approach to using historical seasonality as a higher-timeframe roadmap. The New Zealand dollar, often called the Kiwi, is the lesson’s main case study.
The central point is that a bearish seasonal window is not an automatic instruction to sell. ICT treats it as a period in which a decline may deserve closer attention if the current trend, market structure, relative valuation and broader macro context also support bearishness. He also shows how an anticipated decline can lead into a later bullish quarterly setup rather than serving only as a short-selling opportunity.
ICT HTF Analysis Starts With the Right Market Relationship
ICT begins by distinguishing a currency futures seasonal chart from a spot foreign-exchange pair. At 1:28, he revisits the inversion issue from the preceding Canadian-dollar lesson: bullish seasonality in Canadian-dollar futures can correspond to bearish pressure in USD/CAD because CAD is the quote currency in that pair.
For the Kiwi example, ICT says the futures contract and the New Zealand dollar’s spot behavior should generally move in the same direction. He nevertheless cautions that futures and spot moves should not be expected to match pip for pip. That distinction matters whenever seasonal data from one instrument is used to frame analysis in another.
How ICT Identifies a Bearish Seasonal Tendency
The chart discussed in the recording compares seasonal composites based on 19 years and 15 years of data — the blue line 19 years, the red line 15 (5:44). Around 4:03, ICT says a tendency appears more meaningful when both composite lines move together, and he opens the composite discussion at 3:46. If the lines are choppy or disagree, he regards the seasonal message as less useful.
He later notes that the futures series is organized around March, June, September and December delivery months (6:02). In his interpretation, the June contract displays especially notable rising and falling phases, while the December contract has historically shown late-year strength. These observations describe the particular historical composites shown in the lesson, not a rule that every year must follow.
ICT explicitly rejects that deterministic reading at 7:09. He calls seasonality a roadmap rather than a panacea and says the pattern will not appear every year.
Bearish Seasonal Windows for the Kiwi
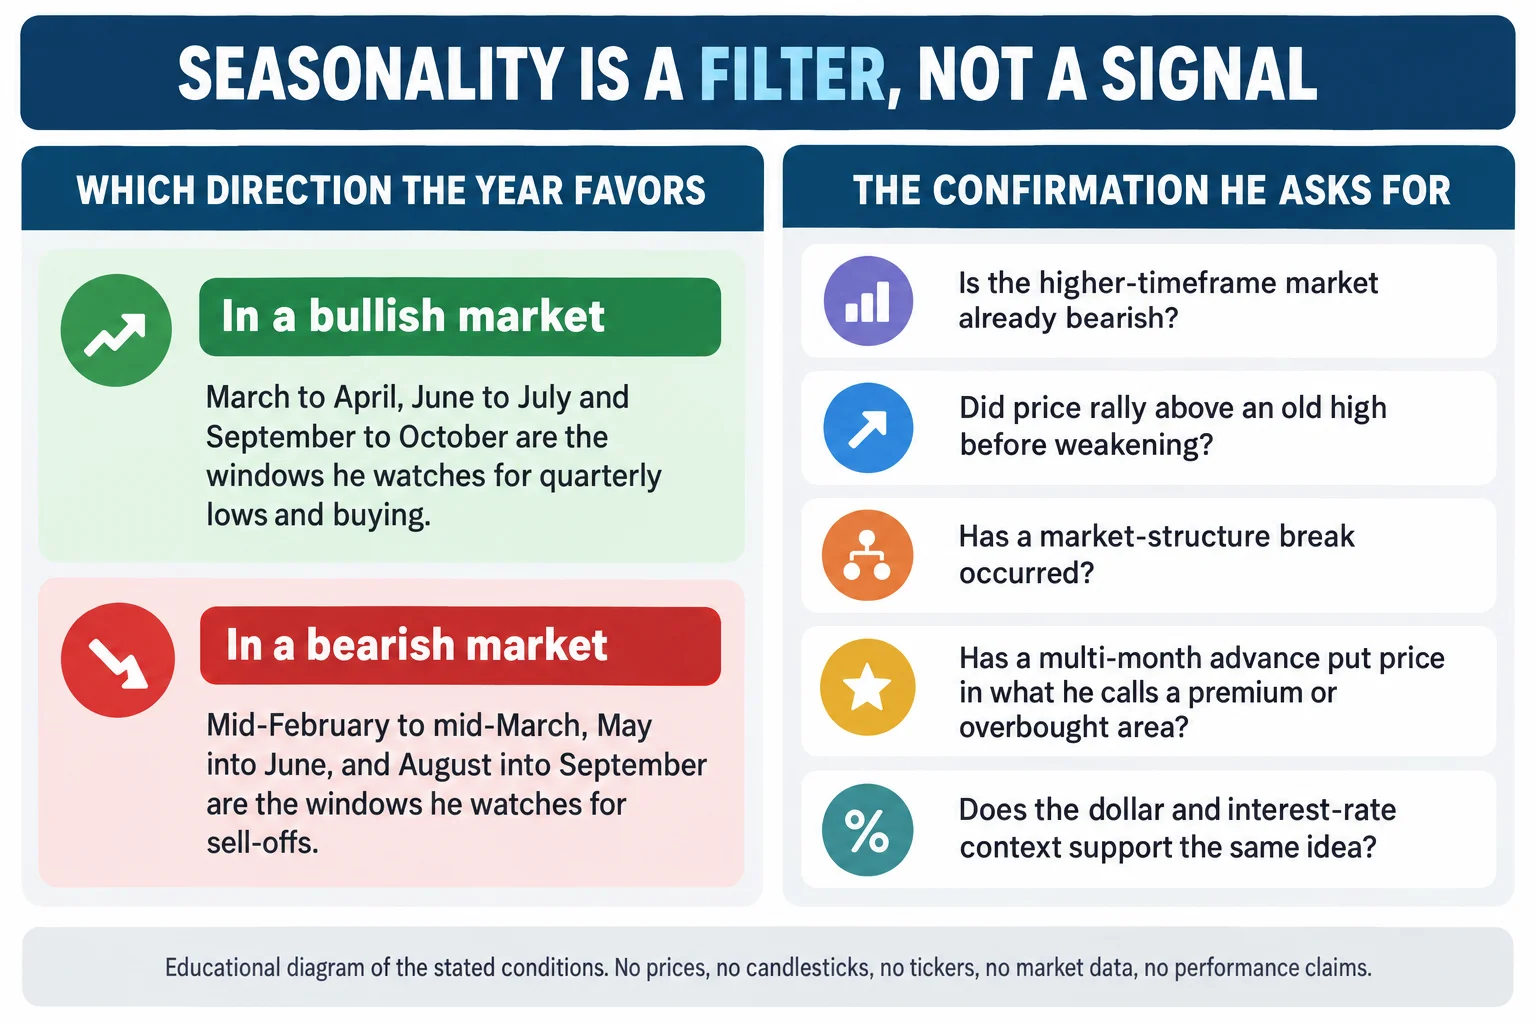
Using the displayed composites, ICT identifies several recurring periods of historical weakness:
- Mid-February through mid-March
- May into June or July
- Mid-June into early or mid-July as a shorter additional window
- Mid-August toward September or October
- A smaller decline from roughly mid-September into October
The clearest initial example is the mid-February-to-mid-March decline discussed at 10:04. ICT says both historical composites slope lower during that period. He then describes a typical rally from around mid-March into May, another decline after the May area, and renewed historical strength after lows around June–July and September–October.
These dates are approximate seasonal zones, not precise entry or exit timestamps. The transcript also does not provide the underlying calculations needed to reproduce the composites independently.
Bearish Seasonal Tendencies Must Match Current Price Conditions
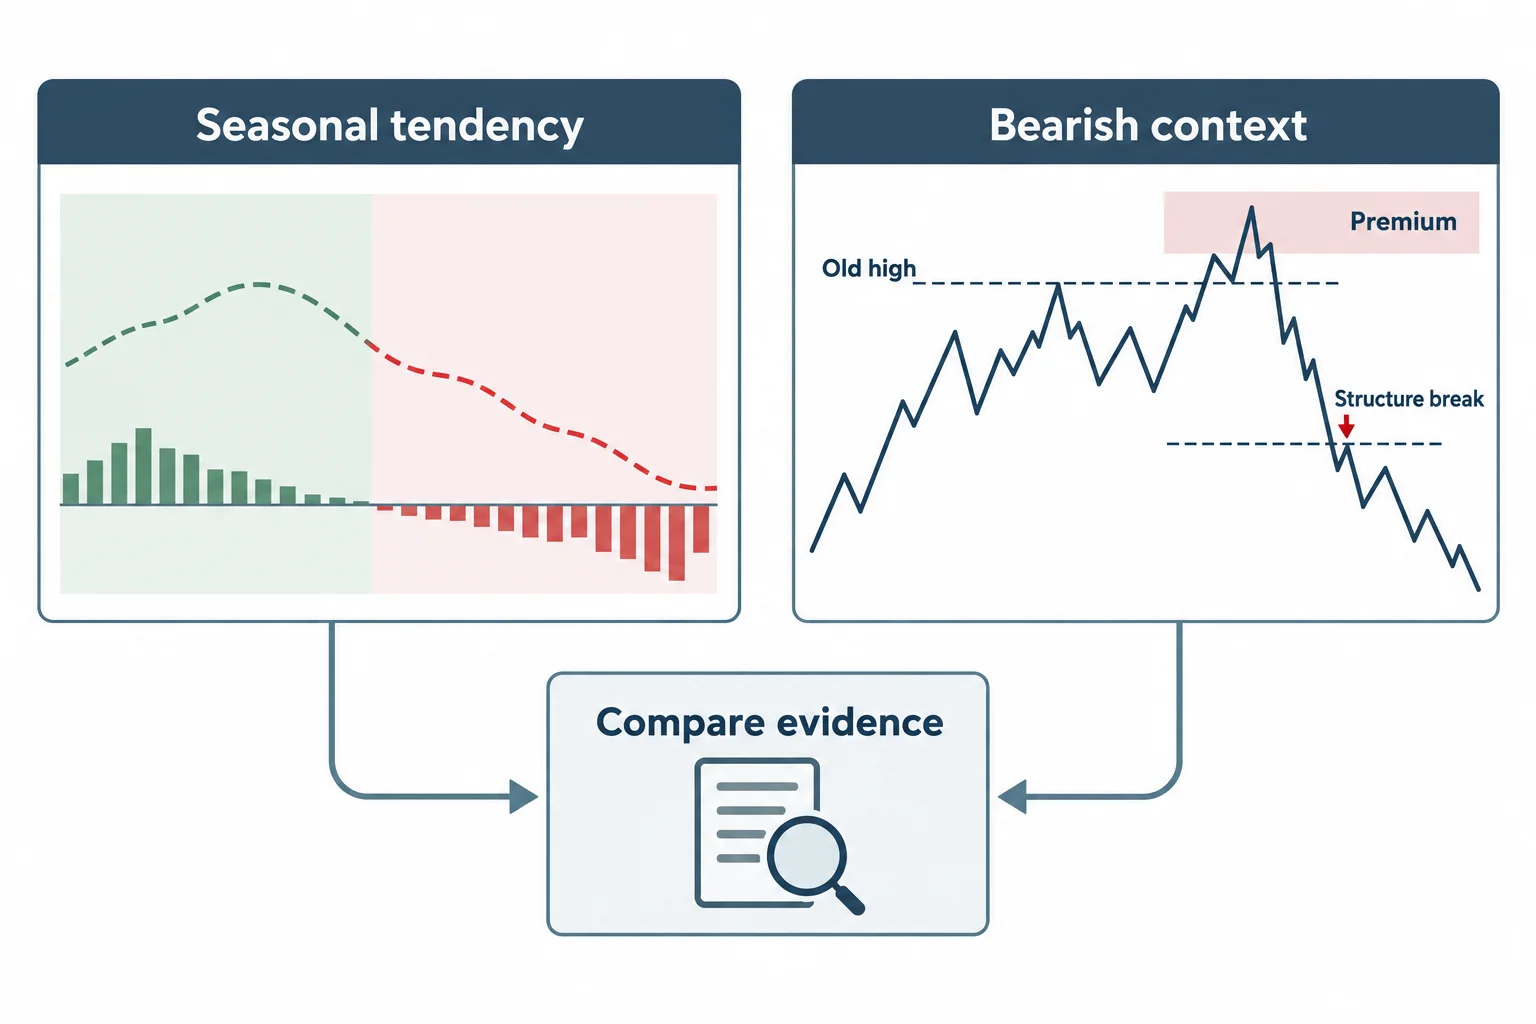
The lesson’s most important qualification begins near 12:46. ICT says traders should not assume that the Kiwi must form a top in May merely because the composite suggests seasonal weakness.
Instead, he proposes asking whether price supplies corroborating evidence. His examples include:
- Is the higher-timeframe market already bearish?
- Has price rallied above an old high before weakening?
- Has a market-structure break occurred?
- Has a multi-month advance placed price in what ICT calls a premium or overbought area?
- Does the broader dollar and interest-rate context support the same directional idea?
These are components of ICT’s analytical framework, not independently established proof of predictive power. His stated method is to favor the seasonal direction that best fits the market regime rather than forcing every historical tendency onto the current chart.
Using Bearish Seasonal Moves to Find Bullish Quarterly Shifts
At 15:29, ICT presents two possible uses for bearish seasonality. A trader could study the decline itself, or monitor it as a path toward a later higher-timeframe buying scenario.
He highlights March–April, June–July and September–October as areas where the historical composite tends to form lows before bullish phases, and adds one he does not mark on the chart: the last week of November into the first week of December, which he also describes as a buying opportunity (18:14). In a bullish market regime, he would give those potential lows more attention. In a bearish regime, he says the February–March, May–June and August–September weakness may be more relevant.
This is the lesson’s broader higher-timeframe idea: seasonal weakness can help organize a 12-month roadmap and identify when a quarterly transition might become plausible. It does not determine that a reversal has occurred; price still has to confirm the scenario under ICT’s framework.
What ICT Bearish Seasonal Examples Really Show
From approximately 19:02, ICT reviews annual Kiwi charts from 2007 through 2016. He identifies years in which the highlighted seasonal windows appeared to align with declines or subsequent rallies, while also pointing out failures and neutral periods. For example, he describes 2014 and 2016 as offering little bearish movement in the February–March window.
His 2008 discussion is especially relevant to risk interpretation. At 21:41, ICT says major macro conditions can override a shorter quarterly tendency. The annual reviews are retrospective chart interpretations presented by ICT; they are not a controlled test, and the transcript alone cannot verify chart levels, hypothetical fills or trading results.
ICT HTF Analysis Takeaways for Bearish Seasonal Tendencies
As a general analytical interpretation, seasonality can be treated as a timing hypothesis: it suggests when to investigate, not what must happen. A disciplined review would define the relevant instrument, verify whether spot and futures relationships require inversion, identify the prevailing higher-timeframe regime, and wait for independently specified price confirmation.
ICT closes by arguing that seasonality adds a time element that indicators do not supply — a divergence tells you what might happen but not when (30:14). That is his market interpretation rather than a performance guarantee. Historical repetition can fail, and this material should be used for education and source study, not as individualized investment advice.
Watch the original recording
ICT Mentorship Core Content – Month 05 – How To Use Bearish Seasonal Tendencies In HTF Analysis
The Inner Circle Trader · published 15 September 2022 · about 35 minutes 7 seconds. This recording is the primary source for every timestamp link above.
The recording is not embedded here because the video owner has disabled playback on other websites. That was tested directly on 15 September 2026 from a BestProps page origin at both desktop and mobile widths: the embedded player frame loads, then reports “Playback on other websites has been disabled by the video owner” with no duration and no playback progress, while the recording itself plays normally on YouTube. No empty or half-working player is left on this page.
The watch page was read on 15 September 2026 and is publicly listed as ICT Mentorship Core Content – Month 05 – How To Use Bearish Seasonal Tendencies In HTF Analysis by The Inner Circle Trader: upload date 15 September 2022, not private and not unlisted, with the player reporting a length of 2,107 seconds — about 35 minutes 7 seconds. The audio used for this article runs to 2,107.2 seconds, so the transcription and the listed length agree. Inside the recording he identifies the session as lesson 4.2, the second of two lessons on applying seasonal tendencies to higher-timeframe analysis, following lesson 4.1 on the Canadian dollar (0:13, 0:40). As with the other lessons in this series, the spoken lesson identity and the YouTube upload date are different pieces of information rather than one date.
Resources
These are the sources checked for this article. The regulator and investor-education pages are general material about leveraged foreign-exchange and futures trading and about how trading systems and advisory services sold to the public should be assessed; none of them evaluates this speaker, and none verifies any seasonal window, composite reading, market condition, example year or historical figure described above. The seasonal percentages, windows and yearly examples in this article are the speaker’s own retrospective chart study as he states it, not an independently reproduced measurement; the underlying data and calculations needed to reproduce those composites are not supplied in the recording. Any ICT, smart-money or third-party indicator, script, note set, chart annotation, transcript pack or re-upload circulating outside the publishing channel’s own page is unofficial and has not been tested here.
- [1] ICT Mentorship Core Content – Month 05 – How To Use Bearish Seasonal Tendencies In HTF Analysis — The Inner Circle Trader (primary source; watch page read 15 September 2026, listed length 2,107 seconds, about 129,700 views at the time of reading).
- [2] The Inner Circle Trader — official YouTube channel (read 15 September 2026) — the publishing channel for the mentorship series used here.
- [3] CFTC — Fraud Advisory: Foreign Currency (Forex) Fraud (read 15 September 2026) — the regulator’s warning that the forex market is volatile and carries substantial risks, and its list of persuasion tactics used in forex sales pitches, relevant background to reading a seasonal roadmap as study material rather than a performance claim.
- [4] Investor.gov (SEC) — Day Trading (read 15 September 2026) — investor education stating that day trading is extremely risky and can result in substantial financial losses in a very short period.
- [5] Investor.gov (SEC) — Glossary: Commodity Futures (read 15 September 2026) — general background on commodity futures contracts, the instrument type whose seasonal charts the lesson relies on.
Source: ICT, ICT Mentorship Core Content – Month 05 – How To Use Bearish Seasonal Tendencies In HTF Analysis, The Inner Circle Trader, uploaded 15 September 2022. The transcript used was automatic local speech-to-text of the recording’s full audio (Whisper large-v3-turbo), not human-verified captions; the integrity checks passed with no low-confidence segments flagged. Several instrument and price figures spoken during the year-by-year review render ambiguously in the machine transcript, so this article reproduces the seasonal windows, the stated conditions and the years he reviews, and does not restate the individual pip counts as measured facts; no level, fill, order, position size or result has been invented to fill that gap. His performance remarks (“profitable outcome”, “do very very well”) are reported as his own assessment, and no frequency, win rate or drawdown is offered anywhere in the recording. This commentary is educational and is not investment advice or a recommendation to copy any trade.