
Key takeaways
ICT lesson 2.1 of the January 2017 mentorship uses free 10-year Treasury futures charts from barchart.com and yield data from investing.com to build a higher-time-frame trend-versus-range filter with the Dollar Index.
Read the full summary
ICT lesson 2.1 of the January 2017 mentorship uses free 10-year Treasury futures charts from barchart.com and yield data from investing.com to build a higher-time-frame trend-versus-range filter with the Dollar Index. Treasury prices and yields move inversely, so falling ZN prices imply rising yields and a potentially stronger dollar, while rising ZN prices imply falling yields and a potentially weaker dollar. The Treasury seasonal template generally peaks in January to February, declines into late May through early July, then rallies during the second half, while the Dollar Index often rallies early in the year, peaks around June to July, and declines toward late October or early November. When 10-year note prices and the Dollar Index move together, as illustrated by the September 2015 ZNU15 and September 2016 contracts, ICT reads large consolidation and long-term indecisiveness, expects prior highs and lows to remain vulnerable, and favors short-term or day trades over position trades. When Treasury prices follow seasonality and the Dollar Index moves oppositely in confirmation, he expects a directional trend lasting weeks to months and favors long-term position trades. The March 2017 contract illustrates this directional case after the November 2016 election, when 10-year note prices sold off, yields rose, and the Dollar Index rallied. Seasonality is only a tendency and may be absent or reverse, so if the June to July Treasury buy pattern fails, ICT shifts attention to seasonal highs and the opposite side of the model.
How we researched this article
BestProps used document-based research from primary firm sources, checked September 24, 2026. The complete source list, scope, limitations, and commercial-state record appear near the end of this article.
ICT 10 Year Note Charts
He opens by identifying the recording as lesson 2.1 of the January 2017 content and the subject as using 10-year yields in higher-time-frame analysis 0:11, 0:16. He then points at a seasonal-tendency chart for the 10-year Treasury note and asks the viewer to look at where the most significant price swings sit on it before he zooms in 0:26, 0:30, 0:35. He says the two charting sites he works from are free: the futures price from barchart.com and the yields from investing.com 1:26, 1:31, 1:38. The audio pass renders the first name as “bar chart.com” split across two words.
He also sets out what the lesson is meant to demonstrate, and the second half of that list is the part worth keeping: not only the case where the seasonal tendency plays out, but the case where seasonality has no influence on the market and the case where the market moves contrary to it 1:05, 1:11, 1:15.
10 Year Note Prices and Treasury Yields
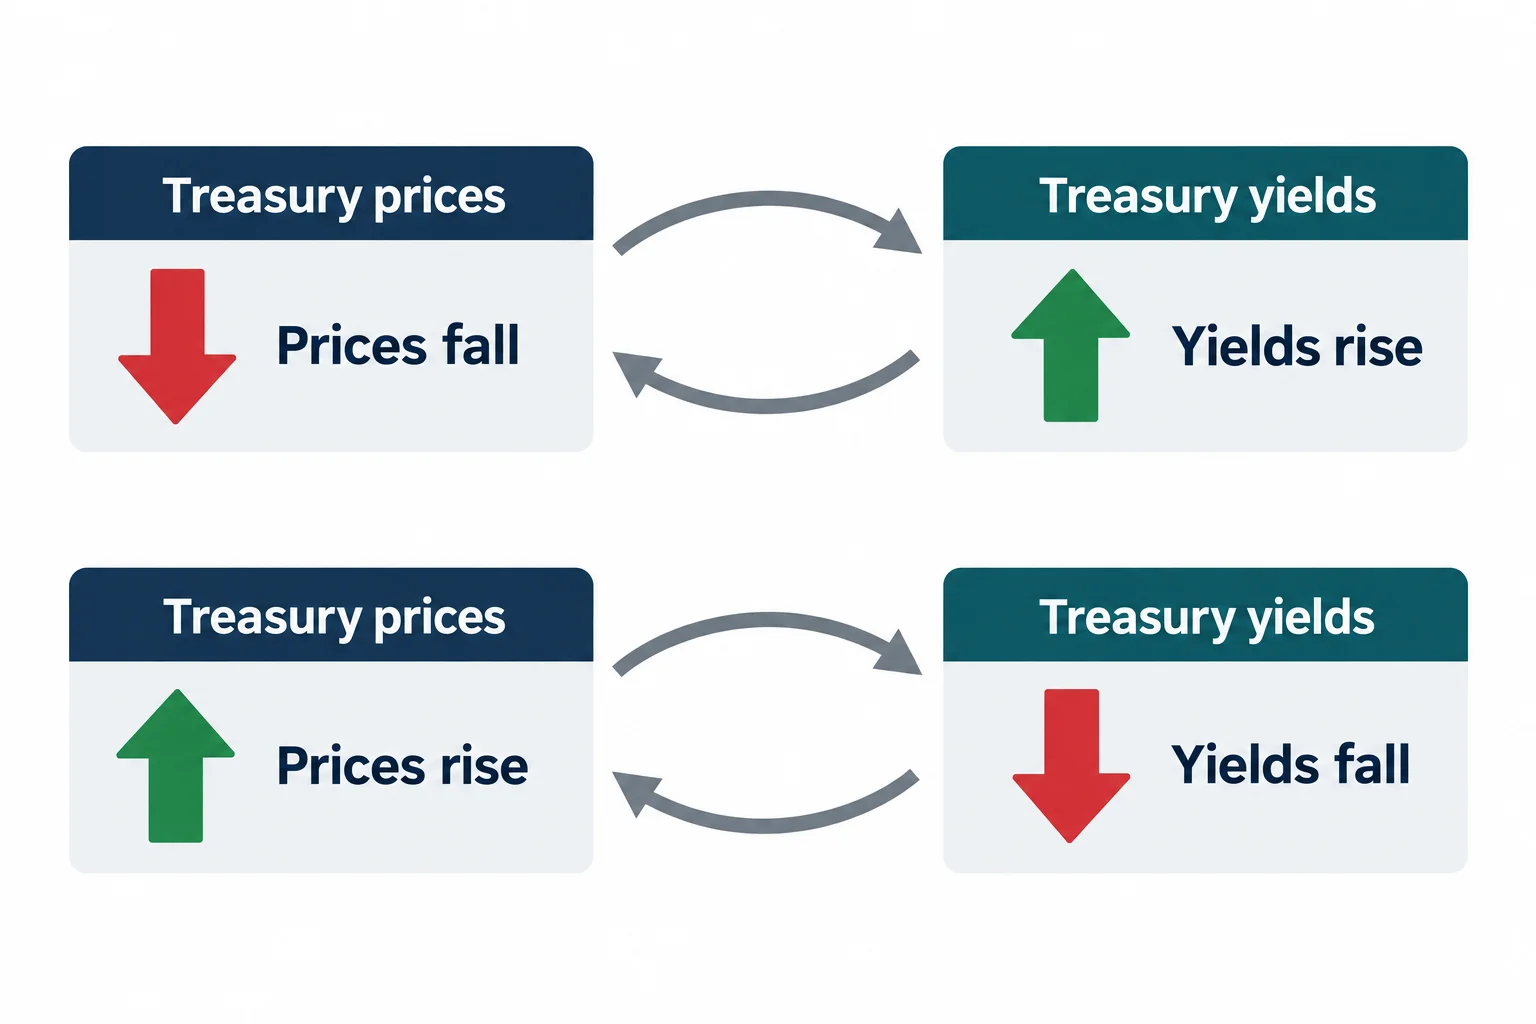
The first mechanic he establishes is that Treasury prices are inverted to the yield 1:46. When the futures contract price drops on the chart, Treasury yields increase 1:54; when prices rise, yields decline 2:04. Everything later in the lesson depends on that inversion, because the seasonal charts he displays are price charts and the interest-rate conclusion has to be read backwards out of them.
He then gives a general rule for the consequence he expects: long-term funds seek yield, meaning money is placed or allocated where it will seek the most return on investment 2:17, 2:23. From there he states the dollar read. The Dollar Index can rally relatively easily when yields increase, which he ties to the futures price dropping on the 10-year note 2:33, 2:41; and the dollar has its easiest or most opportune time to decline when yields decrease, which he ties to the futures price rising 2:47, 2:55. This is his interpretation of how yield-seeking capital behaves, and the recording offers no test of it.
10 Year Note Seasonal Price Pattern
Zoomed into the seasonal chart 3:02, he describes the pattern in two parts 3:07. There is a high that generally forms in the January–February window and trades down toward the middle of the year 3:16, 3:22, and there is a low that he places at the last week of May rolling into the first week of July, after which price usually rallies for the rest of the year 3:28, 3:33, 3:36. Summarised at the top of the recording, that is two dominant cycles in the seasonal for Treasury notes, bearish for the first half of the year and bullish for the second 0:53, 1:00.
The qualifier matters as much as the pattern. He stresses that this tendency is drawn on the underlying futures contract price rather than on the yield, so the yield runs inverted to it 3:43, 3:49. The practical consequence he spells out is that a June–July rally in 10-year prices means interest rates are actually dropping, which he describes as an adverse effect on the yield 3:53, 4:00.
Dollar Index Seasonality in HTF Analysis
He then brings up the Dollar Index seasonal tendency 4:46 and contrasts it with the Treasury pattern. Around January–February there is usually a rally in the dollar, which he notes is contrary to the 10-year note declining over that window 4:52, 4:57; then a significant high forms between June and July 5:00; and then the dollar typically trades down for the rest of the year, usually making a low around the last week of October or first week of November, with a small bounce in November 5:07, 5:10, 5:15.
From the two charts together he names two alignments: a bearish tone for the Dollar Index from mid-June into July, and some rallying at the beginning of the year going into March 5:21, 5:30, 5:35. He also gives conditional seasonal reads for the dollar, and flags the condition himself: a decline from March into May, but only in bearish markets, while in bullish markets he puts the buys at November, May and January 5:42, 5:49, 5:50, with the sells at March, June and July plus one in September, usually producing a short high in the latter part of November 6:02, 6:10. Those are seasonal-tendency observations, not tested statistics, and the recording presents them that way.
Why 10 Year Note Prices and the Dollar Index Diverge
Coming back to the 10-year note, he describes the two markets as being in strong contrast and turns that into a probability statement: if Treasury futures prices are rallying, the yield is doing the opposite and interest rates are dropping 6:21, 6:38. Dropping rates, in his framework, are what keep yield-seeking traders and investors away from the Dollar Index, because falling rates do not encourage buying dollar-based assets 6:43, 6:51, 6:59. He attributes the effect directly to the inverted relationship between the two markets 7:08, and says that blending them gives him a context to work with when he is looking for quarterly shifts 7:13, 7:17.
2015 10 Year Note and Dollar Index Example
The first example is the September 2015 10-year Treasury note contract 7:17, 7:21, which he introduces together with the seasonal low he had just described, and he explains the contract code on the chart: the U in ZNU15, shown in the upper left corner, stands for the month of September, which is the delivery contract 7:28, 7:36, 7:48. He reads the chart as showing contract prices starting to rally in June, which in his framework means yields decreasing and a bearish input for the Dollar Index 7:48, 7:58, 8:03.
The point of the example is what happened next. He notes that the 10-year note made a short-term high in June–July, traded lower and took out the May low, and that the Dollar Index also rallied a little between mid-June and August, at the same time the Treasury note was rallying into its seasonal window, leaving the dollar slightly bullish as well 8:13, 8:19, 8:25, 8:32, 8:38. That is the tandem case, and he states its meaning: if the two are moving together, the likely market condition is a large consolidation rather than a trend, and the expectation becomes previous highs and previous lows being violated and price returning to the middle of the range 8:43, 8:47, 8:51, 8:55. What he describes on the chart afterwards is the dollar index coming back down, taking out the May–June lows and essentially moving sideways 9:00, 9:06, 9:10.
2016 10 Year Note and Dollar Index Example
The September 2016 contract is used to show the same sequence again 9:18. He points to the seasonal low forming in the last week of May going into June and the note rallying into July 9:21, 9:28, and says that should have put a bearish stance on the Dollar Index at the same time 9:34. He reports that the dollar did decline in the last week of May into June and made one more lower low in the latter part of June, but then rallied again, which he relates to a slightly higher high in the 10-year note going into July and one more higher high pushing into the dollar in late July 9:42, 9:48, 9:59, 10:03, 10:06. His conclusion is the same as the first example: an indication that the markets are going into a large consolidation 10:10, 10:13.
From there he draws the reasoning out explicitly. If both the yield side and the dollar side are moving in the same direction, what he is looking at is long-term indecisiveness, and because they are moving in tandem the likelihood of a continued directional trade higher or lower for either one is, in his words, highly unlikely 10:15, 10:24, 10:33, 10:37. The action he says follows is to look back at previous highs and lows on both the Treasury and the Dollar Index and treat them as vulnerable within the range 10:47.
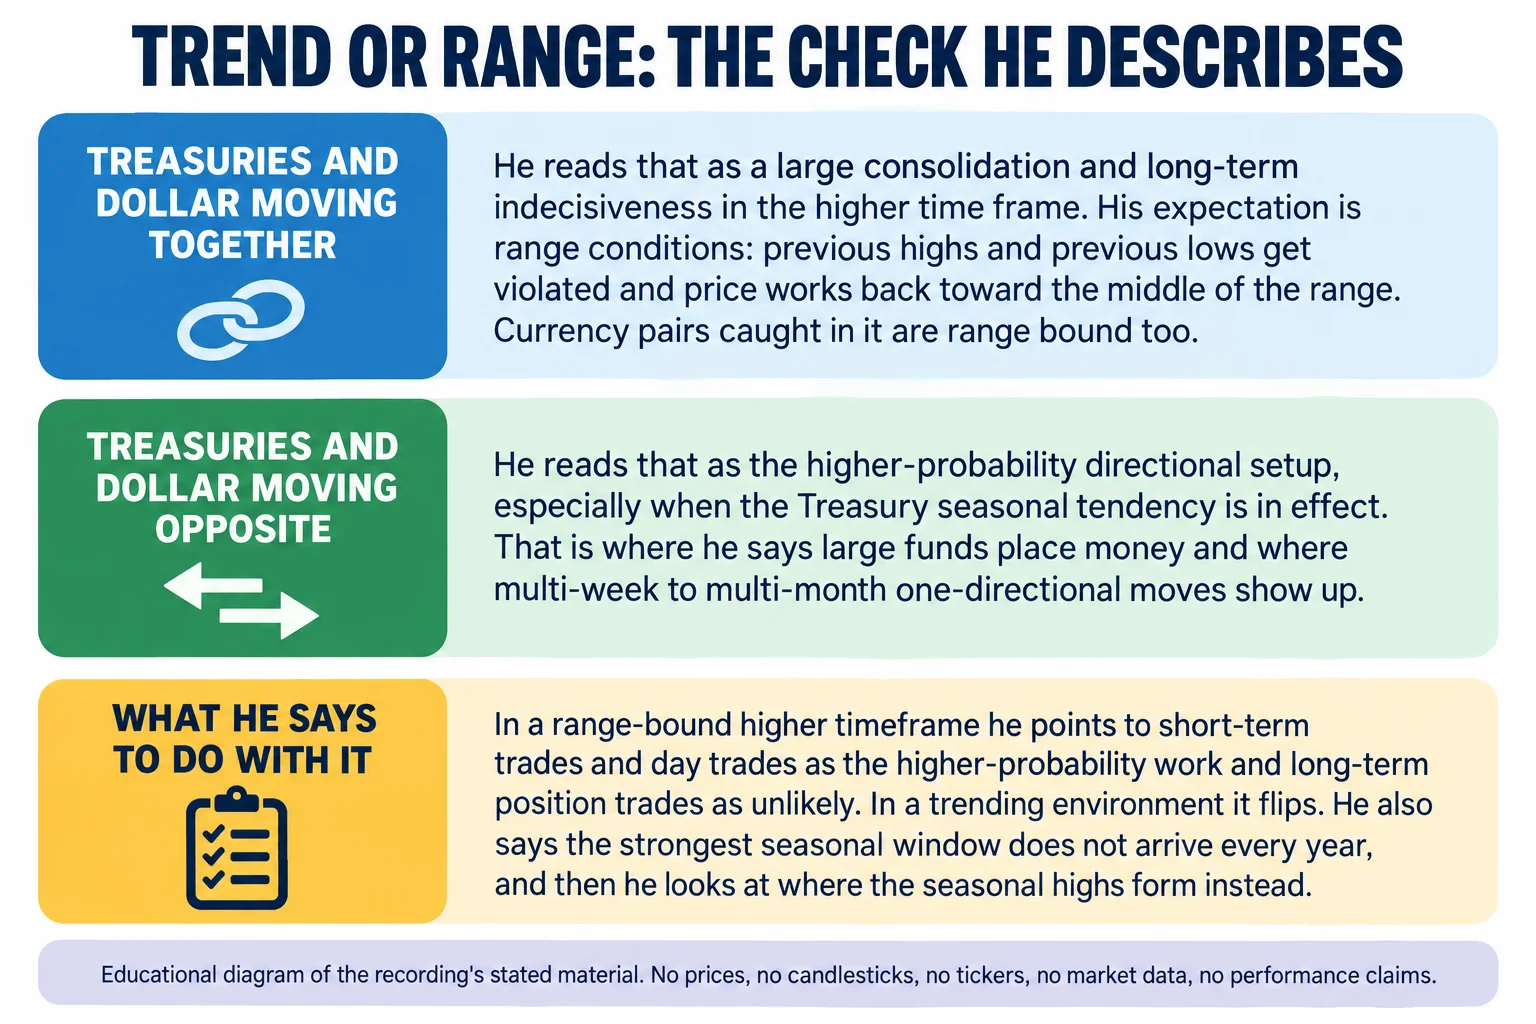
10 Year Note and Dollar Signals for Currency Pairs
He extends the framework to foreign currencies at that point 11:01, 11:07. His first point is that a consolidating dollar and consolidating Treasuries put the currency market into long-term consolidation as well, because the dollar is range-bound and Treasuries are range-bound 11:09. His second point is the opposite case: when the Treasury market is genuinely moving in its seasonal tendency and the dollar is supporting that tendency, he treats it as a strong probability of a directional long-term trend 11:18, 11:27. That, he says, is where the large funds place their money, and the moves it produces are one-directional biases lasting many weeks to several months 11:32, 11:34.
2017 10 Year Note and Dollar Index Example
The last example uses the March 2017 contract, which he says he chose because it carries data from the latter part of 2016 into the present trading day 11:50, 11:53, 11:59. He notes the seasonal tendency for the Treasury market to make a high in November 12:10 and goes back to the seasonal chart to point out the green vertical line furthest to the right, which he says marks the start of trading in the March delivery contract and lines up with that contract’s high and the point it trades off from 12:20, 12:26, 12:29, 12:35, 12:42.
He ties that seasonal high to the 2016 presidential election and the high the election result produced, describing November as the end of the uptrend for the seasonal tendency on the 10-year note and the beginning of a seasonal high, with price then moving lower into the latter part of December 13:09, 13:16, 13:25, 13:32, 13:40, 13:48. In this instance, he says, the Treasury market was trending down rather than consolidating, which gave the Dollar Index the opportunity to do the opposite in a trending fashion as well 13:52, 14:00, 14:07.
He explains the mechanism through rates again: the election produced a sell-off in the 10-year Treasury note, that sell-off means interest rates increasing, and increasing rates are what he expects to interest buyers seeking yield in the Dollar Index 14:11, 14:16, 14:20, 14:25, 14:29. He reports that the market then did trend higher 14:33, creating a short-term low and a high in the first portion of the month he names, which the audio pass records as December in both places 14:37, 14:40. That repetition is left as it stands here rather than resolved into a different month, because the transcript does not settle it.
HTF Analysis Filter for 10 Year Note Direction
Summarising, he says the 10-year note is either moving in its seasonal tendency, or (if the Dollar Index moves in tandem with it) the reading is a large consolidation 14:49, 14:55, 15:01. For an example he points to the middle of 2016, when the British pound and the Eurodollar were in big consolidations. He attributes that to the 10-year note and the Dollar Index both being range-bound while moving in the same direction, which he says translates into range-bound currency trading as well, with the Brexit vote as the caveat for the latter part of the summer months 15:05, 15:12, 15:20, 15:25, 15:31, 15:32, 15:36. Everything before that vote, in his description, was range-bound for currency trading 15:43, 15:45.
The filter he presents as the practical value of the month’s material is a time-horizon question. An explosive, trending trade is what he looks for when the Treasury seasonal tendency is in effect and the dollar’s price action is contrary to it; if that is not what the two markets are showing, the more likely setting is a range-bound consolidation, and in that setting he says the higher-probability work is short-term trades and day trades while long-term position trades are unlikely 15:48, 15:52, 15:56, 15:59, 16:04, 16:10, 16:15, 16:20. When the 10-year note is trending, his expectation is that the Dollar Index is trending too, and that is where he says long-term position trades are favourable 16:26, 16:30.
He closes the circle with the absence case. If the strongest part of the seasonal tendency (the buy signal he places around June and July in the 10-year note) is not occurring, he says he focuses instead on where the highs form seasonally, so that he can get in sync with the opposite side 16:34, 16:41, 16:45, 16:50. His stated reason is that the market does not do the same thing every single time 16:56, 17:01, 17:05. He says he will build on the model in the next lesson 17:18, 17:24.
Two things are worth separating here. The inversion between prices and yields is a definitional relationship, and the official yield data behind it is public. The rest, including the seasonal template, the tandem-versus-inverse filter and the conclusion that one market condition favours day trades while the other favours position trades, is his framework as he states it. The recording contains no account results, no order or fill detail, no risk parameters and no statistical test, and the chart readings above are reported from his spoken description of them, not from an independent review of the charts.
Watch the ICT 10 Year Note Lesson
ICT Mentorship Core Content – Month 05 – Using 10 Year Notes In HTF Analysis
The Inner Circle Trader · watch page lists upload 13 September 2022 · 1,051 seconds, about 17 minutes 31 seconds. The speaker opens the recording as lesson 2.1 of the January 2017 content. This recording is the primary source for every timestamp link on this page.
The recording is not embedded here. An embedded player was tested directly on 15 September 2026 from a BestProps page origin at desktop and mobile widths, and it loads but then reports “Playback on other websites has been disabled by the video owner”, with no duration and no playback progress, while the video itself plays normally on YouTube. No half-working player is left on this page.
The watch page was read on 15 September 2026 and is publicly listed as ICT Mentorship Core Content – Month 05 – Using 10 Year Notes In HTF Analysis by The Inner Circle Trader, with an upload timestamp of 13 September 2022, not private and not unlisted, and a listed duration of 1,051 seconds, about 17 minutes 31 seconds, against a transcribed audio duration of 1,050.3 seconds.
ICT 10 Year Note Transcript
There was no usable caption track for this recording, so the transcript behind this article is an automatic speech-recognition pass over the full original audio, not human-verified captions and not YouTube’s own captions. The pass covered the complete audio, reported no low-confidence stretches, and the recognised terms that needed normalising are the charting site the audio splits into the words “bar chart.com” 1:26, 1:31, the series name the audio renders as “ITT mentorship” where ICT is meant 0:11, and the phrase “seasonal tendency”, which the audio garbles into “seasonal tenancy” and “seasonal attendance” 3:02, 3:07, 8:38. Three passages are garbled at the point of recording them and are not repaired here: the sentence about what to focus on inside the consolidation range 10:47, the description of the market trending higher in the 2017 example 14:37, and the closing reference to the November high lining up with the election 17:18. Within one closing sentence of the 2017 example the audio names the month December twice, for both the short-term low and the high, and that repetition is reported as heard rather than resolved 14:40. Contract codes, index names and the dates he refers to come from his spoken words and are attributed as such. Nothing in this article is taken from anywhere other than the spoken content of this recording, and this review did not view the recording’s charts: the chart readings described above are reported from his narration of them, not inspected independently.
ICT 10 Year Note Resources
These are the sources checked while preparing this article. The official Treasury and CFTC pages are the public data behind the two markets and the type of position data his comparisons draw on; none of them evaluates this speaker or verifies the seasonal template, the tandem-versus-inverse filter or the time-horizon conclusion above, and none endorses anything said in the recording. Any ICT, smart-money or third-party indicator, script, note set, chart annotation, transcript pack or re-upload circulating outside the publishing channel’s own page is unofficial and has not been tested here.
- [1] ICT Mentorship Core Content – Month 05 – Using 10 Year Notes In HTF Analysis The Inner Circle Trader (primary source; watch page read 15 September 2026, listed duration 1,051 seconds).
- [2] The Inner Circle Trader (official YouTube channel) (read 15 September 2026), the publishing channel for the mentorship series used here.
- [3] U.S. Department of the Trea