
Key takeaways
This is teaching 3.4 of the December 2016 mentorship content, and its subject is order-block theory with reclaimed blocks (0:35, 0:43).
Read the full summary
This is teaching 3.4 of the December 2016 mentorship content, and its subject is order-block theory with reclaimed blocks (0:35, 0:43). He teaches it through two mirrored structures. In the market maker buy model, price swings lower into a support reference, and during that decline he marks down candles that are followed by a small short-term bounce, which he reads as minor displacement and calls bullish order blocks (0:50, 3:41). After the low forms and price starts making higher highs, a retracement back into one of those old down candles is what he calls reclaiming or recapitalising the block, and he treats it as a new long reference (4:38, 4:45). The sell model is the same logic reversed: up candles followed by a short-term decline are bearish order blocks, and a later rally into one of them after the high is his short reference (6:34, 8:41). He also gives a qualification that cuts against treating every marked candle as a signal: in one of his own examples price traded straight through the candle before forming a high (9:43, 9:47). The recording contains no fills, no risk rules, no statistical test and no results.
How we researched this article
BestProps used document-based research from primary firm sources, checked September 24, 2026. The complete source list, scope, limitations, and commercial-state record appear near the end of this article.
What A Reclaimed Orderblock Means In This Lesson
He introduces the material as teaching 3.4 out of eight of the December 2016 mentorship content, dealing specifically with reinforcing order-block theory and reclaimed blocks (0:35, 0:43). The two structures he uses to teach it are the market maker buy model and the market maker sell model (0:50, 6:34).
The idea underneath it is that a candle can matter twice. He describes market makers scaling into positions early because their size is far larger than a retail trader’s, meaning they cannot fill everything at one level or in one transaction and must build the position in what he calls hedging (1:54, 1:57, 2:08, 2:14). The visible trace of that, in his reading, is the small bounce that punctuates a decline: each little bounce is what he calls minor displacement, which he says shows new accumulation being taken into the market (2:28, 2:38, 2:41, 2:45).
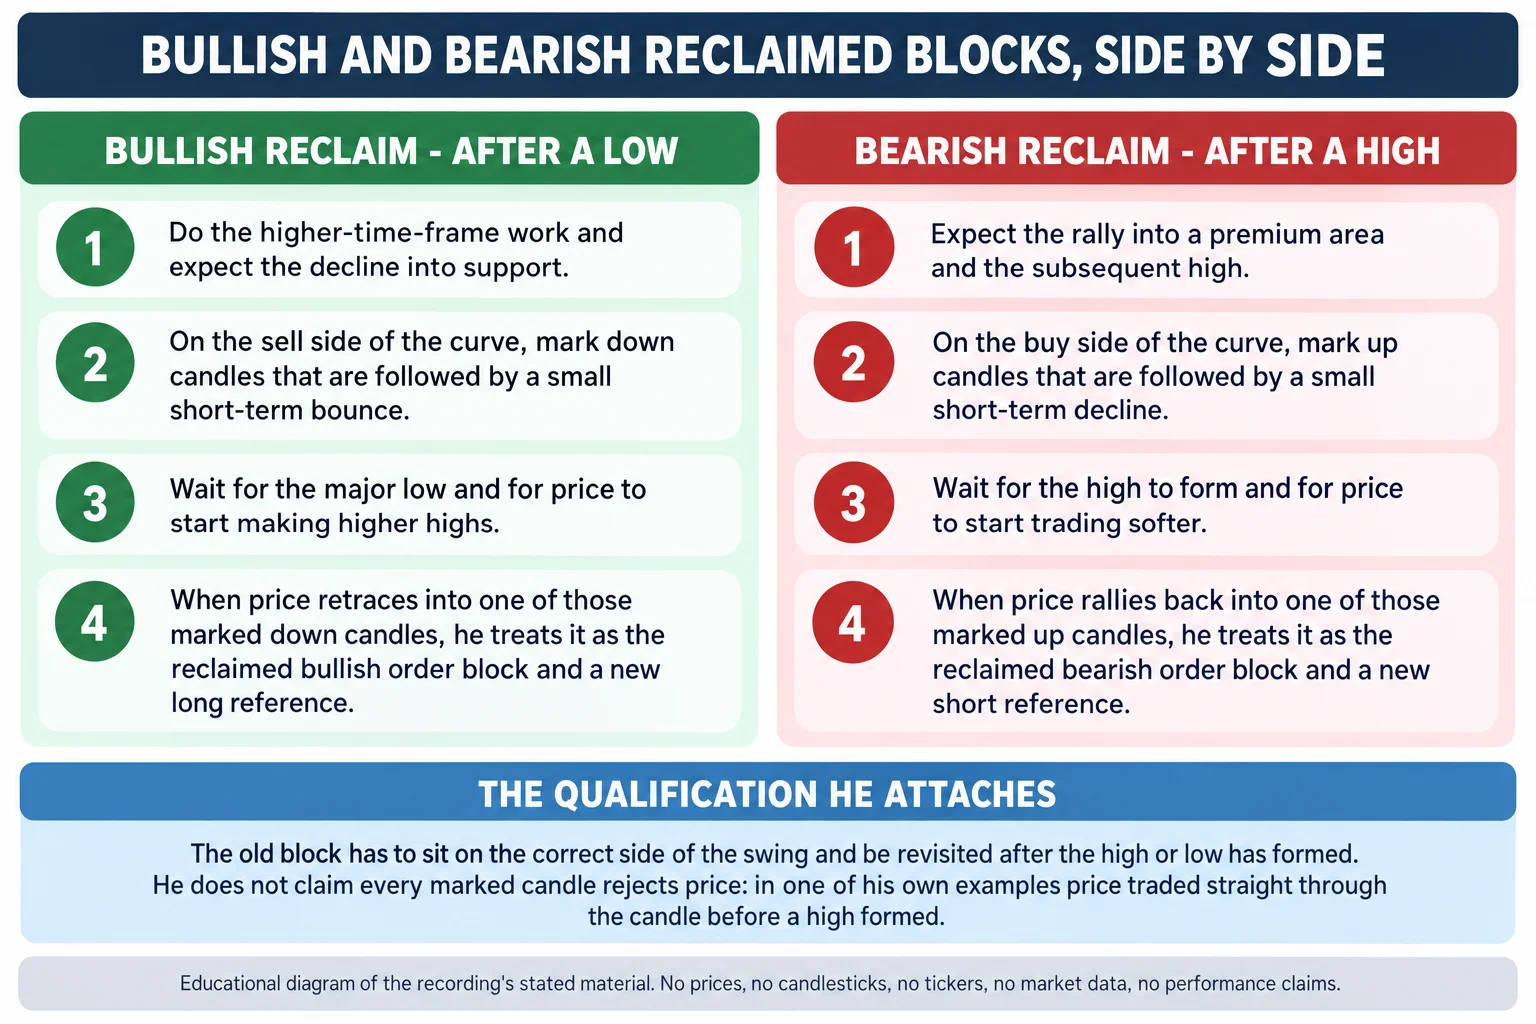
He then states the two definitions the lesson is built on, and they are cleanly parallel. A bullish reclaimed block is a candle or bar that was previously used to buy price, where a short-term bounce confirms minor displacement, and on the buy side of the curve those old down candles are reclaimed for new longs (5:06, 5:09, 5:14). A bearish reclaimed order block is a candle or bar that was previously used to sell price, where a short-term decline confirms minor displacement, and those blocks are reclaimed as new entries for short positions (8:41, 8:48, 8:52).
So “reclaimed” is not a synonym for crossing a level. It means a specific earlier candle is reused after a larger swing has turned, on the opposite side of that swing from where the candle was created.
The Market Maker Buy Model
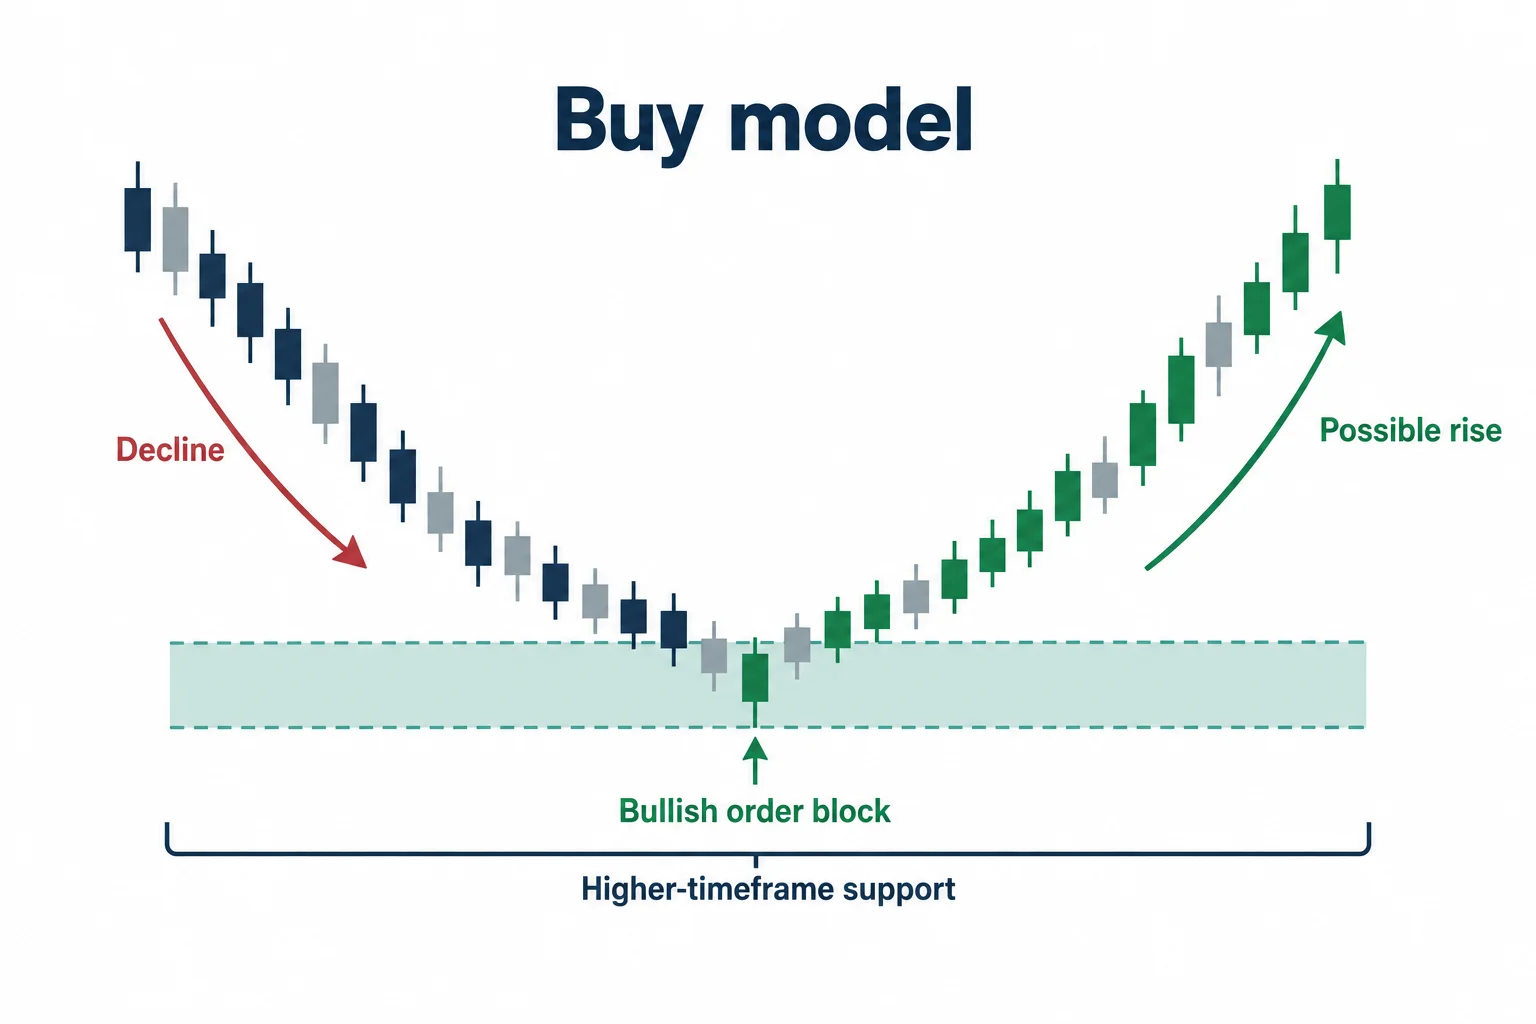
He describes the buy model as a price swing lower that then trades higher — in his phrasing, understanding that the market is going lower to go higher (3:49, 4:00). The decline is aimed at what he calls a higher-timeframe or intermediate-term support level, and he names five things that could serve as that support: an old high, an old low, a bullish order block, a filled void, or price closing in on a fair value gap (0:53, 0:59, 1:03, 1:07, 1:16).
He notes two ways to approach it: you can anticipate the move lower and be short into it, or if the decline has already happened you can look at the specific levels to watch for reclaimed order blocks (1:20, 1:25, 1:35). The second path is the one the rest of the lesson develops.
The distinction he draws on the way down is between the support level and the smaller rallies above it. He says the support being reached for is most likely the level the market will have its impulse price swing away from, and that before that low forms there will be initial short-term rallies (2:59, 3:10, 3:15). He is candid about the trap in those rallies: traders who read them as entry points get stopped out, because he says they are piggybacking on an entry that is based on a market maker’s hedging motive rather than on the turn itself (3:21, 3:25).
What he marks during that decline is narrow and specific: as the lows keep making lower lows, every time price makes a small short-term move higher he references the last down candle before it, which he calls a bullish order block (3:30, 3:36, 3:41). Once price moves higher off a major support level and starts pricing new higher highs, he says every new buying opportunity is matched up to one of those previous down candles from the earlier decline, and that ultimately everything matches up with the down candles on both sides of the model (4:07, 4:12, 4:15, 4:21, 4:26, 4:30, 4:45, 4:58).
What He Shows In The Buy-Model Chart
He walks a chart that he says covers the market dropping from November 24 into November 29, describing it as a market maker buy model where the market goes down to go higher (5:22, 5:27, 5:33). He points to a down candle on the buy side of the curve, immediately before a move up, and says that displacement shows it was actual hedging where they were buying early before the market dropped lower (5:37, 5:44, 5:46). Once the low is made, he says price came back down to that same down candle and was reclaimed, or the old order block was recapitalised, after which price started to move higher (5:54, 5:57, 6:00, 6:03). He then gives a second level of the same kind: the movement down before another displacement, whose down candle he also calls a bullish order block, and on the right side of the low he says price hit it right to the pip before moving higher, giving two examples of reclaimed bullish order blocks (6:08, 6:12, 6:20, 6:25).
Two things about that passage are worth separating. The “right to the pip” precision is his description of what he sees on the chart, not something this review can check — the chart itself was not available, and the transcript names no instrument and no price. And his framing of the bounces as evidence of market-maker hedging is an interpretation of intent attributed to participants whose identity is not observable from candles.
The Market Maker Sell Model
He describes the sell model as the same thing in reverse, anticipating the market trading higher to go lower (6:34, 6:40, 6:43). On the buy side of the curve, every up candle that sees a displacement or a short-term decline is treated as confirmation that hedging is underway, which in his reading means market makers are selling short early into those rallies (6:52, 6:59, 7:05). On the sell side of the curve, each time price trades back up into an up candle from that earlier advance, he treats the bearish order block as his new short, matched up while price was being built into a premium (7:12, 7:18, 7:21).
The reasoning he attaches to it is worth stating precisely because it carries the load: he argues market makers and smart money are the only ones who can move price around, so if there is a displacement and then bearishness after an up candle, he takes that as evidence they have been hedging and selling short early (7:31, 7:38, 7:40, 7:46, 7:56, 8:01, 8:06). The inference moves from a candle pattern to a claim about who is positioned and why. He calls the technique x-ray vision into price action; read as a descriptive metaphor for his method that is fair, but as a claim that the pattern identifies actual positions it is not established anywhere in the recording (7:46).
What He Shows In The Sell-Model Chart
On the sell-model chart he works to the right of a high that has already formed, focusing on every up candle that showed a willingness to drop during the advance to the left of that high (8:59, 9:00, 9:07, 9:13, 9:18). He points to the last substantial candle before a drop, says price traded up into it and sold off, then gives a second up candle as the next bearish example (9:25, 9:31).
The qualification comes right after, and it is the most useful caveat in the lesson. He says that in the free tutorials a trader would reasonably see that candle as a bearish indication to start looking for lower prices, and that it does not do that — price trades through it instead, and only then forms what he calls a climax high (9:40, 9:43, 9:47). He then continues the example: price trades up into another up candle, which he calls a new short, and finally into a last up candle he says it traded into handsomely and then treated as a displacement lower, which is where he says hedging began and where the selling-short opportunity to complete the profile appeared (9:51, 9:58, 10:03, 10:08). So in his own walkthrough one marked candle failed to reject price, which is a real limit on reading these blocks as signals rather than as reference points.
How To Apply It, In His Terms
His closing summary is that the market maker buy and sell models are used to match up old order blocks from the buy side and the sell side of the curve, and that the thing being waited for is the reclaimed mechanism, where in his description market makers use those same reference points to facilitate new positions (10:15, 10:25, 10:34). Reduced to a procedure in his terms:
- Decide the direction of the broader swing first — lower to go higher, or higher to go lower.
- Name the support or premium reference the swing is aimed at, from his list: an old high, an old low, an order block, a filled void or a closing fair value gap.
- On the first half of the curve, mark the candles that were followed by a small opposite displacement — down candles on a decline, up candles on an advance.
- Wait for the major low or high to form and for price to turn.
- Only then watch for price to come back into one of those marked candles, and treat that revisit as the reclaimed block.
He says he will build on the idea through the coming months of material and will map out examples before the fact, and his instruction for now is to study the examples and work through personal charts — mapping the up candles during rallies and looking for short opportunities during declines (10:42, 10:48, 10:55, 10:59).
Limits And What Is Not Established
Four limits belong with this material. First, no participant data appears anywhere: the candles and the small displacements are all a viewer can see, so the claims about market-maker hedging, accumulation and short selling are his interpretation of intent, not observed positions. Second, no instrument is named for either walkthrough, and the transcript renders no price levels at all, so neither example can be reproduced or checked from the recording. Third, the phrase “right to the pip” is his description of what he sees, and this review did not have the charts; nothing in the article presents that precision as independently confirmed. Fourth, there is no account information of any kind — no entry or exit records, no position sizes, no risk rules and no profit or loss figures — and he explicitly says the material will be developed further in later teachings, so this lesson is deliberately incomplete rather than a finished system.
His own example at 9:43, where price traded through a marked candle instead of rejecting it, is the clearest indication in the recording that these blocks are reference points to watch rather than signals that predict the next move.
Watch The Original Recording
ICT Mentorship Core Content – Month 04 – Reclaimed ICT Orderblock
The Inner Circle Trader · watch page lists upload 8 September 2022 · 669 seconds, about 11 minutes 9 seconds. The speaker opens the recording as teaching 3.4 of the December 2016 mentorship content. This recording is the primary source for every timestamp link on this page.
The recording is not embedded here. An embedded player was tested directly on 15 September 2026 from a BestProps page origin at desktop and mobile widths, and it loads but then reports “Playback on other websites has been disabled by the video owner”, with no duration and no playback progress, while the video itself plays normally on YouTube. No half-working player is left on this page.
The watch page was read on 15 September 2026 and is publicly listed as ICT Mentorship Core Content – Month 04 – Reclaimed ICT Orderblock by The Inner Circle Trader, not private and not unlisted. The upload date and the December 2016 session the lesson belongs to are different dates; they are kept distinct here rather than presented as a contradiction.
Resources
These are the sources checked for this article. The regulator and investor-education pages are general material on assessing trading systems sold to the public, on how futures positioning data is reported, and on short-term trading risk. None of them evaluates this speaker, and none of them verifies reclaimed order blocks, the displacement readings or the market-maker interpretation described above. Any ICT, smart-money or third-party indicator, script, note set, chart annotation, transcript pack or re-upload circulating outside the publishing channel’s own page is unofficial and has not been tested here.
- [1] ICT Mentorship Core Content – Month 04 – Reclaimed ICT Orderblock — The Inner Circle Trader (primary source and the recording transcribed for this article; watch page read 15 September 2026).
- [2] The Inner Circle Trader — official YouTube channel (read 15 September 2026) — the publishing channel for the mentorship series this lesson belongs to.
- [3] CFTC — Fraud Advisory: Commodity Trading Systems Sold on the Internet (read 15 September 2026) — the regulator’s guidance on assessing trading systems sold to the public, including its warning that hypothetical results are typically simulations calculated over past prices.
- [4] CFTC — Commitments of Traders (read 15 September 2026) — the official weekly report of aggregate futures positioning. It is the nearest public, regulator-published data to the question of who holds what, and it is reported at aggregate category level rather than by individual participant or order, so it does not show the hedging this lesson reasons about.
- [5] Investor.gov (SEC) — Day Trading (read 15 September 2026) — investor education on short-term trading risk, relevant background to a lesson built on short-term displacement and short-term entries.
A Note On The Transcription
There was no usable caption track for this recording, so the transcript behind this article is an automatic speech-recognition pass over the full original audio, not human-verified captions and not YouTube’s own captions. The pass covered the complete audio and reported no low-confidence stretches. Because the text is machine-recognised, terms were checked against context rather than trusted as printed: the phrase the audio renders as “previously used sell price” is read here as previously used to sell price, and where the audio says the up candle “sees a displacement or a short-term decline confirms that there are hedging underway” the wording is left as recognised and paraphrased in the prose rather than silently corrected. No instrument, price or level is quoted in this article because the recording states none; nothing has been inferred from the charts, which were not available to this review.
Source: ICT, ICT Mentorship Core Content – Month 04 – Reclaimed ICT Orderblock, The Inner Circle Trader, 8 September 2022. Educational commentary, not investment advice.