
Key takeaways
In this recording ICT defines a bullish vacuum block as a gap created in price action by a volatility event, and says the gap forms through a vacuum of liquidity tied directly to that event 0:46, 0:50, 0:58.
Read the full summary
In this recording ICT defines a bullish vacuum block as a gap created in price action by a volatility event, and says the gap forms through a vacuum of liquidity tied directly to that event 0:46, 0:50, 0:58. The events he names are non-farm payroll, a futures session open, an economic-calendar release such as an FOMC or interest-rate item, and unforeseeable geopolitical news that may not be on the calendar at all 1:02, 1:45, 1:59. Because one candle closes at one price and the next opens at another with nothing traded between the two points, he blocks the high and low of that space out as a range and treats it like any other candle, with an opening, a close and a mean threshold, even though no bar exists there 3:58, 4:04, 4:40, 5:56, 6:35. He says there is a high probability price will want to come back and close the range in, and explicitly declines to put a percentage on it because he says there is no accurate way to depict one 4:34, 4:40. Two outcomes are set out: price trades down into a bullish order block inside the gap and leaves part of it open as a fair value gap, or price trades down through both reference points for what he calls a full return and 100 percent filled 7:04, 7:18, 7:31, 9:45, 10:11, 10:40. He attaches risk instructions at both stages — a stop below the lowest down candle for the earlier entry and below the lowest low for the later one — plus an invalidation level at the close of the first up candle, and a session-timing point about how much of the day is left 7:53, 11:05, 11:18, 11:47, 8:25. He closes by summarising the vacuum block as nothing more than a breakaway gap and describing the bearish version as the same sequence in reverse 12:48, 14:35. The lesson is conceptual: no instrument, date, order, fill price, size, account result or sample of outcomes appears anywhere in it.
How we researched this article
BestProps used document-based research from primary firm sources, checked September 24, 2026. The complete source list, scope, limitations, and commercial-state record appear near the end of this article.
A vacuum block is one of the order-block concepts ICT builds in this mentorship series, and this recording is his lesson on it. In ICT Mentorship Core Content: Month 04: ICT Vacuum Block he opens by identifying the session as teaching 3.6 on reinforcing order block theory and says the specific subject is the vacuum block 0:35, 0:46. The rest of the lesson is spent on what he says produces one, how he marks it on a chart, what he expects price to do afterwards and where he places risk around the two ways the gap can resolve.
Everything below is his spoken account of the concepts and the charts he is displaying. This review worked from an automatic speech-recognition transcript of the full audio and did not view the recording, so the chart readings, levels and reactions described are reported as he narrates them rather than independently inspected. The lesson contains no trade record of any kind, and nothing here should be read as evidence that a gap will close or that the approach is profitable.
His definition of a bullish vacuum block
The definition comes in the first minute. A bullish vacuum block, he says, is a gap that is created in price action as a result of a volatility event, and the gap forms by a vacuum of liquidity directly related to that event 0:50, 0:58. Two examples follow immediately: non-farm payroll can create a vacuum block, and in futures a session open can 1:02.
He then widens the list of events. A large volatility injection can arrive through an economic-calendar release, which in his examples includes non-farm payroll, an FOMC-related event or anything along the lines of interest rates 1:45, 1:51. He adds a category that is harder to prepare for: a geopolitical event that is foreseen, or that may not appear on the economic calendar at all, such as a terrorist attack 1:59. He also describes where this can apply — a futures contract with session opens and closes where there is no trading, an intraday index such as the S&P 500, or any foreign-exchange pair 1:17, 1:28, 1:38.
What follows is the assumption the whole lesson rests on: the market gaps up 2:06. He notes that the first assumption most traders make when they see that is that price will keep going higher right away, and says sometimes it will, but that his purpose is different — using the vacuum block to get in sync with what may be underlying in the marketplace 2:11, 2:25. From that point the gap is treated as something to be read in context rather than as a signal on its own.
The context he checks before the gap means anything
The context test is set out against his diagram. If price traded lower prior to the short-term low in the picture, he says the outline he is giving would be a little bit more probable 2:35, 2:44. If instead the market had been rallying for a number of days or weeks, or had been in a prolonged uptrend, and then gaps, he says that could potentially be an exhaustion gap — which he describes as typically a graphic depiction of capitulation, meaning the last bit of momentum in an underlying trend or direction 2:49, 2:59, 3:08. So the same visual gap up carries a different reading depending on what preceded it.
He spells out the bullish case he wants to work with: a market that has been in a downward correction inside an upward market, or a down market where he expects some kind of bullish news and expects price to reach for liquidity above where it is currently trading, followed by a news release and a gap up 3:16, 3:24, 3:30. In his words, price has gapped up away from a market that is in a discount while he is still expecting higher prices 3:38.
Why he treats the gap as a vacuum of liquidity
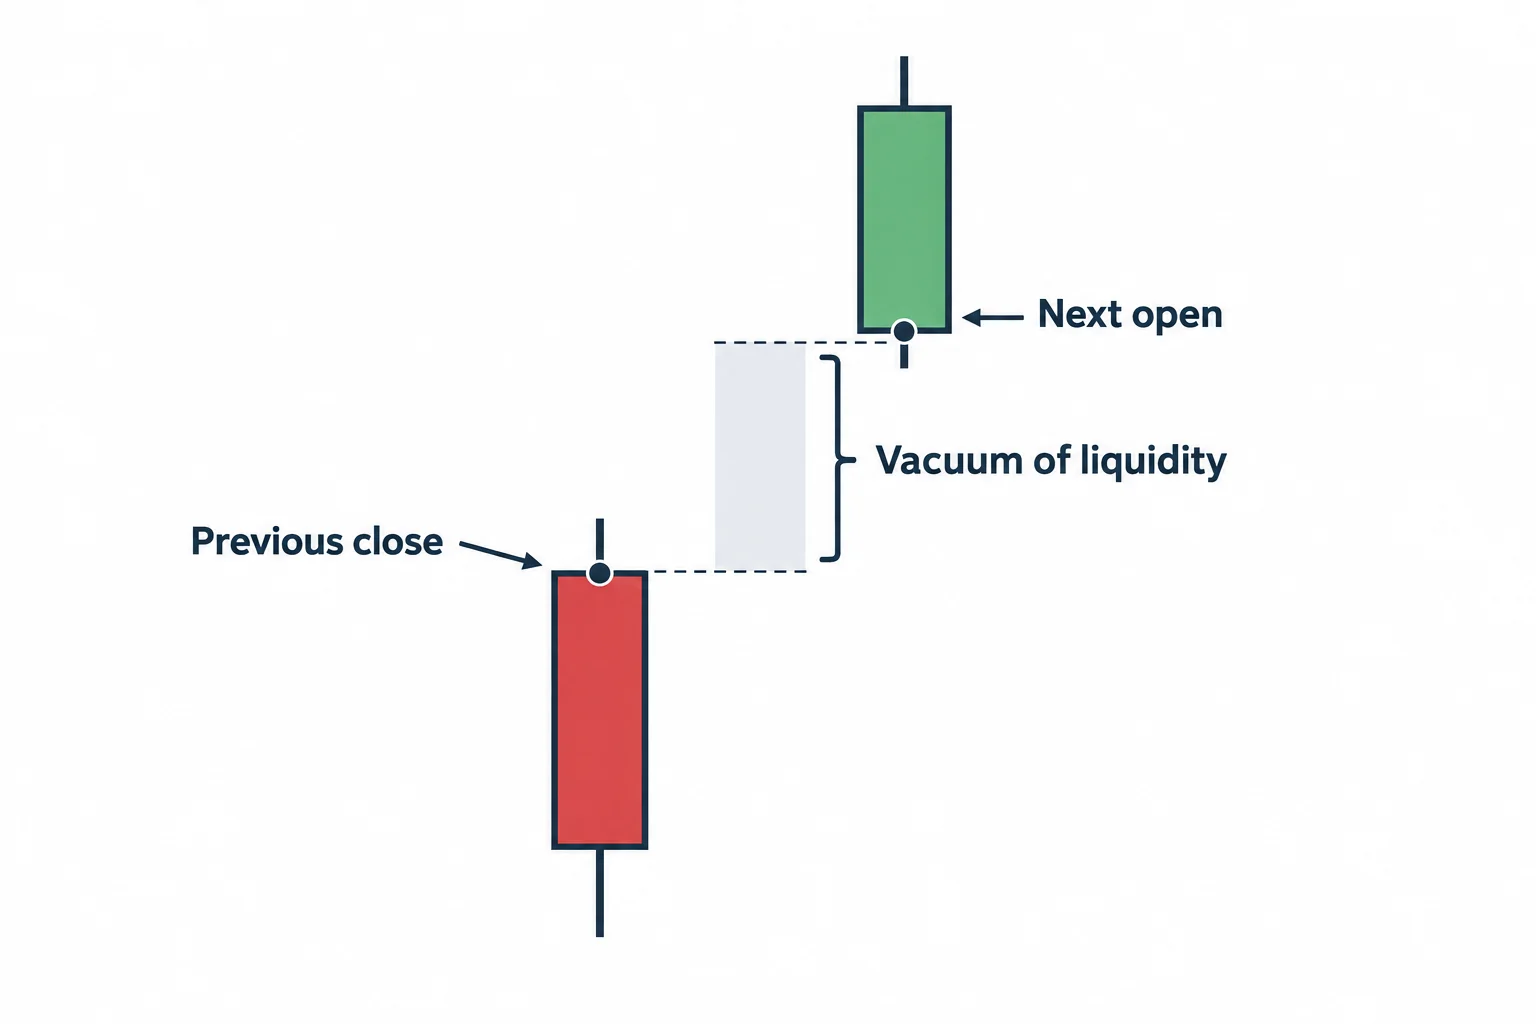
The first thing he asks the viewer to focus on is the space between the two candles, and the reason he gives for that is mechanical: on the charts there is a vacuum of trading, because no trades were made between the previous candle’s close and the next candle’s opening 3:48, 3:58, 4:04. He says the gap can be large, and gives non-farm payroll as an example where it can gap 30, 50 or 60 pips from where it was trading right before the numbers released 4:10.
The explanation he offers for why the space exists is a quick repricing at the central-bank level 4:22. Because that happens, he says, there is absolutely no way for any trader to execute, and no trade occurs between those two price points, which is what creates the vacuum of liquidity 4:26, 4:34. That is his reason for treating the interval as something other than ordinary price movement.
He is careful about how far he takes the expectation. Most times, he says, there is a high probability that the market will want to come back and try to close the gap in — and he states plainly that he is not going to give a specific percentage, because he says there is no real accurate way of depicting that 4:40. He then says he wants the gap identified in a specific manner before drawing any conclusion from it 5:02.
How he marks the gap as a range
Identification is the part he spends the most time on. Once the gap is located, he says, the next realisation is that no trades were made in that range: the market gapped up through it and started trading at a higher price on a new candle when it opened 5:07, 5:18. From there he frames the two questions that the rest of the lesson answers — whether the market will run away from that level and leave the gap open, and if it trades back down, how much of the range can reasonably be expected to close in while he is still looking for a potential buy setup 5:26, 5:36.
Inside that range, he says, is the vacuum block, and the phrase he uses is that a reference point in time has been blocked out 5:47, 5:51. Although there is no candlestick or bar on the chart inside the gap, he argues that price did have a beginning and an end, so the space can be looked at as a handle or as a range — his words are that he is interpreting it and visualising it — and he defines it as the high and the low of the gap 5:56, 6:14, 6:20. If it were treated as a candle or a bar, he says, it would be just the same as anything else: you would expect to see a mean threshold, an opening and a close, so he says he treats it just like any other candle 6:35, 6:47.
The two ways he says the gap can resolve
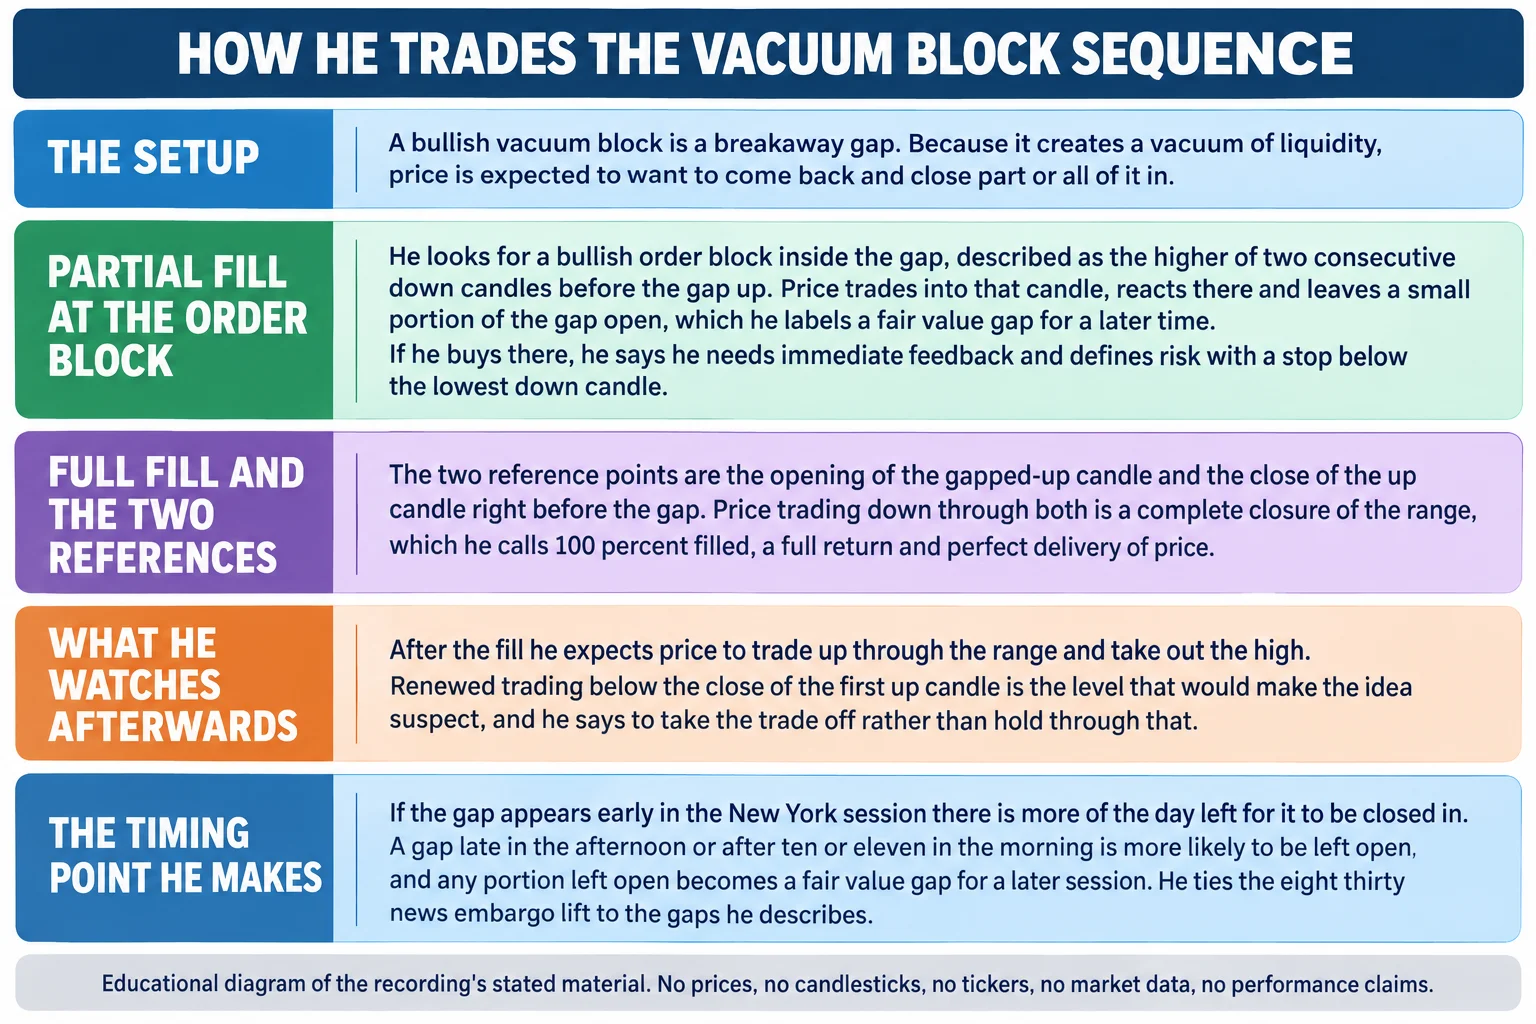
With the gap marked, he sets up two scenarios and assumes price starts trading lower 6:57. Under the bullish reading he is looking for any bullish order block or down candle that would cause the gap not to want to fill entirely 7:04. In the diagram he says he sees exactly that: the down candle right before the up move, and in fact two consecutive down candles 7:18.
His rule for locating it is specific. The bullish order block begins at the higher of the two down candles before the gap up 7:25. As price trades into that candle, he says he would reasonably expect a potential bounce there, leaving a little of the gap open — still intact, but potentially a buy 7:31, 7:41.
He then attaches conditions rather than a recommendation. If you are going to buy there, he says you would have to see immediate feedback, and asks whether the risk of entering there is acceptable 7:44, 7:48. His stated placement is a stop below the lowest down candle, which he describes as the range for managing and defining the risk between those two reference points 7:53, 7:57.
Time of day, and the alternative he describes
He offers a second reading for the same picture. If price trades down to the order-block area and he does not want to buy there, he says he would need a little stronger conviction that price will trade back down into the last up candle before the gap 8:08. The reason he gives is time of day: if there is a lot of the day left to trade, he says New York would probably come down and close that gap in, whereas if the gap happened late in the afternoon he says chances are it would probably be left open 8:25, 8:41.
He ties the timing to where the gap comes from. If the gap is created early in the New York session, or even in London, he says there is more time available for it to be closed in — and he adds that a gap like this usually occurs in the New York session or late New York around an FOMC event, with the 8.30 news-embargo lift being the general example he gives 8:53, 9:03, 9:11. Assuming it is still early in New York, he says 8.30 leaves a relatively decent amount of time for the day to unfold, and in that case he says he could forget the bullish order-block level and anticipate the smaller area still forming 9:18, 9:22, 9:30.
Later in the session he describes the opposite expectation. If the gap arrives in the ten or eleven o’clock hour, he says you may end up seeing that portion of the gap remain open, which would then present what he calls a fair value gap for a later time — price coming back to close it in on a subsequent day while it is left open through the current one 9:34, 9:45, 9:54.
The full fill, and the two reference points that define it
The second scenario is the complete closure of the gap. He names two reference points for it: the opening of the gapped-up candle and the close of the up candle right before the gap formed 10:11. As price trades lower and reaches them, he describes a complete closure of the gap, which he calls a full return on a vacuum block — everything completely closed in, the whole range 100 percent filled 10:24, 10:32, 10:36, 10:40.
He characterises that as, in effect, perfect delivery of price, and says the range is completely balanced out once it has happened 10:43. What he is looking for next is higher prices: if there is liquidity that has not yet been sought out above the highest high formed at the gap opening, he says that bullish liquidity above the marketplace would now allow price to drive higher, which is where he places what he calls a buy 10:49, 10:59, 11:05.
The risk placement changes at this stage. He says buying there and using a stop loss below the lowest low makes the risk more defined for more leverage, while still having the same potential parameters for the percentage of equity exposed 11:05, 11:10. As before, this is his framing of the setup, not a report of a trade he took or of an outcome he achieved.
What he watches after the fill, and when he would exit
After the fill he describes the behaviour he wants to see. If price rallies up from that level, he says he does not want to see it ever come back below the level that would have caused it to close the gap 11:18. The candle he is watching is the up candle that formed at the gap: he says he wants that low cleanly broken through, and specifically does not want to see price hesitate there, because otherwise he says it would be a bearish order block 11:38, 11:47. His expectation is that the bullishness of the move drives right on through that last up candle, on the reasoning that price has already been delivered efficiently — it sold down with the two down candles to close the gap and has now traded back up, so there is no reason for it to return below the last point of reference before the gap, which he identifies as the close of the first up candle 11:52, 11:56, 12:02, 12:32.
He then gives the exit logic for the case where that does not hold. If price does trade back down below that first up candle’s close, he says the chain is probably going to be suspect — and his instruction is to take some profits off if a move like that has already run, and to take the complete trade off if price starts to correct and go lower, on the basis that there is no reason for price to come back into that area once it has already closed the gap 14:07, 14:14, 14:24.
The breakaway-gap label and the bearish inverse
His summary of the concept is deliberately flat: a vacuum block, he says, is nothing more than a breakaway gap 12:48. He then explains why he teaches it that way. Because the gap creates a vacuum of liquidity, the question he returns to is why the gap is sometimes not filled, and his answer is the bullish order block inside the gap: price gapped up, comes down only as far as that order block, stops trading lower and rallies away, leaving a small gap 13:05, 13:16, 13:26. That leftover is what he classifies as a fair value gap, to be used at a future time when price is trading lower and he is looking for it to come down and close that gap in 13:26, 13:31.
If it stays open instead, he says that while he is bullish he would label it a breakaway gap, and it would show willingness and strength for higher prices 13:35, 13:45. When the gap is closed in, his description is that the vacuum of liquidity has been filled: price gaps up, the gap is closed by delivery on the downside, and price then trades bullishly up through it, which he calls both passes in price and delivery 13:51, 13:56.
He finishes with the mirror image. This, he says, is a bullish vacuum block, and the reverse would be seen if price had gapped lower: he would wait for that gap to fill in on up candles and then go short in the same manner, describing it as the long system run in reverse 14:31, 14:35, 14:41.
What this recording establishes and what it does not
The definition, the marking of the gap as a range with an opening, a close and a mean threshold, the bullish-order-block condition, the two reference points for a full fill, the invalidation level at the close of the first up candle and the session-timing point are all stated on the recording and can be read from it directly. What cannot be taken from it is any evidence about how often these situations resolve the way he describes. There is no instrument, no date, no entry order, no fill price, no position size, no account figure and no result anywhere in the lesson, and no sample or win rate behind the words high probability — which is the reason he gives himself for withholding a percentage 4:40.
Two further cautions follow from the source. The first is that the chart readings and the pip magnitudes are his narration of charts he is displaying; this review did not watch the recording, so none of them has been checked against the screen. The second is that the instructions he attaches to each stage — stops, invalidation levels, taking profits or coming out of the trade — are his description of how he manages the idea, not tested guidance, and repeating them here is not a recommendation to trade this way.
Watch the original recording
ICT Mentorship Core Content – Month 04 – ICT Vacuum Block
The Inner Circle Trader · watch page lists upload 9 September 2022 · 891 seconds, about 14 minutes 51 seconds. The recording identifies itself as teaching 3.6 of the mentorship, on reinforcing order block theory. This recording is the primary source for every timestamp link on this page.
The recording is not embedded here. An embedded player was tested directly on 15 September 2026 from a BestProps page origin at desktop and mobile widths: the frame loads but then reports “Playback on other websites has been disabled by the video owner”, with no duration and no playback progress, while the video itself is publicly playable on YouTube. No half-working player is left on this page.
The watch page was read on 15 September 2026 and is publicly listed as ICT Mentorship Core Content – Month 04 – ICT Vacuum Block by The Inner Circle Trader, not private and not unlisted, with an upload timestamp of 9 September 2022 and a listed duration of 891 seconds — against a transcribed audio duration of 890.2 seconds.
A note on the transcription
The transcript behind this article is an automatic speech-recognition pass over the full original audio of this recording, not human-verified captions and not a caption track. It covered the complete audio and repor