
Key takeaways
This is teaching 3.3 of the ICT Mentorship, on rejection blocks (0:34).
Read the full summary
This is teaching 3.3 of the ICT Mentorship, on rejection blocks (0:34). He builds them from two reference points inside a swing: a bearish rejection block is the range between the highest wick high of a swing high and the highest open or close in that swing, and a bullish block mirrors it from the lowest wick low and the lowest open or close of a swing low (5:17). He treats the framed range like an order block – a bearish block from the bearish side, a bullish block from the bullish side (10:34). The point that separates it from a plain false breakout is that a failure swing does not require a new extreme: price can clear the previous highest body and reverse without taking out the wick high (7:31). He gives two entry options – sell at the low of the range with a stop above it, or wait for price to trade through that line and, if it fails to reach a higher wick high, sell a stop below it (10:43, 11:20). He ends by asking the viewer to go and find examples on their own charts (15:05). Nothing in the recording is tested; the levels, entries and stops are his description of a method, not fills or results.
How we researched this article
BestProps used document-based research from primary firm sources, checked September 24, 2026. The complete source list, scope, limitations, and commercial-state record appear near the end of this article.
In ICT Mentorship Core Content – Month 04 – ICT Rejection Block, the speaker sets out a way of framing the body of a swing high or swing low as a tradeable range. This article follows the recording in order and links each point to the passage it comes from.
Two limits run through it. He is narrating his own annotations on charts he is not shown to be verifying, so the article reports his readings rather than measured levels or fills. And the transcript is automatic speech-to-text of the audio rather than a checked caption track, so the renderings that are ambiguous are flagged near the end instead of being silently corrected.
The false breaks he starts from
He opens by asking the viewer what they see at major highs and lows, then answers with the examples on his chart: old highs violated followed by a significant move away from them, which he calls a Turtle Soup or a false breakout (0:44, 1:15). He is explicit that this is easy in hindsight and hard in advance, and his stated remedy is repetition – going through charts until the formation is recognised as it builds (1:32).
He reads the two major examples as mirrors of each other: a false break above an old high followed by rejection and a significant swing lower, and a false break below an old low followed by a significant rally higher (2:01). His interpretation of what is happening underneath is consistent throughout the lesson: selling stops resting below a low are run out, so he expects a repricing higher to reach the buy-side liquidity above (2:24, 2:28).
He then names each event. A run below an old low is a turtle soup long and a run above an old high is a turtle soup sell (2:46). The general rule he extracts for daily charts is anticipatory: every time a new high or low forms, he expects some measure of rejection (3:28), which he calls the hardest skill of the ones he teaches to develop.
He also flags the limit of his own framing here. He says he expects these formations to be easy to see in the chart after the fact, and that the real work is seeing them form beforehand – an exercise in chart familiarity rather than a measured edge.
The bearish rejection block
He introduces the bearish version as the different approach he wants to teach, after the equal-highs example where buy stops above the equal highs have been run and he expects a sweep through, a rejection and a trade lower (4:06, 4:19, 4:29).
The construction he gives is precise. Ideal setups are found in major to intermediate downtrends, and the bearish rejection block is formed when a price high has formed with long wicks, which can be more than one candle, and price reaches up above the body of those candles to run the buy-side liquidity out before the market rejects (5:11, 5:22, 5:27).
He contrasts this with what a classic chartist would see. Several wicks forming resistance, price running up for a good number of candles and then consolidating, looks like a continuation pattern – a bull flag or a pennant (5:49, 5:54). His objection is categorical: price does not move because of animal patterns or supposed geometry, it moves on orders (6:03).
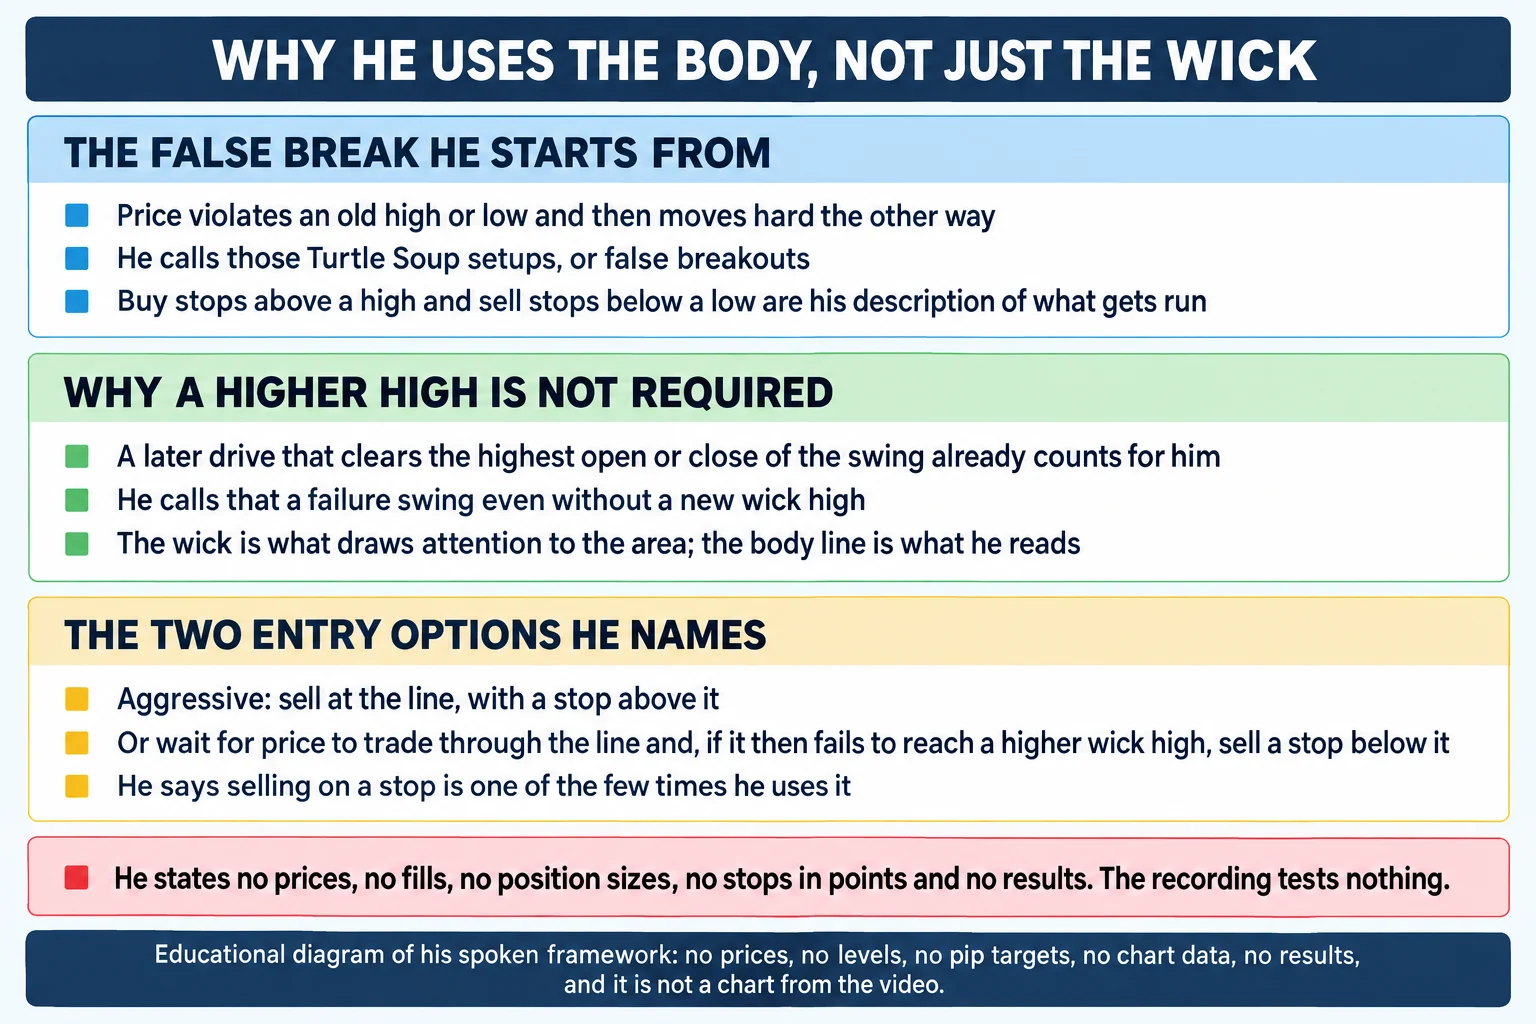
The observation that carries the pattern is the body, not the wick. He tells the viewer to notice the highest body in the formation and the most recent candle that traded through it (7:01), and he states the rule plainly: price does not need to make a higher high to have a failure swing, if you read the bodies of the candles (7:31). Wicks, in his description, are what draw attention to the area rather than what defines it (9:29).
He repeats the framing with an important qualification for anyone reproducing it. Whether the highest candle closed bullish or bearish does not matter; what matters is the highest high with the highest open or closing price inside the highest wick that frames the block (9:48, 9:56).
Having defined the range, he says how to treat it: as a candle in its own right, as a selling block, and in his words as a bearish order block (10:20, 10:29, 10:34). The trigger is the low of that range (10:39).
The two entry options he names
He offers two ways to act on the block and leaves the choice to the viewer. Aggressively, sell at the low of the range with a significant stop above that level; or wait for price to trade through it a little before acting (10:46, 10:51).
The second option is the one he develops, and he is specific about the condition attached to it. If price trades above the highest open or close by a significant amount, and does not then trade up to a higher wick high, he says you can be a seller on a stop below that level – which he describes as selling on weakness (11:20, 11:29, 11:33). He notes that selling on a stop is one of the few times he uses that as an entry pattern (11:35).
He then shows a chart example of the construction: a candle with a wick, the highest body reference point being the open in that case, and price trading above it slightly before running for the sell-side liquidity below (11:50, 11:53, 12:05). He does not state a level, a fill or an outcome for that example.
The bullish rejection block
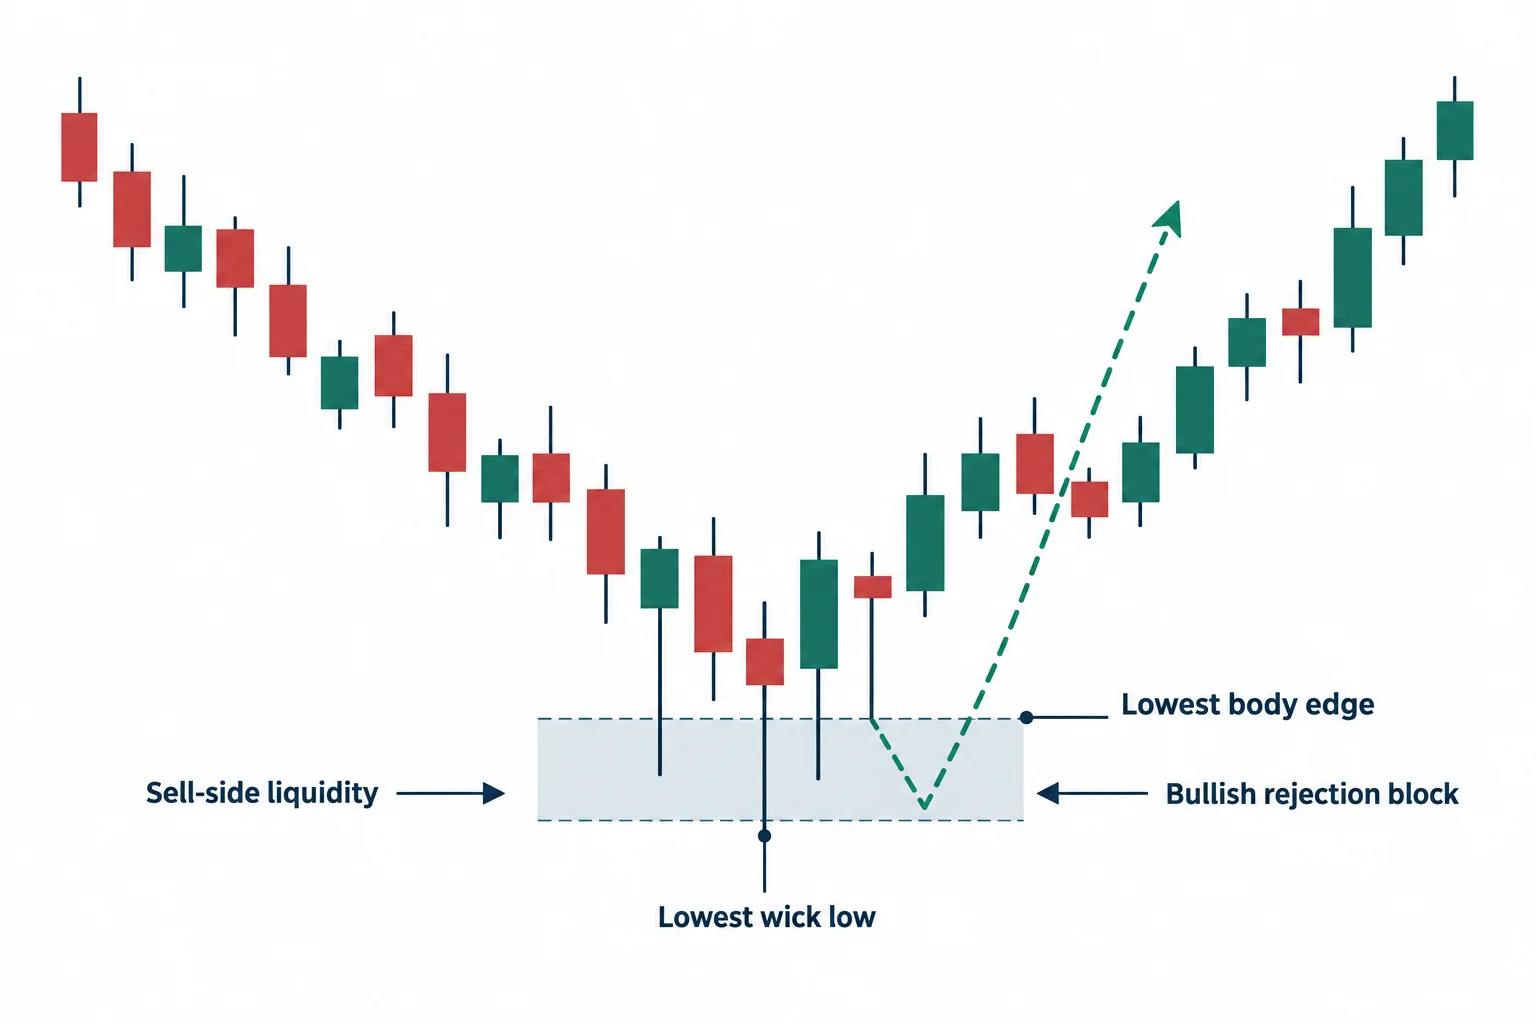
The bullish version is presented as the mirror, with its own stated context. In ideal scenarios it appears in major to intermediate uptrends, and it forms when a price low has a long wick or wicks, possibly over multiple candles, and price reaches below the body of those candles to run the sell-side liquidity out before rallying (12:13, 12:21, 12:39).
The framing rule is the same rule inverted: the lowest wick low together with the lowest open or the lowest close that makes that swing low, on whichever timeframe the pattern is being read (12:53, 13:00). He treats the result like a bullish order block (13:07).
For entries he again gives two: buy just below the upper edge of the block when price trades back down into it, or, on a longer timeframe, wait for price to trade through the block a little and then buy on a stop just above that level (13:15, 13:30, 13:33). The trigger level he repeats is that high – meaning the lowest open or lowest close in the swing low – and the key condition he attaches is that the swing low must carry a wick or wicks (13:36, 13:43, 13:45).
What he says the pattern is for
He gives the pattern a practical use beyond entries. It is not always required to see a higher high for a failure swing or a lower low for a turtle soup long, and he says levels framed this way can be used as profit objectives – for example covering a short just below the lowest open or close in a previous swing low (14:02, 14:28).
The instruction he repeats is not to demand that price reaches below the wicks. The bodies of the candles, in his words, are the closest thing to institutional understanding available when working through retail platforms (14:33, 14:38, 14:43).
He closes by saying more entry material will follow in the mentorship and by asking the viewer to go through their own charts to find rejection blocks and the moves that followed them (14:56, 15:05).
What this article is not claiming
The recording is a teaching session, not a test. It contains no prices, no fills, no position sizes, no stop distances in points, no transaction costs and no trade outcomes for any of the examples, and nothing in it measures whether the pattern works. The order-flow story he tells – buy stops above a high, sell stops below a low, liquidity being run before a reversal – is his interpretation of why price behaves as it does, and the transcript cannot establish who was trading or why.
His entry remarks are described here because they are part of what he teaches, not as a recommendation. Any use of a rejection block would still be one trader’s pattern reading applied to a chart the article cannot see.
The transcript is also audio only. It records what he said while pointing at charts, so the candle structures, the body and wick references and the framed ranges are reported here exactly as he described them and were not independently verified against any chart.
Date and identity note
The upload date and the lesson date are separate facts and are kept apart here. The YouTube watch page shows the recording published on 8 September 2022 and running about 15 minutes 15 seconds, while the recording introduces itself as teaching 3.3 of the mentorship (0:34). The charts he discusses are not dated in the recording, so nothing here dates them.
A note on the transcription
This article was written from automatic speech-to-text of the original audio, not from a checked caption track, so a few renderings are ambiguous and are flagged rather than silently corrected. The term he uses for a false breakout is transcribed variously as “turtle soup” and, in the plural passages, as “turtle suit” (3:48); both refer to the same setup. The word he uses for the down candle is transcribed as “cell” in places, as in “a turtle soup cell” (2:53) and “cell stops have been ran out” (3:00), where “sell” is meant. Where the meaning was clear from context the normal spelling is used in this article; where it is not, the ambiguity is left visible.
Watch the original recording
ICT Mentorship Core Content – Month 04 – ICT Rejection Block
The Inner Circle Trader · published to YouTube on 8 September 2022 · listed at 915 seconds, about 15 minutes 15 seconds. The recording identifies itself as teaching 3.3 of the mentorship. This video is the primary source for every timestamp link above.
The recording is not embedded here because the video owner has disabled playback on other websites. That was tested directly on 15 September 2026 from a BestProps page origin at both desktop and mobile widths: the embedded player loads and then reports “Playback on other websites has been disabled by the video owner”, with no playable stream and no duration reported in either case. The link above opens the recording on YouTube itself.
Resources
These are the sources checked for this article. The Investopedia pages are general references for the conventional concepts the lesson positions itself against – resistance as a level, and the breakout that fails at one – and the CFTC advisory is the regulator’s own note on risk in the retail forex market this kind of chart work is applied to. None of them assesses this speaker or tests anything he says. Any ICT, smart-money or third-party indicator, script, note set, transcript pack or re-upload circulating outside the publishing channel’s own page is unofficial and untested here.
- [1] ICT Mentorship Core Content – Month 04 – ICT Rejection Block — The Inner Circle Trader (primary source; watch page and metadata read 15 September 2026, published 8 September 2022, listed at 915 seconds).
- [2] The Inner Circle Trader — official YouTube channel (read 15 September 2026) — the publishing channel for the ICT mentorship series this lesson belongs to.
- [3] Investopedia — Resistance: What It Means in Trading (read 15 September 2026) — general reference for the conventional resistance idea the lesson contrasts its candle-body reading with. Contains none of the lesson’s charts and endorses nothing here.
- [4] U.S. Commodity Futures Trading Commission — Fraud Advisory: Foreign Currency (Forex) Fraud (read 15 September 2026) — the regulator’s statement that the forex market is volatile and carries substantial risks. Context only; it is not a comment on this speaker or this method.
Source: ICT, ICT Mentorship Core Content – Month 04 – ICT Rejection Block, The Inner Circle Trader, published 8 September 2022; the recording identifies itself as teaching 3.3 of the mentorship. Captions were not available, so the transcript is automatic speech-to-text of the original audio under SHA-256 0a245296affd59642b2d81eaeea1a9fdb2e0be0606c0a2586d57cc90a4ad5913. Educational write-up of the speaker’s own framework; it is not trading advice, and no pattern, reading, level or setup described above has been tested or verified here.