
Key takeaways
ICT Mentorship Core Content Month 04 module two from the December 2016 teachings is an approximately forty-four-minute lesson explaining external range liquidity as buy-side liquidity above a current range high and sell-side liquidity below its low, while internal range liquidity includes fair value gaps, liquidity voids, order blocks, and market maker models inside the range.
Read the full summary
ICT Mentorship Core Content Month 04 module two from the December 2016 teachings is an approximately forty-four-minute lesson explaining external range liquidity as buy-side liquidity above a current range high and sell-side liquidity below its low, while internal range liquidity includes fair value gaps, liquidity voids, order blocks, and market maker models inside the range. ICT says liquidity runs pair orders with pending liquidity pools and favors low resistance runs aligned with monthly or weekly direction, since countertrend setups may stall or stop out. Using monthly, weekly, daily, and four-hour Japanese yen charts, he shows that the same lows can be internal liquidity within a newer high-to-low range yet external liquidity relative to an earlier low-to-high range. His predominant model enters at internal range liquidity and exits at external range liquidity, such as shorting a bearish order block inside the range and covering below the low, or buying short-term liquidity sweeps when the monthly objective is higher. A move beyond a daily high can therefore be daily external liquidity while remaining monthly internal liquidity. He describes gap risk as rapid repricing through an area with little or no prior trading, expects fair value gaps and voids to fill, uses the top of a prior up candle and the next candle open as a potential reaction area, rejects twenty-pip ranges as too small, requires at least forty pips, and stresses that traders cannot know how far a run will travel or reliably call the final high. The review relies on an automatic transcript without independently viewing the charts, and several narrated price levels appear inconsistent and are left unreconciled.
How we researched this article
BestProps used document-based research from primary firm sources, checked September 24, 2026. The complete source list, scope, limitations, and commercial-state record appear near the end of this article.
This recording is one of the liquidity lessons in the Month 04 material, and it is the one where ICT lines the liquidity vocabulary up against the time frames. In ICT Mentorship Core Content: Month 04: Reinforcing Liquidity Concepts & Price Delivery he identifies it as module two of the December 2016 teachings and names the subject as reinforcing liquidity concepts and price delivery 0:35, 0:43. It is a long session at about forty-four minutes, and almost all of the chart work is on one instrument, described as a monthly Japanese yen chart 9:11.
Everything below comes from an automatic speech-recognition transcript of the full audio, and this review did not view the recording or its charts. The chart readings and price levels described are reported as he narrates them rather than independently inspected. There is no order record, position size or account result anywhere in the lesson, and nothing here should be read as evidence that the framework produces the outcomes he describes.
External and Internal Range Liquidity in ICT
The first item on his list is external range liquidity, and he defines it against whatever range is currently in force: the current trading range will have buy-side liquidity above the range high, and it will have sell-side liquidity below the range low 0:47, 0:54.
He then explains what a run actually does. Runs on liquidity, he says, seek to pair orders with pending order liquidity that is held in the form of a liquidity pool 1:09. He adds the distinction that matters for trade selection: external range liquidity runs can be low resistance or high resistance in nature, and as a trader you want your trades in low resistance conditions, with no resistance in the path of profitability 1:19, 1:24, 1:29.
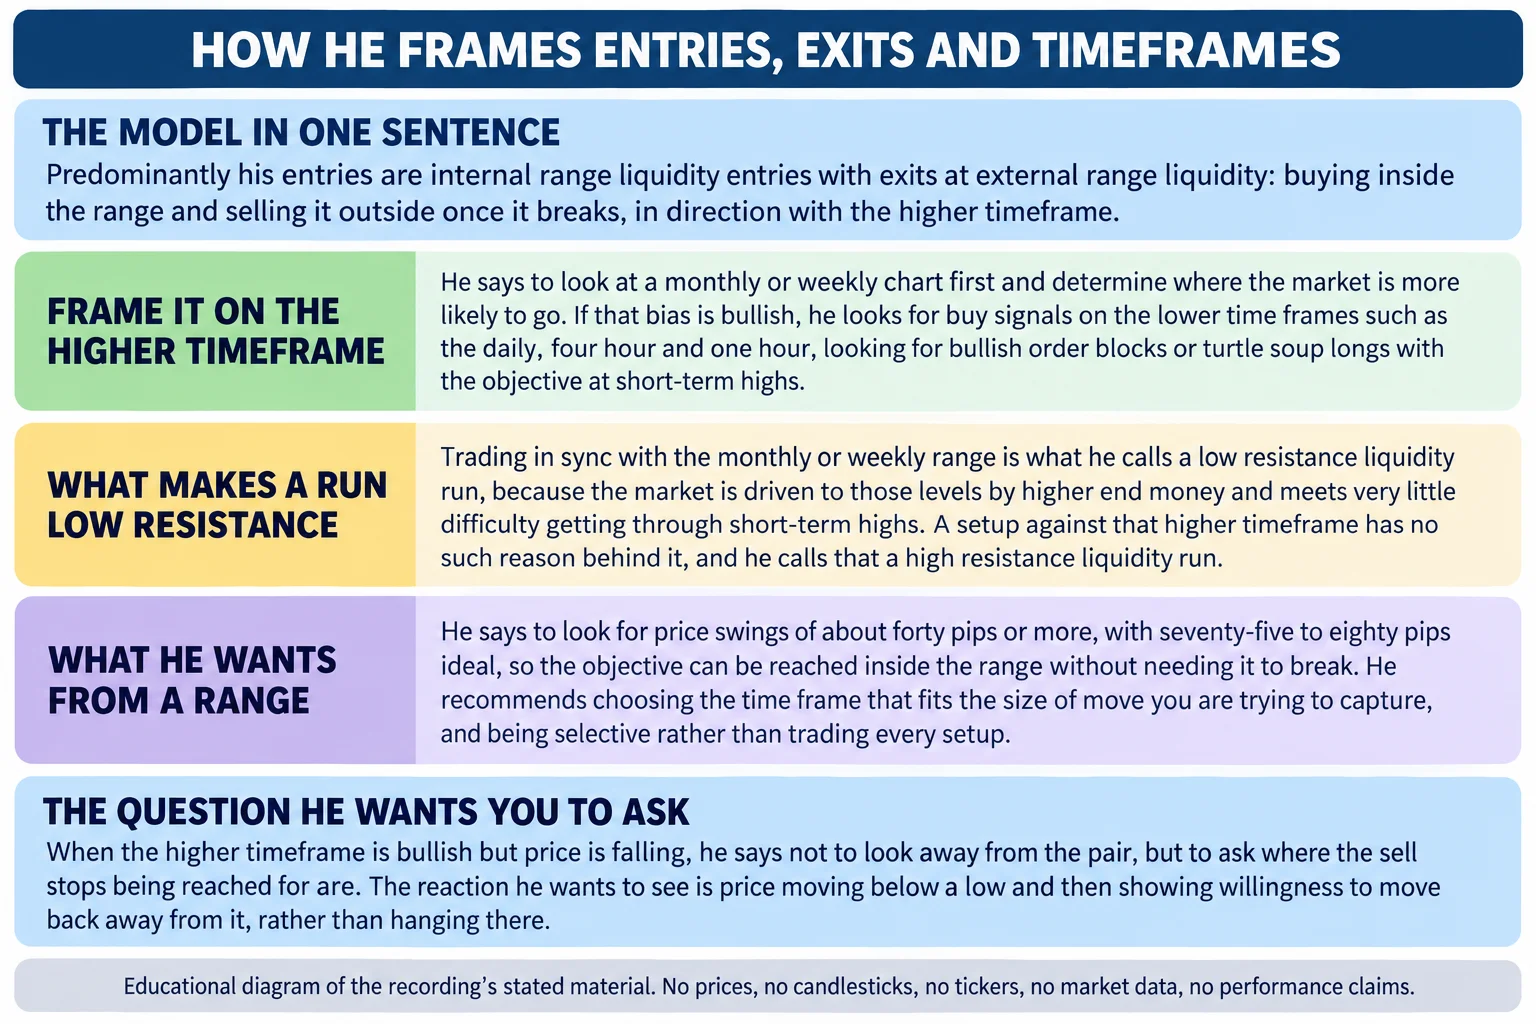
Second on the list is internal range liquidity. When the current trading range is likely to remain, he says, liquidity voids will fill in, and that is associated with gap risk; fair value gaps will also fill in, and he attributes that to the same gap risk 1:41, 1:49, 1:57.
His definition of gap risk is worth giving in his own terms, because it is the concept the rest of that section hangs on. Gap risk is nothing more than the market quickly repricing to a level where there was very little or no trading, closing in a range that contains only one unusually long candle 1:57, 2:03. He then makes it concrete: whenever you are in a long and you have a big gap underneath you, that is gap risk, and he says the market will often reprice aggressively to close those ranges in 2:11, 2:22.
He finishes the list with what sits inside a range besides the gaps. Order blocks inside the trading range, he says, will be populated with new buys or new sells, and market maker buy and sell models will form inside trading ranges 2:27, 2:32.
ICT Liquidity Sweeps and Price Retracements
He then moves to the chart to show external and internal range liquidity side by side and the difference between them 2:44, 2:49. The setup he describes is an old high, with an old area of consolidation or equilibrium sitting about halfway from the low up to that high 2:57, 3:06. Price sweeps above the old high, and he labels that a form of external range liquidity, because it sits outside the range measured from that high down to the lowest point, the range that existed before the new breakout 3:12, 3:21.
What he points out next is the feature he cares about inside the range: there are clean lows directly below, so he says he looks for a move that could potentially come down to that level 3:34, 3:39, 3:47. Price then starts to drop and trades down, and he describes what it is doing as pulling back inside all of those up candles 4:03, 4:09.
That leads to his rule of thumb for the retracement. Once an old high is cleared, he expects some measure of retracement, and the question he asks is where the most logical area is for price to pull back down into 4:14, 4:21, 4:25.
His answer on this chart comes from two adjacent candles. There is a previous up candle that is rather large, then a candle with a wick, and at one point that second candle opened and traded lower 4:25, 4:31. Because of that, he says both candles in that area delivered price. The delivery was on the up move in one and down in the other, and even though the second one closed up it was offered twice all through that range 4:43, 4:49, 4:56. That is what leads him to the level he would expect a short-term bounce from: the top of that candle and the open of the next one 4:56, 5:01.
He then narrates what follows: price trades into it, stalls a little, goes right through it, comes back and retests the same level, and ultimately comes down and clears out the equal lows 5:01, 5:13, 5:19.
How ICT Liquidity Labels Change by Range
At that point he puts the question to the viewer, and it is the pivot of the whole lesson. Now that price has traded below the old low, where is the next level of liquidity, and are the stops below those lows external or internal range liquidity 5:25, 5:32, 5:35? He answers it himself against the chart: in the context measured from this high to this low, those stops are internal range liquidity; but measured from this low up to this high, they are external range liquidity, because price is piercing it down there 5:59, 6:03, 6:09.
He states the mechanism behind that plainly: the range was created from this low to this high, so the expectation is that this range gets given up and the stops are run out there 6:14, 6:18. What he refuses to do is predict what happens after that. He says they never know whether the market will bounce or trade higher or make a new high, and that what they look for instead are the areas of liquidity 6:25, 6:30.
ICT Fair Value Gaps and Internal Range Liquidity
From the redefined range he builds the objective. He points at an up candle and says he can reference the low of that up candle rather than the black one, and then measure that opening price and extend it in time 6:44, 6:51, 7:02. He then draws attention to a second feature: there is a wick on one candle and a wick on another, and between them price was only delivered on the downside, which in his terminology is a fair value gap 7:02, 7:05, 7:09.
The levels he states for the upside are worth reporting exactly as spoken, because this is where the transcript is not fully reliable. He says that if price starts to trade higher he would expect the market to want to reach up into a level he renders as 106.50, and that if it trades through the green up candle he would expect it to reach up into that candle’s high at 114.55 with a low at 115.95, offering 115.90 or 115.80, or 114.55 or 114.60 as usable levels 7:13, 7:19, 7:24, 7:42. He then reiterates the same idea further up, naming 106.25 as the first level and describing price as ultimately trading as high as a candle’s low around 118.85 to 118.90 8:13, 8:36. Later in the lesson he refers to a reasonable upside objective rendered as 115.25 to 115.75, and near the end to a level above 125.77 30:17, 42:29.
Those figures are reported here as the audio renders them and not reconciled: two of them, 106.50 and 106.25, sit far below everything else he marks on a chart he describes elsewhere as trading down into the 120s, so they are most likely misrecognitions of a higher number. The article deliberately does not silently correct them to a guessed value 7:13, 8:13, 27:55. What can be taken from the passage without the numbers is the structure: a fair value gap is the reference, the objective is the range closing back in, and he treats the whole thing as internal range liquidity being sought from inside a larger range 8:51.
He confirms that reading when he says price trades all the way up into the shaded area, and notes that because this is a monthly chart of the Japanese yen he is going to drop into a weekly chart to show how those levels affected price action and delivery 9:02, 9:11, 9:18. On the weekly view he says the fair value gap is refined further (there is a wick on one side and a wick on the other), and the point he makes about it is that only on that down candle was price delivered on the sell side, with no upside offered until now 9:32, 9:39, 9:45, 9:52.
How to Update the ICT Liquidity Range
He generalises from the chart into an instruction. Every time the market creates a trading range going lower, he says, you mark off the previous high and the new low, and when price trades back up you are trading inside that range 9:56, 10:02, 10:03, 10:10.
That leads to the sentence that summarises his model. If you trade short at a bearish order block, which he defines as the last up candle, that is an internal range liquidity entry, but you are looking for external range liquidity to exit on. Price runs down and hits the stop area below the low, and that is where he looks to exit 10:10, 10:15, 10:20, 10:27. His own summary is that predominantly his entries are internal range liquidity entries with exits at external range liquidity, buying inside the range and selling it outside once it breaks, provided he is in sync with the marketplace and knows which way it wants to go 10:27, 10:33, 10:39.
He ties that sync to the monthly chart. If he is looking for higher prices relative to the monthly, then any time the market comes down below a short-term low he can be a buyer of that short-term external range liquidity, or buy stops, with the expectation that the range will keep going higher while it seeks the monthly internal range liquidity in the form of the fair value gap 10:56, 11:01, 11:07, 11:13. He acknowledges he is probably confusing some listeners at that point and says the point is simply that once you understand on the higher time frame where the market wants to go, you can frame your setups as you drop into a daily chart 11:19, 11:24.
ICT Liquidity Ranges Across Nested Timeframes
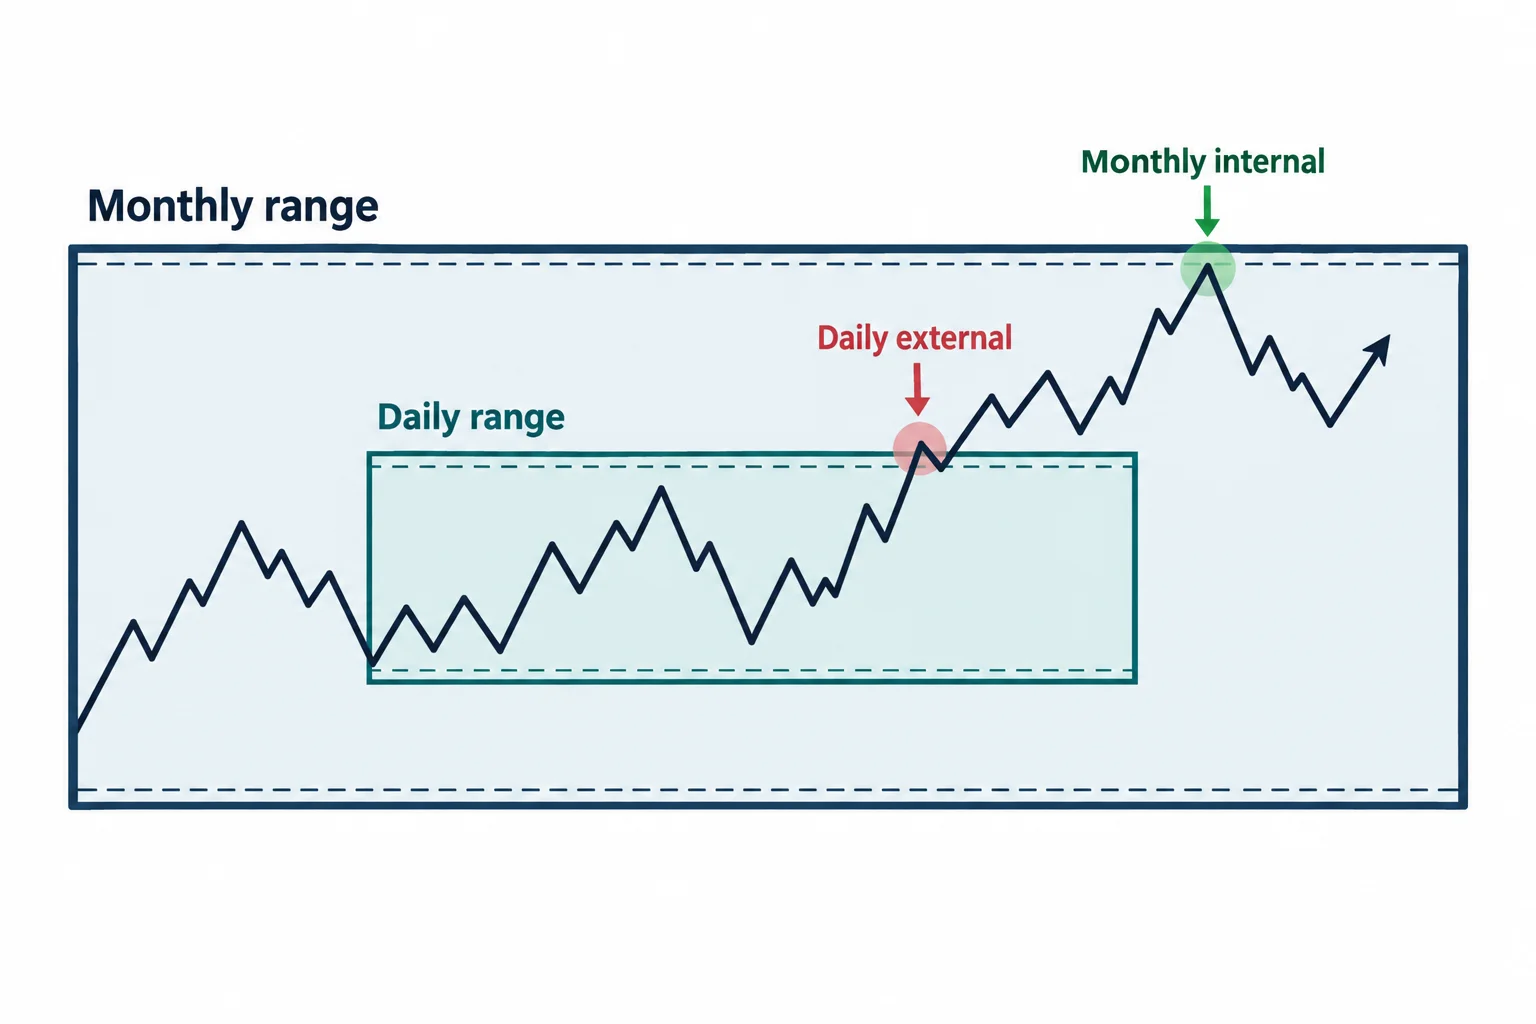
On the daily chart he shows the difference directly. Each time the market makes a new high in the monthly range he calls that a run on external range liquidity on the daily time frame, but on the monthly chart it is still internal range liquidity, because price is only moving inside a larger monthly range 11:51, 11:57, 12:04.
Understanding where the monthly and weekly are trying to trade to is, in his words, the recipe for low resistance liquidity runs, because the trade is in sync with where the monthly most likely wants to see price go 12:20, 12:28, 12:31. He states the rule twice: every time a run above an old high is expected, that is framed as a low resistance liquidity run, and the reason price reacts with very little resistance at those levels is that it has an agenda and wants to get somewhere relative to the higher timeframe, because, as he puts it, the funds trade on the monthly and weekly basis 12:36, 12:42, 12:54, 13:06.
On the four-hour chart he then demonstrates it: each high is run out with very little difficulty, including one that he says you cannot even see the monthly fair value gap from, and he attributes that to the runs being framed on the monthly 13:21, 13:33, 13:39. This is also where he answers a question he says he gets constantly about how he knows where to reach for specific buy stops in live sessions: his answer is that he uses the higher-timeframe institutional order flow to frame out where internal range liquidity is, where external range liquidity is, where the buy stops are, and how the entry aligns with the higher timeframe 14:03, 14:08, 14:14.
He walks the sequence: the market trades down and clears some stops, gaps down below on the election, closes in that range back down to a previous bullish order block, rallies through and hits the old high, clears all those highs out, and ultimately trades into the monthly fair value gap 14:29, 14:38, 14:44, 14:50, 15:01.
ICT Liquidity on 15-Minute and Hourly Charts
He takes the same idea down to a fifteen-minute chart to divide the days and show how price responds when it gives a new range 15:30, 15:36. The pattern he repeats is: a low and a high, price trades down into the previous order block, which is where the external range liquidity sits, so in his terms you are buying internal range liquidity with the expectation of seeing price move to the outside of the range created by that little move 15:44, 15:51, 15:55. The question he raises against the obvious objection is whether you collapse your entire trade at that first objective, and his answer is no. You are looking for the ranges to take out the highs 16:04, 16:09.
He describes the re-population he expects along the way: the last down candle right before the up move, price trading back down into it, more buys populating on that order block, then the run for the external range liquidity above the high, a small consolidation, another retracement into a down candle, and more buy orders repopulating 16:15, 16:20, 16:25, 16:38. At the reaction up at the monthly fair value gap he says there was a lot of profit taking, and he offers a short-term view that it looked indicative of a bit more rally when the market opened on Sunday, an observation about a session he was watching, not a verified forecast 16:45, 16:50, 16:54.
He then makes the patience point in the middle of the examples. All of this is what you have to sit in, he says, but ultimately if you give it time the market returns to a previous order block and repopulates it with more buy orders, because getting up to that level is a long-term objective, so they buy some here, buy more there, let time pass, and come back down to buy again before it finally runs away with the position built and averaged around that area 17:33, 17:42, 17:47, 17:51.
He repeats the pattern on further dollar-yen examples and answers the question he says people ask about which lows qualify. A low price rallies up and comes back down to a previous order block; a run from the low to where the external range liquidity and buy stops sit above; and in one case he declines to use a particular low because it is a consolidation rather than a swing, saying price moved away from that consolidation and came back down to hit the previous order block instead 18:27, 18:34, 18:40, 18:44.
The rule he states from all of that is the one to take away from this middle section: you are looking to buy with internal range liquidity or a bullish order block inside a previous range, and to take profit at an old high or above it, while being in sync with a higher-timeframe directional bias based on institutional order flow 19:00, 19:05, 19:12.
How Often ICT Liquidity Setups Appear
Across the examples he puts a rough frequency on it: almost two or three a week, even on a pair he says he does not even like to trade 20:18, 20:23. He also explains what to do when no new range is forming. You can go through the marketplace and find the swing lows and wait for price to trade through them on the downside, because when it does that it is picking up orders to accumulate new longs 21:03, 21:10, 21:18.
He then names the two disciplines he says a trader ends up choosing between: spotting turtle soups and looking for buy-side or sell-side stop runs, or looking for a return back to fair value and trading inside the range by buying internal range liquidity 22:05, 22:09, 22:13, 22:19. Framing the market in either of those two disciplines, he says, makes finding setups straightforward, and he is careful about frequency, saying it is not that you have to find a setup every single day, but that you will find one once a week, and that one setup per week is all you are looking for 22:24, 22:35, 22:41.
ICT Hourly Liquidity Walkthrough and Skipped Month
He zooms out to the hourly chart and scrolls back from the point at which price traded into the objective based on the monthly chart, then points out the buying opportunities week by week, Monday and a Thursday buy, a Tuesday continuation, a Wednesday buy at a previous o