
Key takeaways
ICT presents the mitigation block as an order block concept for selling rallies in bearish step-ladder markets or buying declines in bullish ones.
Read the full summary
ICT presents the mitigation block as an order block concept for selling rallies in bearish step-ladder markets or buying declines in bullish ones. The bearish setup uses an M pattern, defined as a failure swing followed by a break below its internal low that confirms a market-structure shift. After the break, mark the last down candle inside the broken short-term low, then wait for price to return to the entire candle range. A is the earlier low and buying area, B the short-term high, and C the subsequent decline. The return to A lets underwater longs from the A-to-B swing liquidate or mitigate losses, creating the selling opportunity ICT calls buyer's remorse. Sell within the whole last down candle rather than only at its bottom, place the stop above that candle's high, target liquidity below the short-term low, then the equilibrium or mean threshold of a body-to-body liquidity void, and exit at longer-term support. In the 30-minute example, the quoted short entry is 112.62, the candle high is 112.89, expected drawdown is about 20 pips, and the liquidity-void target is 111.48. ICT acknowledges that it is impossible to know whether earlier longs actually need mitigation, the transcript provides no verified trade record or independently inspected chart, and price eventually began moving back up.
How we researched this article
BestProps used document-based research from primary firm sources, checked September 24, 2026. The complete source list, scope, limitations, and commercial-state record appear near the end of this article.
The mitigation block is one of the order-block concepts ICT builds in this mentorship series. In ICT Mentorship Core Content: Month 04: Mitigation Blocks he opens by placing it as an amplification of order-block theory and naming the mitigation block as the specific subject 0:27, 0:30. Almost the whole lesson is spent on a bearish example: how he frames the context, what he waits for, which single candle he marks, where he would sell, where the stop goes and what he is aiming at.
Everything below comes from an automatic speech-recognition transcript of the full audio, and this review did not view the recording or its charts. The chart readings, price levels and reported outcomes described are reported as he narrates them rather than independently inspected. The lesson contains no order record for a real account, and nothing here should be read as evidence that the setup works or that the levels he quotes can be reproduced.
ICT Mitigation Block Market Context
He begins with a condition rather than a shape. What he is looking for, he says, is a marketplace that has given clear indications it wants to break down or move higher in a step-ladder formation, selling rallies or buying declines in a bullish market, and selling rallies in a bear market 0:36, 0:46, 0:54. In other words, the pattern is subordinate to the direction he has already decided the market is heading.
That is why he frames price action as resistance and support levels, or as what he calls anticipated bearish and bullish institutional reference points, and then says there has to be a context behind the viewpoint: is this a bullish scenario or a bearish one 1:05, 1:18. He states that the example in this lesson is the bearish one 1:26.
On the resistance side he deliberately refuses to narrow the category. A market moving up into a potential bearish resistance level, he says, could be moving into an old high, an old low, a bearish order block, or a breaker he says will be covered in more detail later, and he adds that there are multiple opportunities to frame the idea of resistance without going into great detail about which one it is 1:38, 1:44, 2:05. The operative instruction is to wait for price to indicate confirmation that there are willing sellers up there 2:15, 2:19, and if the market reprices and rallies one more time into that level, to monitor whether it has a willingness to break down 2:23, 2:29.
ICT Mitigation Block M Pattern and Structure Break
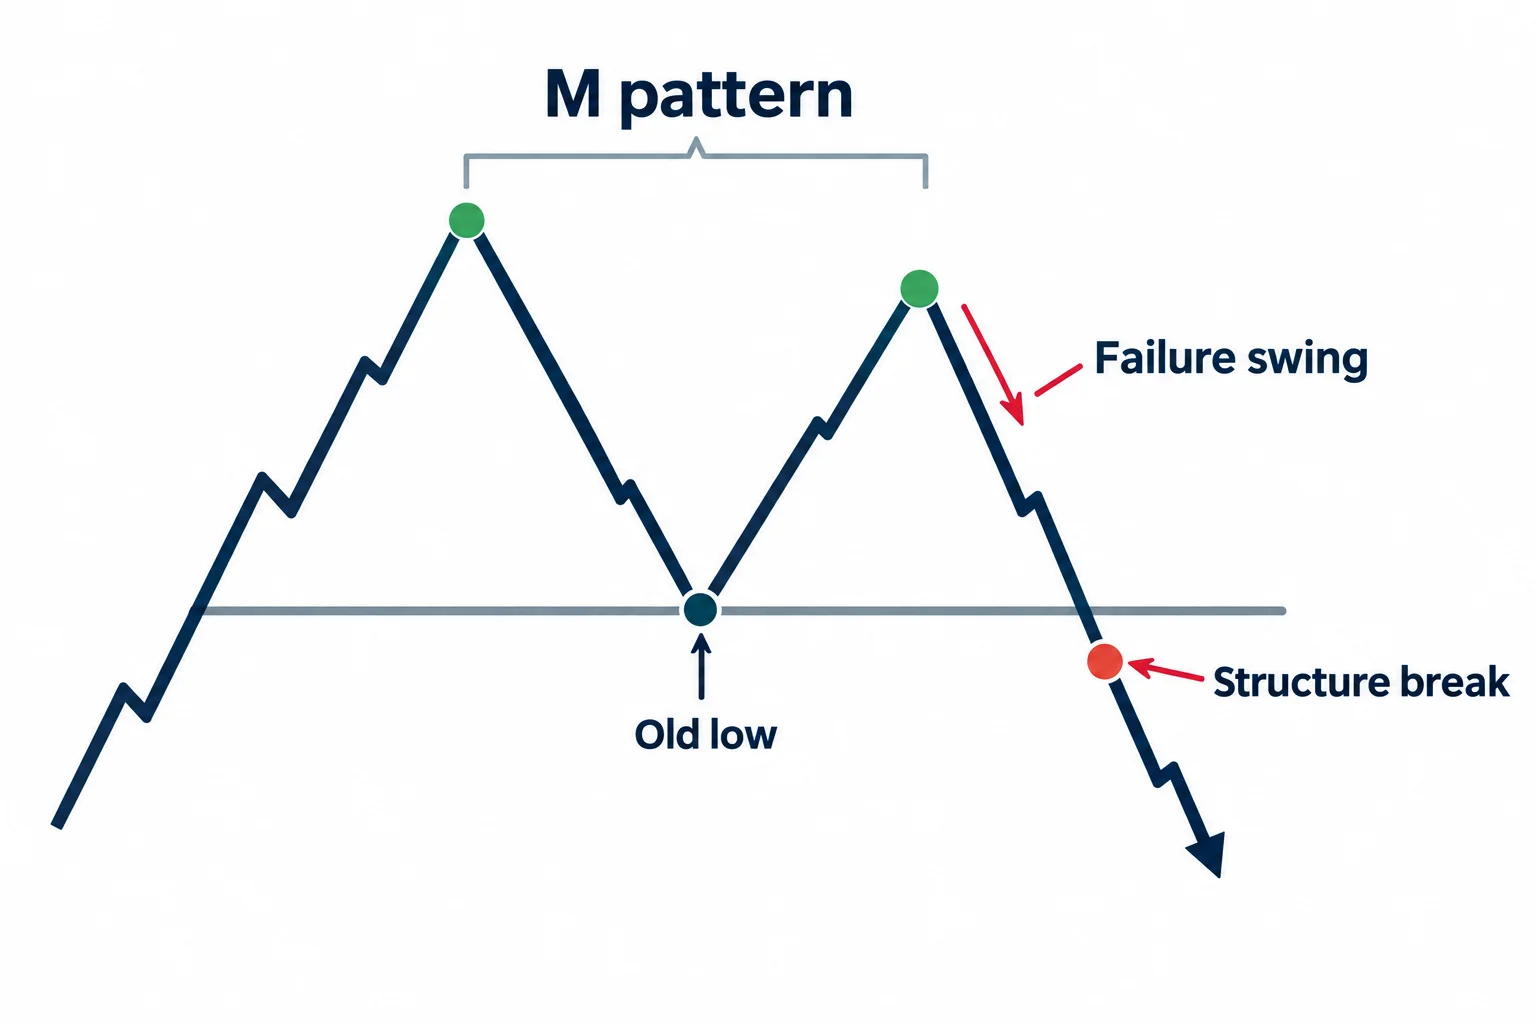
The pattern he points at is what he calls an M pattern, so named, he says, because it looks like a giant M 2:40, 2:44. His description of it is precise: it is a failure swing with a confirmation break in market structure, and the low inside it is the level used to frame that shift 2:51, 2:58. When the shift is seen as a break below that old low, he treats it as confirmation that the market has participants on a large scale willing to drive prices lower 3:05, 3:10.
He states why that confirmation matters to him. His words are that the smart money has to be willing to show its hand (to indicate whether it wants to send prices lower or higher) and that this pattern is the indication it wants to go lower 3:20, 3:27, 3:30. That is his reading of the chart, not an observation about identifiable participants; the transcript establishes only that he describes it this way.
ICT Mitigation Block Range and Key Candle
From the break he moves to the range between that short-term low and the short-term high 3:39. Inside that range there have been buyers, and the point he makes is that those buyers are now underwater 3:45. It is that short-term rally, he says, that highlights the specific institutional reference point he calls the mitigation block 3:53, 3:58.
Once price has posted the market-structure shift lower, his attention moves to that specific low, and inside it to the last down candle, because that is where the buying took place right before the short-term rally 4:11, 4:18. He notes that there is no rule about how long it takes before that low is violated, that he simply notes it, and that when it is broken it is seen as a short-term support level given away with a bearish context behind it 4:29, 4:38. He treats that as the evidence that smart-money entities are behind the marketplace driving price lower 4:49, 4:54.
He anticipates the objection that the move has already happened. At first glance, he says, it looks like a missed opportunity, but the response is to focus on that low, because the last down candle gives a bearish level to sell into 4:57, 5:01, 5:07. He describes drawing horizontal lines in at the respective lows and calling that a new mitigation block 11:04. That is the whole mechanism he is teaching at this point: not a signal, but a level selected from the candle where the losing side of the last rally entered.
ICT Mitigation Block Points A B and C
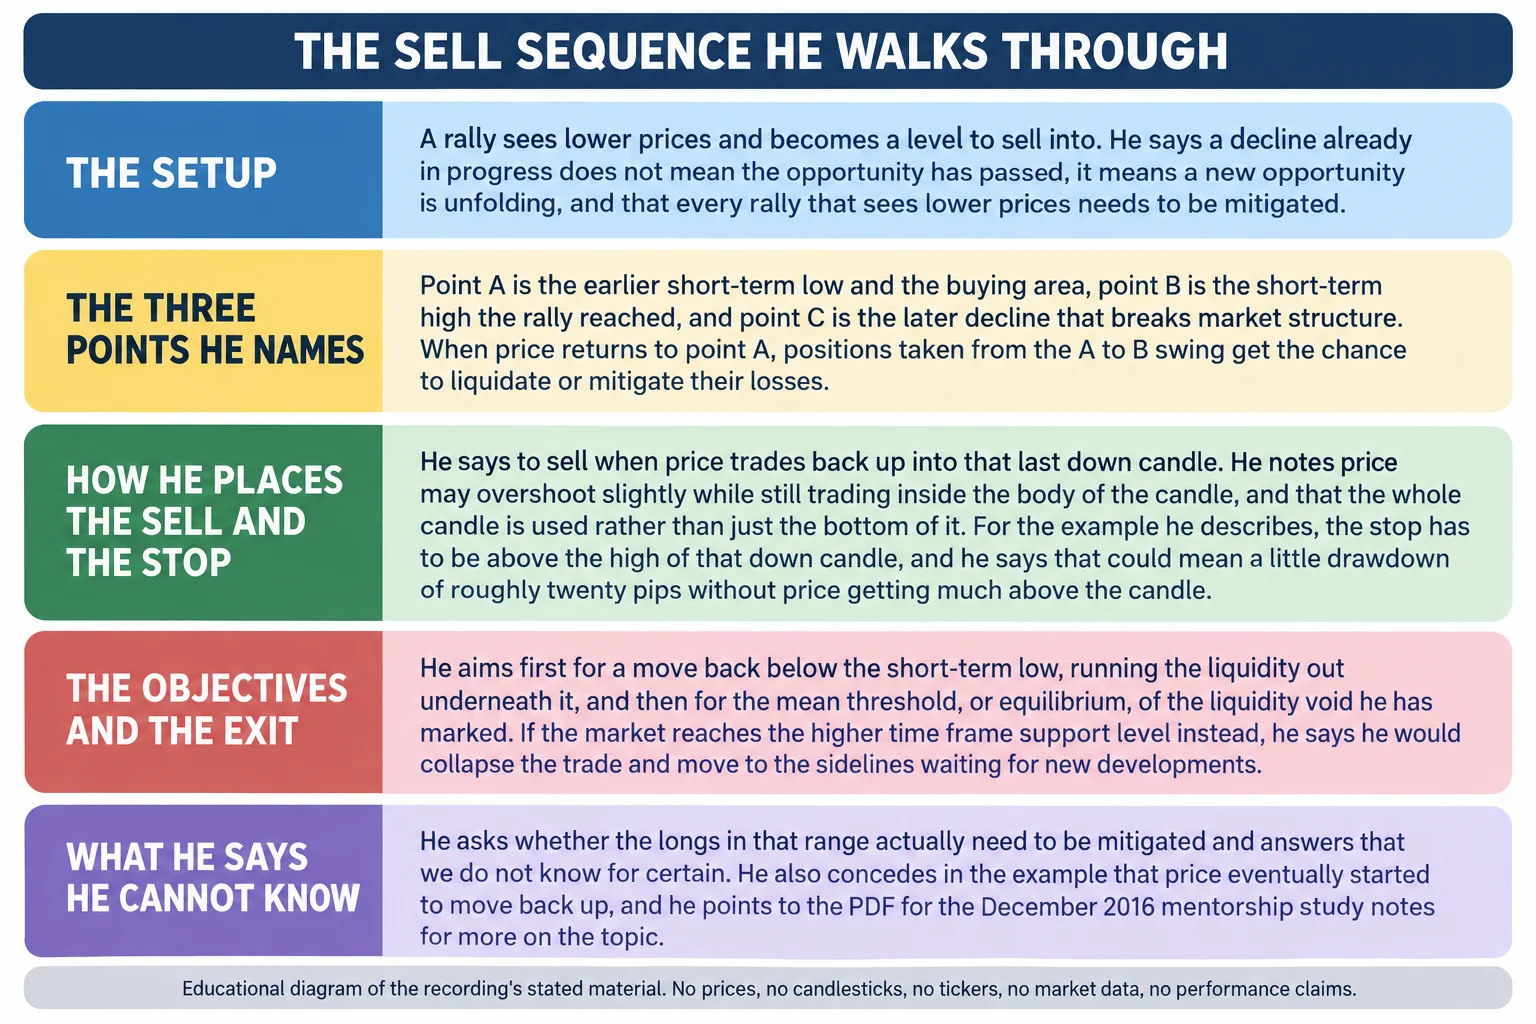
When price drives back up into that old short-term low, he says there are three reference points to be aware of, and he labels them A, B and C 5:14, 5:19. In his labelling, A is the short-term low, B is the short-term high and C is the market-structure shift seen on the way back down 5:26, 5:35.
The consequence he attaches to A is the core of the idea. When price returns to the A reference, the long positions taken from the A-to-B price swing have an opportunity to liquidate, or to mitigate, the losses they incurred during the move 5:45, 5:50, 5:56. He says this can result in new lower price swings to retest, or a significantly lower move into a support level under the market price, and sums it up as an opportunity to sell 5:56, 6:06.
He then deals with the question the whole model depends on. If the market breaks lower and that is what the chart shows, he says it does not mean the opportunity has been missed. It means a new opportunity is unfolding 6:22, 6:27, 6:30. He asks whether the longs in that short-term range actually need to be mitigated, and answers that we do not know for certain 6:38, 6:44. What he says makes the new selling opportunity valid is a belief that price will move lower longer term and that there is an unrealised lower support level, or sell-side liquidity, that has not yet been tapped 6:46, 6:50, 6:56.
ICT Mitigation Block Entry and Candle Range
He then repeats the process on a second structure break in the same example and asks the viewer where the focus is now 7:07, 7:20. The answer is the same: that low, and inside it the last down candle, because that is what he looks for price to reach back up into 7:32, 7:37. If price does that, he says, a trader can be a seller at that moment 7:44. He describes selling as price hits that last down candle inside the previous short-term low 7:50, 7:55, 8:03.
On the lower-time-frame walkthrough he adds the detail that matters for execution. Once price trades back up, he calls it a sell right there, and notes that price overshoots it by a little bit but breaks lower anyway 11:35, 11:41. Later in the same example he says price hits the level and overshoots slightly, but is inside the body of the candle, which, in his words, is what a mitigation block represents 12:36, 12:37. He then states the generalisation directly: the whole entire candle is used, not just the bottom of it, and a seller can act from that area rather than from one exact price 13:52, 13:57.
He gives the stop and the level he is quoting in the 30-minute example. He says a short seller could be at 112.62, and that the stop has to be somewhere above the down candle, with the high on that candle coming in at 112.89 13:57, 14:01, 14:04. He describes the consequence he expects from that placement: a little bit of drawdown, about 20 pips or so, without price ever getting much above the down candle 14:11, 14:16.
ICT Mitigation Block Targets and Exits
The downside objectives come in sequence. First he is looking to run the liquidity out below that short-term low, and he says every rally that sees lower prices needs to be mitigated, so if price trades back up to that low, that is a sell 8:08, 8:13, 11:52. From there he aims for a move back below the low and then down into what he calls the equilibrium, or mean threshold, of the liquidity void he has marked on the chart 12:01, 12:10. He describes that void as a body-to-body measure, or open and close, and highlights the halfway point as the reference 10:16, 10:25, 10:31.
In the example he gives the void’s level as 111.48 12:17. He walks through the sequence on the lower time frame: a short-term low is hit and price trades lower, price trades back up into the last down candle and hits it with a small overshoot inside the body, price then trades below that last down candle and makes another lower low, which he says allows him to adjust the level to that low 12:24, 12:32, 12:37, 12:45. After that he describes price selling off through the next low and ultimately trading down into the mean threshold of the liquidity void 12:55, 13:00.
He also states the other side of the trade management, on the support reference. Where price reaches a longer-term support level (which he says could be framed as an old high, an old low, a bullish order block or many other things), that is the objective he would be reaching for, and at that point he says he would collapse the trade and move to the sidelines to wait for new developments 8:26, 8:31, 8:36. This is his description of how he would manage the idea, not a report of a trade he took or of a result he achieved.
ICT Mitigation Block and Buyer's Remorse
He gives the pattern a familiar name and then explains it on his own terms. What is happening every time price moves back to an old low, he says, is the classic support-broken-turns-resistance behaviour, which he refers to as buyer’s remorse 9:00, 9:04. His account of it is that buyers at the previous short-term low saw a short-term pop in their favour, then watched the market break below the low they bought at, and are remorseful when price returns to that level, so they bail 9:08, 9:17.
He then puts that on an institutional footing. On that level, he says, smart money understands these short-term fluctuations and can drive price higher or lower on a short-term basis through manipulation 9:24, 9:30. If they are manipulating price short term by bringing in large orders and pushing market pricing around, his reasoning is that they will want to liquidate and will not want to incur losses, which is what gives them the opportunity to mitigate those losses 9:36, 9:41, 9:47. He closes the point with a rhetorical framing rather than a data claim: premium price highs are bought by less informed traders and sold by smart money, and he asks the viewer which group they intend to be grouped in 9:56, 10:01. The transcript does not independently establish who traded, why they traded, or whether institutions were responsible for any particular move, so that allocation is his interpretation.
What the ICT Mitigation Block Transcript Establishes
Stated directly on the recording: the definition as a condition of a market breaking down in step-ladder formations, the M pattern as a failure swing with a confirmation break in market structure, the selection of the last down candle inside the broken low, the A, B and C labelling, the mitigation logic for underwater longs, the use of the whole candle as the sell area, the stop above the down candle’s high, and the objectives at the short-term low and the mean threshold of the liquidity void. Also stated directly is his own uncertainty about whether the longs need to be mitigated at all, and the admission that in the example price eventually started to move back up 6:38, 14:51.
What the recording does not contain is any evidence about how often this resolves as described. There is no instrument, no date, no entry order, no fill report, no position size and no account result, and the only price figures in it (112.62, 112.89 and 111.48) are his narration of the levels he is pointing at on a chart this review did not see 13:57, 14:01, 12:17. The 20-pip drawdown figure is likewise his expectation in the example rather than a measured outcome 14:11. He says at the end that mitigation blocks will be discussed further in the PDF for the December 2016 mentorship study notes, which is a separate document and is not the source of anything written here 14:54, 14:59.
Watch the Original ICT Mitigation Block Recording
ICT Mentorship Core Content – Month 04 – Mitigation Blocks
The Inner Circle Trader · watch page lists upload 7 September 2022 · 906 seconds, about 15 minutes 6 seconds. The recording identifies itself as an amplification of order block theory and refers forward to the December 2016 mentorship study notes. This recording is the primary source for every timestamp link on this page.
The recording is not embedded here. An embedded player was tested directly on 15 September 2026 from a BestProps page origin at desktop and mobile widths: the frame loads but then reports “Playback on other websites has been disabled by the video owner”, with no duration and no playback progress, while the video itself is publicly playable on YouTube. No half-working player is left on this page.
The watch page was read on 15 September 2026 and is publicly listed as ICT Mentorship Core Content – Month 04 – Mitigation Blocks by The Inner Circle Trader, not private and not unlisted, with an upload timestamp of 7 September 2022 and a listed duration of 906 seconds, against a transcribed audio duration of 905.4 seconds.
ICT Mitigation Block Transcript Note
The transcript behind this article is an automatic speech-recognition pass over the full original audio of this recording, not human-verified captions and not a caption track. It covered the complete audio and reported no low-confidence stretches, but a machine transcript still mishears words, and two passages matter here. At 0:30 the audio yields “an amplification” of order block theory, which is read here as amplification in the sense of extending the same theory rather than as a separate term 0:27. At 11:14 the audio yields the name “Arcus” immediately before “sell off there”, which appears to be a misrecognition and is therefore not carried into this article; no name has been supplied in its place 11:14. The price figures 112.62, 112.89 and 111.48, the void’s level and the 20-pip drawdown expectation are all his spoken figures and are reported as such. Nothing in this article is taken from anywhere other than the spoken content of this recording, and this review did not view the recording’s charts: the chart readings and levels described are reported from his narration of them, not inspected independently.
ICT Mitigation Block Resources
These are the sources checked while preparing this article. The CFTC and Investor.gov pages are general regulator material about how trading-system and technical-analysis claims should be assessed; none of them evaluates this speaker, tests whether a mitigation block provides an edge, verifies the levels quoted in the recording or endorses anything said in it. Any ICT, smart-money or third-party indicator, script, note set, chart annotation, transcript pack or re-upload circulating outside the publishing channel’s own page is unofficial, has not been tested here, and no claims about its accuracy or repainting behaviour are made.
- [1] ICT Mentorship Core Content – Month 04 – Mitigation Blocks The Inner Circle Trader (primary source; watch page read 15 September 2026, listed duration 906 seconds).
- [2] The Inner Circle Trader (official YouTube channel) (read 15 September 2026), the publishing channel for the mentorship series used here.
- [3] CFTC: Fraud Advisory: Commodity