
Key takeaways
This recording identifies itself as teaching number five of eight in the December 2016 mentorship content and names its subject as reinforcing liquidity voids and when to anticipate ranges filling in 0:40.
Read the full summary
This recording identifies itself as teaching number five of eight in the December 2016 mentorship content and names its subject as reinforcing liquidity voids and when to anticipate ranges filling in 0:40. His definition is narrow and worth keeping exact: a liquidity void is a range in price delivery where one side of the market’s liquidity is shown in wide or long one-sided ranges or candles, and he says price typically wants to revisit that porous range of contrarian liquidity 0:58. He distinguishes it from the consolidation it left behind, which he calls a point of equilibrium, and he attributes the departure to participation he calls smart money, whose orders are too large to be filled at one price and therefore have to be worked in gradually 1:44. The qualification he repeats is the one most often missed: there is no specific time limit on the void closing, and he says one can stay open for months or be covered inside a brief intraday session, depending on what price is doing around it 2:15. He then walks a worked example through one-minute, five-minute and fifteen-minute views of the same bearish run, describing a run on the sell stops beneath short-term lows, the void being closed in as the range is balanced out, and finally a narrower “common gap” between candle bodies where he says he places a limit order 12:37. The lesson is delivered entirely from charts he narrates, without showing the viewer his screen in the audio: no fill, balance figure or verified outcome is established anywhere in the recording.
How we researched this article
BestProps used document-based research from primary firm sources, checked September 17, 2026. The complete source list, scope, limitations, and commercial-state record appear near the end of this article.
What This Recording Is
He opens by placing the recording in a series — teaching number five of eight for the December 2016 mentorship content — and states the aim as the reinforcing of liquidity voids and when to anticipate ranges filling in 0:40. That framing matters for how the rest of the lesson reads: it is a revision and extension of a concept introduced earlier rather than a first definition, and he treats the void as something already familiar to the audience.
His definition is the anchor for everything after it. A liquidity void, he says, is a range in price delivery where one side of the market’s liquidity is shown in wide or long one-sided ranges or candles, and price typically wants to revisit what he calls that porous range or void of contrarian liquidity 0:58. Two elements are doing the work in that sentence: the range has to be traversed predominantly on one side, and the delivery has to be wide or long rather than compact 1:05.
A sourcing note belongs here because it changes what can be claimed. The transcript used for this rewrite is automatic local speech-to-text of the recording’s own audio (Whisper large-v3-turbo), not human-verified captions. The download passed its integrity checks — the decoded audio is complete against the listed duration of 879 seconds, the audio runs to 878.4 seconds, and no segment was flagged low-confidence — but a misheard term or number cannot be ruled out, so every price level attributed below is reported as what he says on the recording rather than as an independently verified print.
Consolidation, Imbalance and Displacement
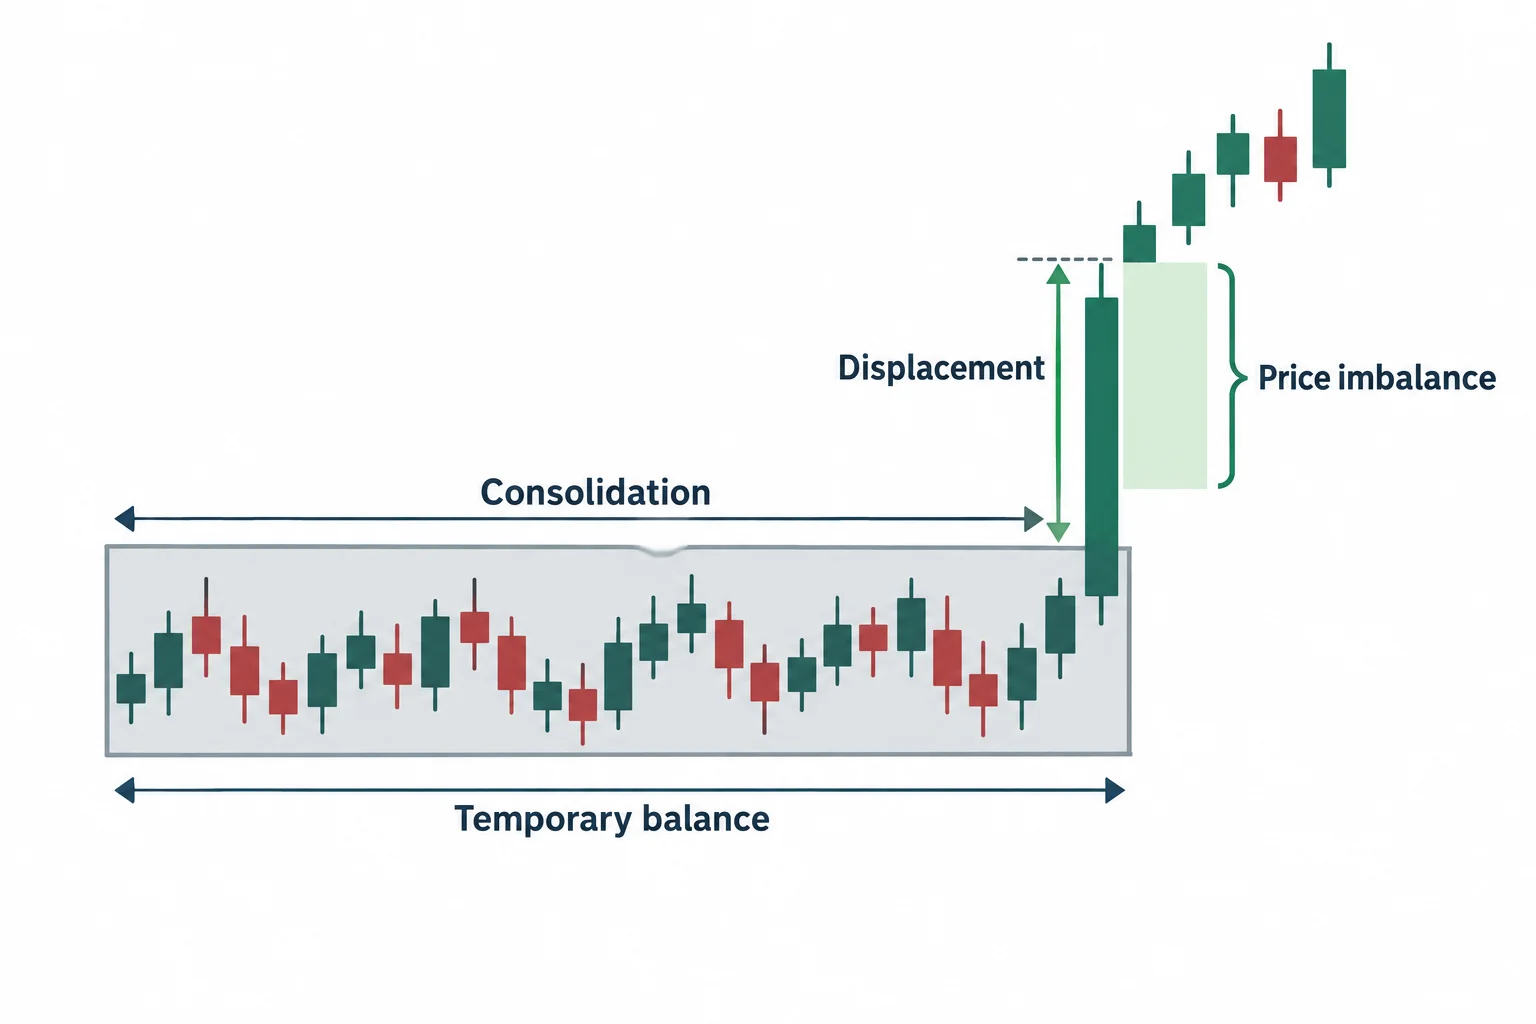
Before the example he sets up the state the void comes out of. When price is in a small consolidation or trading range, he calls that a price imbalance — in other words, price sitting at a point of equilibrium — and says that at some point price will move out of the consolidation 1:23. The two labels sit awkwardly together in the recording, since equilibrium and imbalance ordinarily mean opposite things, and he does not reconcile them in this lesson; what he appears to mean is that the compact range is a temporary balance that will be broken. When the break happens, he says, it shows participation in the form of smart money, and he gives a mechanism for it: smart money is the only participant with pockets deep enough to move price out of a consolidation, or to move it significantly at all 1:38.
The departure is what he calls displacement, or a price imbalance, and it is the displacement that creates the void 1:55. His explanation of why the void exists is a position-sizing argument: because those participants’ orders are larger than a retail trader’s, they cannot facilitate an entire net position at one price and have to scale in gradually, which may mean taking a slightly lower entry, or pushing price back above the consolidation and using the buy stops there as the liquidity to sell into 3:56. He explicitly sets that last part aside as a separate topic — it is not the point of this teaching 4:21 — which keeps the lesson focused on the void alone.
The naming logic is where he is most precise about direction. When a void breaks down the way the example does, he says it is saying there is a void of buy-side liquidity: the market moved aggressively away from the shaded consolidation, and because it repriced aggressively lower, the rundown was all sell-side liquidity, with very little buying taking place 4:28. The bearish term is therefore about the side that was absent from the move, not the side that dominated it, and he restates it twice to be sure the point lands 5:05.
There Is No Fixed Expiration
The most useful qualification in the recording is about timing, and he volunteers it before the examples. He says a range like this can stay open for a while and there is no specific time limit on how long it will take for these voids to close in 2:15. He names the question he is asked most often — how can you know how long it will take to fill in — and answers it with conditions rather than a schedule: it depends on what is being seen in the market at the time the void is identified, and the voids can stay open for months, or only for a brief intraday session 2:40. He then states the same idea in the inverse, saying the timing is entirely relative to the price action around the void 2:45.
That has a direct consequence for how the lesson should be read. A void alone is not a timing signal, and he does not present it as one: the void identifies a range worth watching, while the timing depends on the surrounding price action. He says as much in the definition itself by using “probably” and “a great deal of probability” rather than certainty about the revisit 4:47.
The Worked Example, Across Three Timeframes
The example begins on a one-minute chart because, as he explains, it gives him the chance to show how there are pockets inside these runs; he is careful to say the move is not big in pips but is a big move away from the consolidation in relative terms 3:20. He points at the shaded consolidation, then at the price moving aggressively away from it, and reads the departure as an indication that smart money is positioned and that price wants to go lower 3:42. The void itself, as he marks it, is a small area delivered only on the downside, with long-bodied candles and a small gap between the two biggest down candles 3:02.
Where the levels sit is where precision becomes difficult from audio alone. He identifies an area around 104.76 and 104.50 as the top of the range he expects price to trade back through, and says a move back up into 104.76 would cap or fill in the entire void formed by the two big candles 4:54. On the five-minute view of the same consolidation he says the whole departure now shows as a single large bearish five-minute candle, price having jumped down into roughly the 104.40 to 104.30 range before buyers reappear 5:52. These figures are his spoken readings off his own chart and a demo feed; they are reported here as his account, not as verified data, and the feed he names makes clear the levels are platform-specific 8:53.
His expectation for how the void closes is specific. He says that sometime in the future he expects a bullish candle or bullish swing to cover that entire range, and when it does, he says the price action has been balanced out — a complete and uniform delivery, offered on the down move and then covered on the way up 6:28. He then shows the sell stops below the lows being run and price running up, and says at that point you would reasonably expect the void to be completely closed in, while adding the caveat that sometimes it is and sometimes it is not: sometimes price comes right back down, runs liquidity again at the same equal lows, and then runs up and hits it 7:18.
He reads the close of the void together with the stops taken just before it. The final leg fills the void and closes right at the 104.76 level 7:34, and he points out that the stops were run below a low just before that, with a short-term low that price dropped beneath to reach the same 104.10 to 104.05 area 8:14. His interpretation is that the run on those sell stops is what was necessary to facilitate new longs, so that taking out the 104.76 level would be worth their while, picking up buy orders near 104.05 8:44 and then making a run of about 75 pips up to 104.76 to close the void 9:08. He also concedes that the price action offered several trades on both sides of the market, while saying the ultimate draw on price was to reach that level and close the void 7:41.
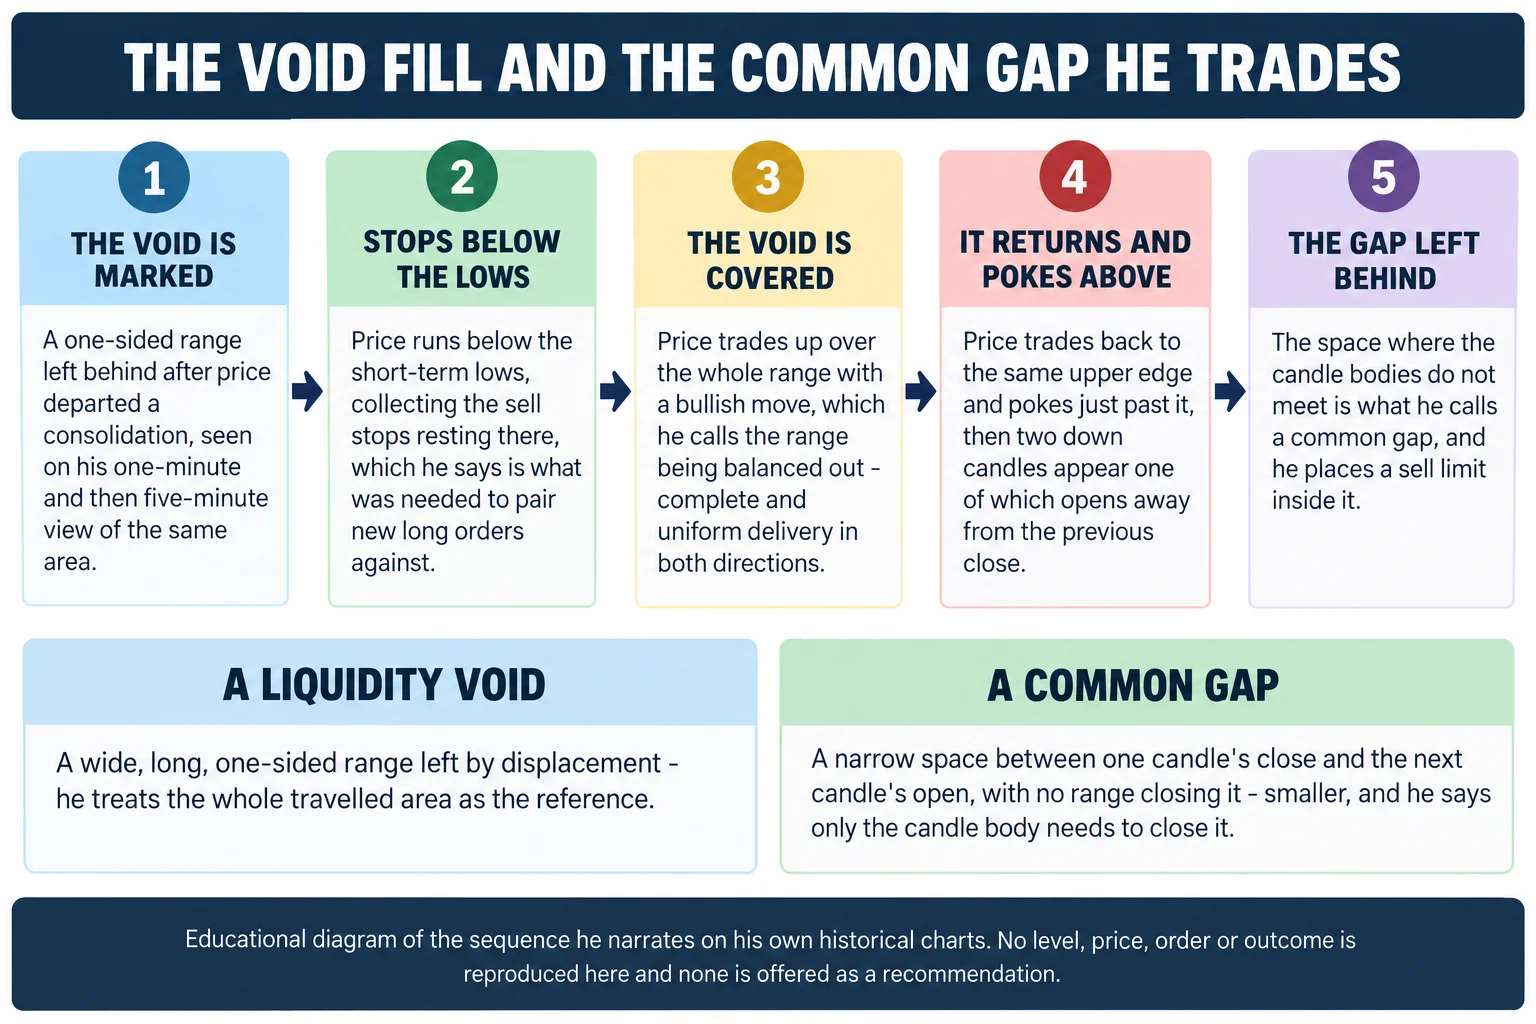
On the fifteen-minute view he presents the same story with more context, again showing a single large candle dropping away from the consolidation and marking the void, and locating the runs on the sell stops beneath those lows on the 15th and 16th of December 9:33. That is also where he introduces the detail the second half of the lesson turns on: price trades up into that upper edge twice, and the second time it pokes just a little higher than the first 9:58. The first visit he puts around 15:00 on 16 December and the second on 19 December 10:04. He then draws attention to the two candles immediately after the second run into that level: two down candles, one with a slightly longer wick, and the next opening away from the previous close to form a bearish candle 10:26.
The Distinct Range He Calls a Common Gap
The space where the candle bodies do not meet is what he asks the viewer to look at, and he names it plainly: it is a gap, a price gap 10:42. He builds the distinction from there. When price closes from one candle and opens into another candle with separation between the two that price does not close, it creates what he calls a common gap 12:37. In the same breath he separates it from the void: a liquidity void, as he defines it earlier, extends across a distinct range, whereas the common gap is the narrow unfilled space between two candle bodies.
He then turns the gap into a stated plan. With an inclination that price is going to move lower, and a gap sitting there, he says an order can be placed to sell with a limit order at 104.70, so that inside that price gap he can be a seller at that specific level 12:49. What he claims the reaction showed is worth separating from evidence of edge: he says once the gap closed in only the body closed it, that price wicked up into the body but the bodies of the up candle were all that was necessary, that there was very little drawdown, and that price immediately traded lower and repriced down below the equal lows formed on the 15th and 16th of December 13:13. This is his narration of his own historical chart, with no statement of position size, risk, or a verified account result attached to it.
He closes the example by extending it. On the fifteen-minute view he summarises that once the upper level had been hit, the gap had been closed at an entry of 104.70, which he calls an ideal use of a common gap 13:31. He then describes price making a run for the 104.04 sell stops, where a short position could be covered, with those sell stops used to pair up short-covering buys, before one more leg lower runs the stops at 103.65, again pairing sell-stop orders with buys to cover shorts 13:37. He finishes by saying everything shown reverses when the market is bullish, that examples of that are in the accompanying PDF, and that the supplementary teachings in the last week of December will add more because there is no trading during Christmas week 14:06.
What the Lesson Claims, and What It Does Not Establish
The claims about mechanism are the speaker’s interpretations, and the recording does not test them. He asserts that smart money is the only participant with pockets deep enough to move price out of a consolidation, and that their participation has to be scaled in because it is too large to fill at one price 1:44. That is a model of order flow, not a measured result: the audio contains no order book, no volume, no position data and no evidence about who was buying or selling in the example. The same applies to the reading that a run on the sell stops was what was “necessary” for new longs to be facilitated 8:37 — it is his explanation of why price moved, offered after the fact.
The specific levels in the example are also platform and period specific. He names the demo feed he was using and gives 104.05 as approximately where the feed showed the orders, and says the big figure depends on what data feed you are looking at 8:47. He describes the example across the 15th, 16th and 19th of December, which places it in his December 2016 material rather than in the recording’s own publication year 10:04 — the recording presents itself as December 2016 mentorship content and the upload date on the watch page is a separate matter. Nothing here should be lifted as a current price level or as a recommendation to place an order at a particular figure.
What survives as general method is narrower than the claims. The void is defined by one-sided, wide delivery away from a compact range; its refilling has no fixed deadline; the opposing delivery is what he calls the range being balanced; and the narrow space between candle bodies is treated as a separate, smaller feature with its own logic. He also says the whole thing reverses when the market is bullish, which is a symmetry claim rather than a second worked example in this recording 13:57.
Key Takeaway
The lesson as the recording states it, with his own limits kept attached:
- A liquidity void is a range in price delivery where one side of the market’s liquidity is shown in wide or long one-sided candles, and he says price typically wants to revisit it 0:58.
- The state before it is a compact consolidation, which he calls equilibrium or imbalance; the departure is what he calls displacement 1:23.
- A downward void is named for the liquidity that was absent — a void of buy-side liquidity — not for the selling that dominated it 4:28.
- There is no fixed fill time: he says a void can stay open for months or be covered in a brief intraday session, depending on the price action around it 2:40.
- He treats the range as balanced only when opposing delivery covers it, and he concedes it sometimes refills without any further liquidity run first 7:23.
- The narrower space between candle bodies is a common gap, which he keeps separate from the void and uses for a stated limit-order idea at 104.70 on his own chart 12:49.
Watch the Original Recording
ICT Mentorship Core Content – Month 04 – Liquidity Voids
The Inner Circle Trader · uploaded 9 September 2022 · listed as PT879S, about 14 minutes 39 seconds. This recording is the primary source for every timestamp link above.
The recording is not embedded here because the video owner has disabled playback on other websites. That was tested directly on 15 September 2026 from a BestProps page origin at both desktop and mobile widths: the embedded frame loads and then reports “Playback on other websites has been disabled by the video owner”, with no playable stream and no duration in either case. The link above opens the recording on YouTube itself.
The watch page was read on 15 September 2026 and is publicly listed as ICT Mentorship Core Content – Month 04 – Liquidity Voids by The Inner Circle Trader: uploaded 9 September 2022, not private and not unlisted, with the player reporting a duration of 879 seconds. The audio transcribed here runs to 878.4 seconds, which agrees with the listing to within a second. The recording presents itself as December 2016 mentorship material and refers to dates in December 2016 from within that framing, so the upload date and the period discussed are two different things.
Resources
These are the sources checked for this article. The regulator and investor-education pages are general material on how trading systems are assessed and what margin trading involves; neither one evaluates this speaker, and neither verifies the liquidity void concept or the example above. Any indicator, script, note set, transcript pack or re-upload circulating outside the publishing channel is unofficial and has not been tested here.
- [1] ICT Mentorship Core Content – Month 04 – Liquidity Voids — The Inner Circle Trader (the primary source, and the recording transcribed for this article; watch page read 15 September 2026, listed as PT879S).
- [2] The Inner Circle Trader — official YouTube channel (read 15 September 2026) — the publishing channel for this recording and the wider mentorship library it belongs to.
- [3] CFTC — Fraud Advisory: Commodity Trading Systems Sold on the Internet (read 15 September 2026) — the regulator’s guidance on assessing trading systems offered to the public, including its warning that hypothetical results are typically simulations calculated over past prices.
- [4] Investor.gov (SEC) — Margin (read 15 September 2026) — investor education on leveraged trading and the speed at which losses can accumulate, relevant background to a lesson built around entering inside a fast, one-sided move.
Source: ICT, ICT Mentorship Core Content – Month 04 – Liquidity Voids, The Inner Circle Trader, 9 September 2022. The transcript used here is automatic local speech-to-text of the recording’s full audio (Whisper large-v3-turbo), not human-verified captions; the decoded audio was complete against the listed duration and no segment was flagged low-confidence, but a misheard figure is still possible. The recording narrates its own charts and does not reproduce them here, so the price levels quoted — 104.76, 104.70, 104.40 to 104.30, 104.10 to 104.05, 104.04 and 103.65 — are reported exactly as what he says on the recording, on the demo feed he names, and are not independent market data. His readings of which stops were taken and why price moved are his interpretation of a historical chart, not verified order flow, and no fill, net resu