
Key takeaways
ICT’s December 2016 mentorship defines liquidity pools as inferred clusters of buyer and seller open interest around specific prices, especially buy stops above old highs and sell stops below old lows.
Read the full summary
ICT’s December 2016 mentorship defines liquidity pools as inferred clusters of buyer and seller open interest around specific prices, especially buy stops above old highs and sell stops below old lows. The directional framework is to sell at a premium above market when higher-timeframe bias is bearish and buy at a discount below market when bias is bullish, using a role-play exercise that asks where protective stops would sit for hypothetical short and long positions. A bullish setup waits for a sweep below an old low, where breakout shorts and stopped-out longs create sell-side liquidity, then targets buy-side liquidity above old highs, bearish order blocks, fair value gaps or liquidity voids. The bearish setup reverses those mechanics above an old high. On 15- or 30-minute forex charts, ICT suggests looking for a 10-to-20 pip sweep, using a 30-to-50 pip stop and treating movement roughly 25 pips beyond the low as evidence that the move may not be merely a stop run. Examples cover Kiwi, US dollar CAD, the dollar index, dollar Swiss franc and cable. In the US dollar CAD walkthrough, he cites a 130.90 buy entry, a 130.83 low, less than 7 pips of drawdown and a 133.60 objective. In the dollar-index example, possible entries are 102.85 or 102.80 against a 102.69 low before targeting stops above equal highs. The method requires a higher-timeframe directional bias and patience rather than an indicator, order book or depth-of-market ladder, and the recording provides no verified fills, account results or testing across instruments and conditions.
How we researched this article
BestProps used document-based research from primary firm sources, checked September 24, 2026. The complete source list, scope, limitations, and commercial-state record appear near the end of this article.
ICT Liquidity Pool Meaning
He opens by framing the lesson as a reinforcement of liquidity pools and when to anticipate them, and says it comes from the mentorship content for December (0:40, 0:44). His definition of liquidity is the open interest of buyers and sellers in the market, further defined by those entities sitting at or near specific price levels (0:50, 0:55).
He then describes the graphic he is working from: a grey area representing the current price for whatever asset class is being studied, and the assumption that there will always be participation from both buyers and sellers at that price (1:03, 1:17). He is explicit that the reason for that interest is not knowable, and that he is not concerned with what other traders are trying to do, only with where their interest is likely to reside (1:23, 1:36). That distinction matters for reading the lesson: the pools are an inference about where orders probably sit, not a readout of an order book.
His description of the two sides is worth quoting in substance because the roles are assigned:
- New pending orders above the market in the form of buy stops, with the further comment that more refined or “smart money” traders will be selling above the market price (1:42, 1:49).
- Below the market price, typically sellers, and he says it is usually the smart money that wants to buy below market price (1:56, 2:05).
- At market price, he places the retail trader, whom he describes as so reactive to price that they are usually buying and selling right at the market (2:12).
That three-way split is his characterisation of who trades where, and it is the premise the rest of the lesson rests on rather than something the recording demonstrates. He states his own preference plainly: he wants to sell to the buyers above him and buy from the sellers below him, so that he is always selling at a premium and buying at a discount (2:20, 2:35). He adds that this is directly opposed to what retail is typically taught, which he says is to buy on a breakout or on a continuation pattern such as a bull flag or a wedge, and that what he requires instead is a pullback into a level of discount, something he says takes discipline and patience that most traders lack (2:51, 2:56, 3:02, 3:10).
ICT Liquidity Pools Around Old Highs and Lows
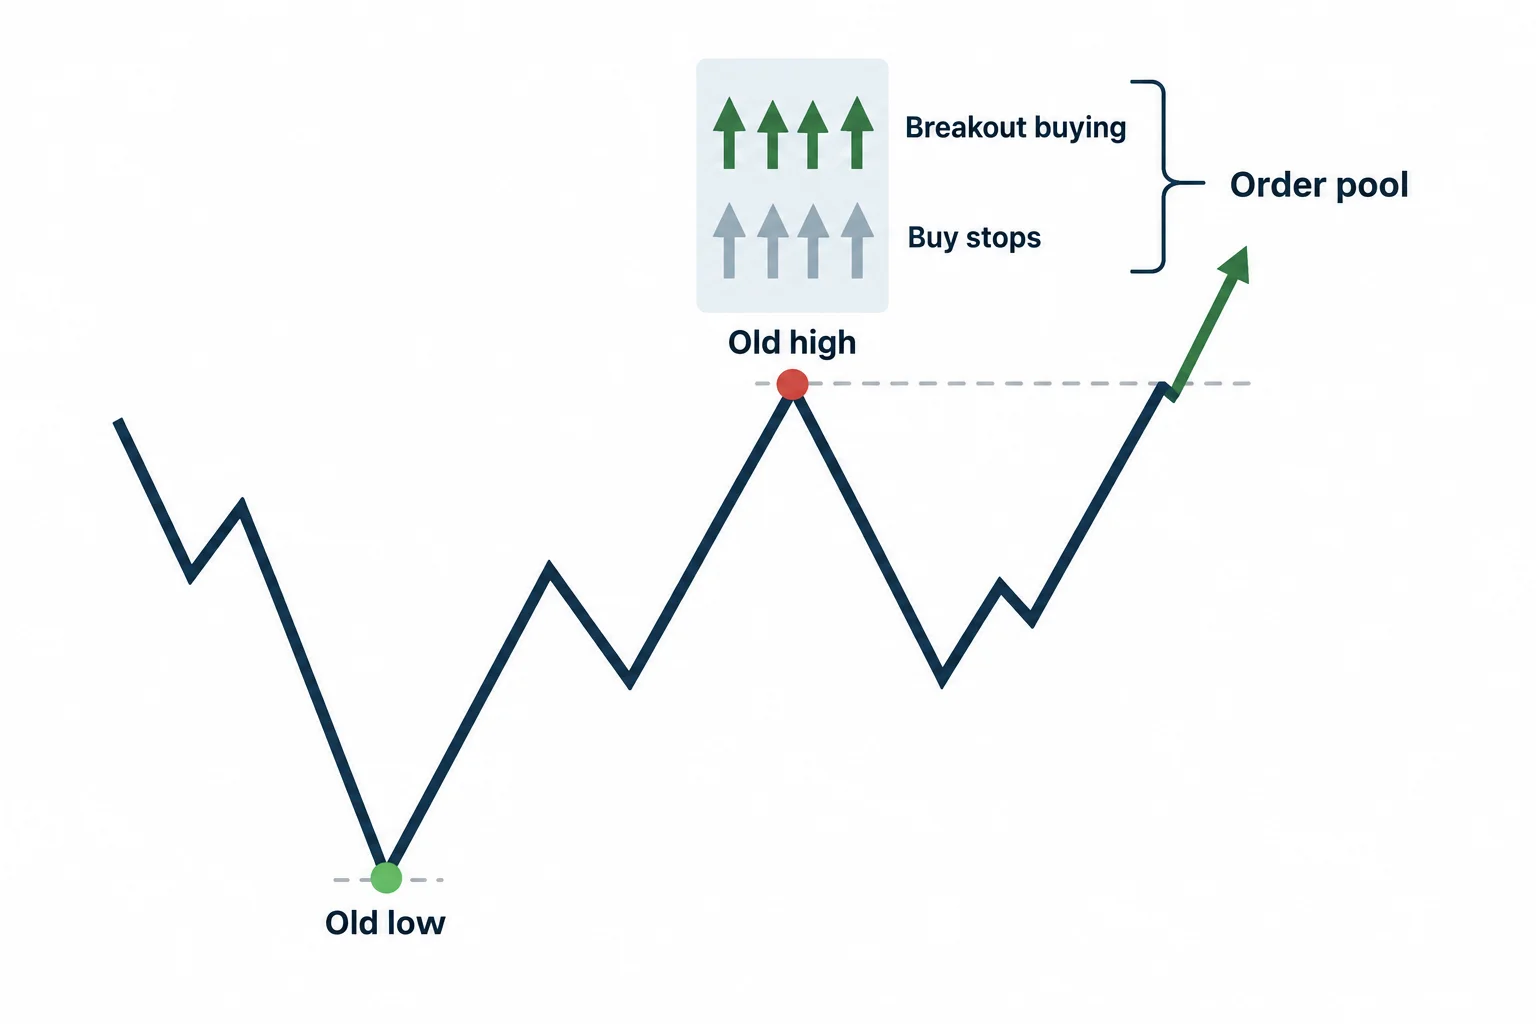
He builds the liquidity-pool idea on old highs and old lows. His bearish case: if the undertones of the market suggest the dollar is bearish, what he is willing to do is sell above old highs, because buyers who see a move above an old high will read it as a bullish breakout and be willing to buy there (3:29, 3:35, 3:44). He also points out that traders already short would have a protective buy stop resting above that old high, so selling there puts his order into the same area as both new breakout buying and protective short stops (4:03, 4:08, 4:13).
The word he uses for that area is a pool or a collection of orders that traders build up around (4:20, 4:29). He estimates that 90% of retail traders are not even aware that other traders are doing this, and describes them as thinking myopically about themselves, an assertion about other people's awareness, not a measured statistic (4:35).
This is where he gives the exercise that the lesson turns on. He describes going to the charts and role playing: if I were short right now, where would my protective buy stop be, and if I were long right now, where would my protective sell stop be (4:44, 4:51, 4:55). He says doing that gives a good read on where other traders would have their stop-loss orders above and below the market (5:00).
He then runs a hypothetical he takes care to label as hypothetical: suppose the asset is the dollar index and the read is bearish, with the explicit caveat that he is not stating that is the case now, only for example purposes (5:09, 5:16). In that case he would wait for a rally above an old high and look to go short, expecting the move above the old high to be a false breakout and price to then seek a lower reference, another old low it could run below, a bullish order block, or a fair value gap to close into (5:25, 5:34, 5:44).
The bullish mirror is stated the same way: if the dollar were bullish, he would look below the market price, where sellers on a breakout expecting a move lower would offer liquidity, and he wants to be a buyer at a discount, pairing his buy orders with those willing participants (5:53, 5:58, 6:11, 6:17). He notes those sellers are either selling on a breakout stop or protecting a long position with a sell stop (6:23, 6:29). So a trade below an old low becomes an opportunity to buy the sell-side liquidity and establish a long, waiting for a repricing above an old high, a bearish order block, a fair value gap or a liquidity void to take profit into (6:35, 6:42, 6:49).
He connects this to what he calls a market efficiency paradigm, and makes a claim worth separating from fact: that you do not need an order book, a depth-of-market ladder or anything similar, because you can see where orders would be residing through common sense and visual reference to old highs and old lows (7:03, 7:08, 7:20). Read as a statement about what the method needs, that is simply part of the framework. Read as a claim that the inference is equivalent to order-book data, it is not established anywhere in the recording.
He is also clear about where the difficulty sits. He says the trick is knowing the underlying pinnings of the market (whether it is predisposed to go higher or lower) and that the higher-timeframe work is what leads to a bullish or bearish read on the asset class (7:28, 7:33). Once that is done, he says it should not be hard to sit and wait, while conceding that it will be hard initially because of the impulse to do something immediately (7:46, 7:50). That caveat is his own, and it matters: the level alone is not the setup in his telling.
How ICT Liquidity Pools Work
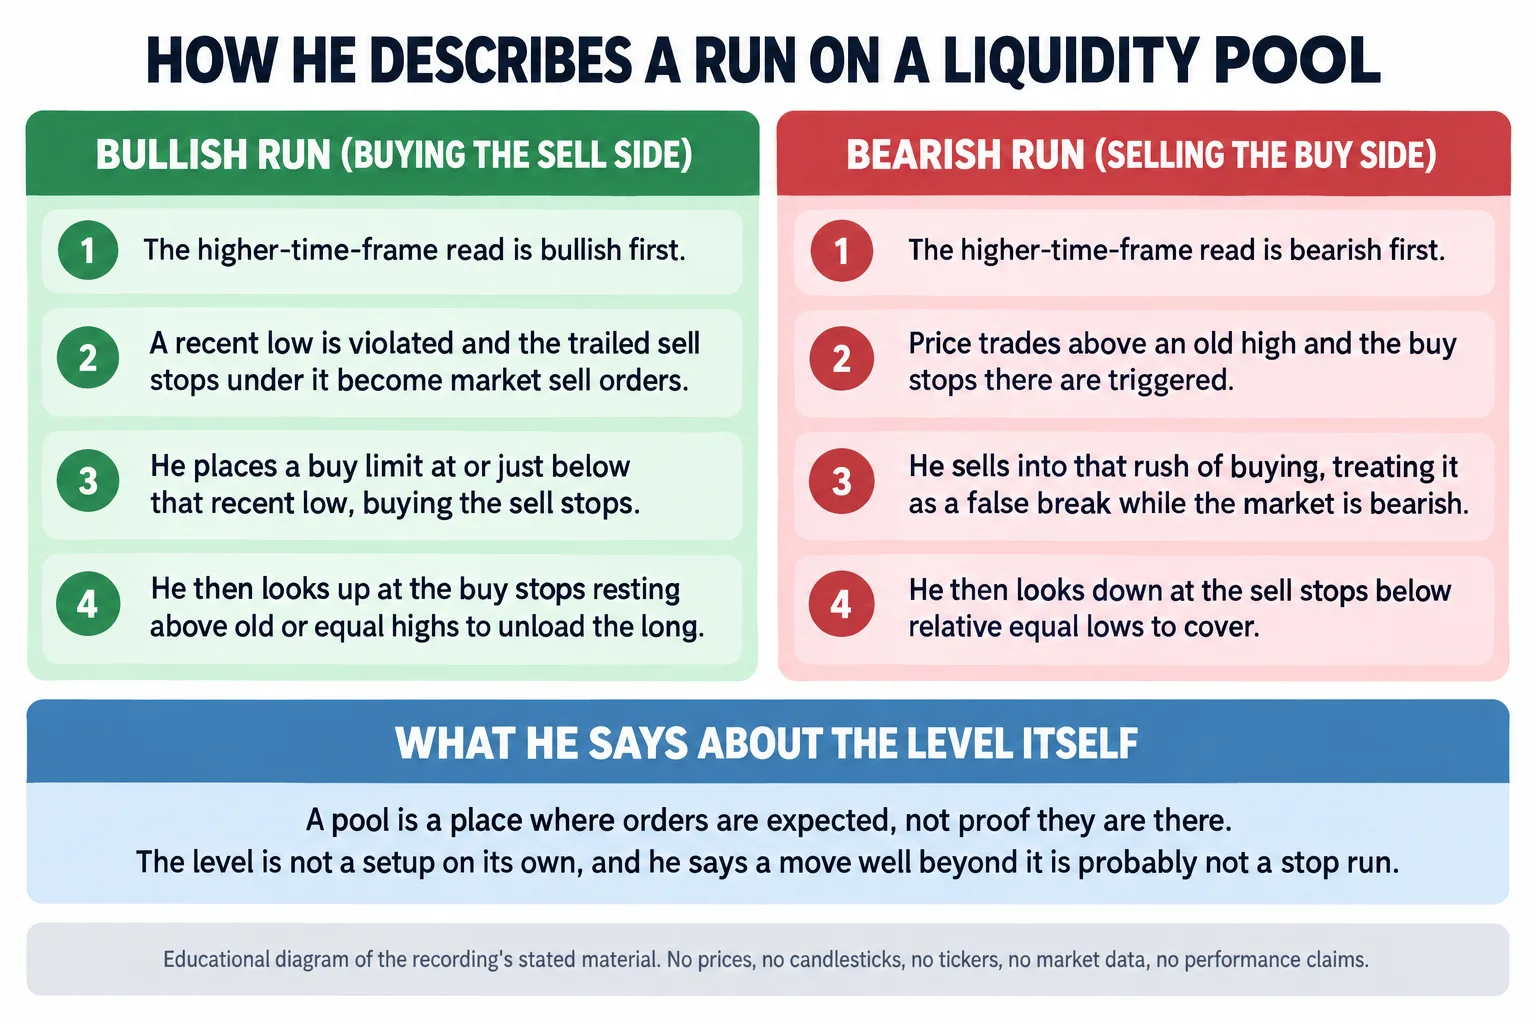
He describes the mechanism as an injection of orders. When the market is predisposed to go higher, he waits for price to drop below an old low, which he says knocks out weak longs or bullish traders trailing their stops too tightly, and sweeps up the accumulation of sell stops below the market (7:54, 8:01, 8:07). His description of the effect is that knocking out those sell stops injects willing sellers into the market, which he says engineers liquidity, and that he then looks to accumulate that rush of selling interest quickly before looking for a move higher (8:20, 8:27, 8:36). The bearish version reverses it: he waits for the market to trade above an old high, where the buy-side liquidity is injected as a rush of buy orders at the market, and sells into that rush expecting the break above the old high to be false while the market is bearish underneath (8:38, 8:43, 8:47, 8:49). He calls that a sell short in the form of a run on liquidity or a liquidity pool (8:58).
On the graphic that follows, he defines the bullish version of that run: the low under the current market price will typically have a trailed sell stop under it for long traders, and sell stops from traders wanting to be short on a breakout lower also reside below old lows (9:06, 9:16, 9:23). Validation, in his words, is when the low is violated or price moves below the recent low and those sell stops become market orders to sell, which injects sell-side liquidity and, he says, is typically paired with smart-money buyers (9:34, 9:38, 9:43).
ICT Liquidity Pool Pip Ranges and Limits
This lesson does give concrete numbers, which is unusual and worth handling carefully. For entry technique in a bullish market, he says that before price trades under the recent low you would place a buy limit order just below or at the recent low, buying the sell stops the way a bank trader or another large entity would (9:51, 9:57, 10:02). Then he flags risk definition as the part that requires work, and says the detail would be taught over the following months because some of what it depends on had not been taught yet (10:10, 10:21).
For exercise purposes and for reviewing past examples in hindsight, he offers a lower-timeframe expectation on a 15- or 30-minute chart: a 10-to-20 pip sweep below the old low, and a 30-to-50 pip stop if the entry is under the low rather than above it (10:28, 10:41, 10:50). His reasoning about getting ahead of the move is psychological rather than statistical: he says buying at or above the low is probably fear of missing the entry, and that waiting for the market to trade 10 or 20 pips under the low gives a better entry for the same stop (10:59, 11:07).
He also gives himself an invalidation rule: if price starts moving beyond roughly 25 pips below the low, he treats that as a fair assessment that it is probably not just a stop run and that a much further decline may be underway (11:29, 11:33). These figures are teaching parameters from this lesson on lower-timeframe forex charts. They are not universal rules, and nothing in the recording tests them across instruments, volatility regimes, spreads or conditions.
ICT Liquidity Pools in the Kiwi Example
Asked when to anticipate these stop runs, he walks the first worked example, which he identifies as a Kiwi dollar trade: an old low with a liquidity pool resting below it, price trading below that old low and accumulating the sell stops (11:41, 11:45, 11:53, 11:57). He then describes the other half: while that happens he says smart money looks to offset those new longs above old highs, and he points to equal highs on the left he had highlighted and drawn out to the right, with profit taken when the buy stops there are run (12:02, 12:09, 12:16, 12:19).
He summarises the whole construct as offsetting one pool against the other (accumulating the sell side for longs and distributing those longs into the buy side) and says that is the same role as a market maker and liquidity provider, which he calls the market efficiency paradigm put into mechanics (12:27, 12:33, 12:39, 12:46).
Four ICT Liquidity Pool Examples
One caveat before the examples. The transcription renders the price levels in these walkthroughs inconsistently (sometimes with a decimal, sometimes as a bare digit string), so the figures below are given as the transcript produced them, and where a level appears in two forms both are noted instead of one being silently chosen. The charts themselves were not available to this review.
US Dollar CAD Liquidity Pool
He works from a daily chart, telling the viewer to look at the bodies of the candles and to look for a sweep below those lows, since sell stops sit beneath them (12:59, 13:04, 13:15). He uses the previous day’s candle low, which the transcript gives as $1,3102, and transposes that level onto a 15-minute timeframe, where it appears as $3,102 (13:20, 13:34). He notes an interest-rate announcement on that day and a second, lower low forming intraday, so his stated level to watch becomes a run below 130.95: if price moves down to 130.85 or 130.75, he says he could be a buyer, and he picks 130.90 as an entry (13:41, 13:49, 14:00, 14:07, 14:15).
He then narrates the sequence: the candle low comes in at 130.83, so the limit order at 130.90 would have been filled, which he calls a drawdown of not even 7 pips, and price immediately showed a willingness to rally (14:26, 14:41, 14:46, 15:02). The upside objective he names is the swing high above, where he says a contrary liquidity pool of buy stops would be resting, and the level he gives to unload is 133.60, which he says price reached (15:15, 15:23, 15:32). He notes price still went a little higher afterwards and calls the example a low-risk entry with a large move, which is his characterisation of the chart rather than a verified result (15:54, 16:01, 16:18).
Dollar Index Liquidity Pool
He describes a bullish dollar move, says he probably cooled his jets for the week going into Friday, and frames the chart as Thursday’s trading with Friday’s setup (16:26, 16:32). Price creates an intraday low, and he notes buy stops above the high there and above a short-term high as well (16:38, 16:45). His entry could have been 102.85 or 102.80, and he says the low came in at 102.69, so there would have been an easy fill once spread is considered; below that low he would be long, looking to unload into the buy stops above the equal highs (16:56, 17:07, 17:14, 17:19). He then narrates a rally with a small retracement he concedes could have been scary, price tapping a high and falling just short before exploding up through it and taking the buy stops, then another small trade and another run above (17:31, 17:39, 17:53).
He says this had been discussed in the session before it happened, running up and taking those buy stops and then seeking the sell stops below relative equal lows, and explains that because the market was trending into Friday he expected the market to take something off the table and turn choppy sideways, so he was not expecting a new high but was looking for a run on the buy stops and a run out of the sell stops (17:53, 18:04, 18:11, 18:18). That prior-session claim is his recollection of a call; this article cannot verify it beyond his own statement that the call preceded the move.
Dollar Swiss Franc Liquidity Pool
He installs a horizontal line at a low, says he could be a buyer at that low or just below it and would look for a run below it to buy, and says he would pair orders above two named highs (18:31, 18:35, 18:48). The layered buy-stop areas he names for taking profit are transcribed as 10145, 10130 and then 10125, and later in the same walkthrough as the 101.25s, the 101.30s and the 101.45s, the same three levels in two transcript renderings, noted here rather than reconciled (18:56, 19:33, 19:47). He narrates the move down into the identified level, the sweep below it, price rallying away, surging up above the 101.25s, the reaction after it hits that level, and then the stronger move clearing the 101.30s and 101.45s before continuing (19:17, 19:38, 20:06).
Cable Liquidity Pool
The last example is cable, which he says was also discussed live in the Friday session: his stated expectation was a sweep below a level once more, a push below the opening price, and a sweep of the sell stops under a short-term low, followed by price moving up into the level he gave as 125 to 125.20 relative to the hourly chart (20:13, 20:21, 20:25, 20:30). He then narrates price sweeping down below it, running the pool out, the stops being gone, and the offset being sought above a level the transcript renders as 2475, and says price ran up and hit that level, referring viewers to the live session recording for December 16, 2016 for that part (20:38, 20:42, 20:47, 20:56, 21:03).
How to Find ICT Liquidity Pools
Reduced to a repeatable procedure, the sequence he describes is:
- Do the higher-timeframe work first and decide whether the market is predisposed to go higher or lower. He says everything else depends on that read.
- Mark the old highs and old lows that stand out, and role play where a protective stop would sit for a short and for a long.
- Decide which pool you are willing to trade against, given that higher-timeframe read.
- Wait for price to trade through that level rather than buying the approach.
- Name the opposite-side pool you intend to unload into before the entry, as he does in each example.
- Define the distance beyond the level at which the idea is wrong for you, which he demonstrates with his own 25-pip comment.
Read that way, the lesson is a chart-mapping and patience discipline rather than a signal. The level is where he expects orders; the higher-timeframe read is what decides which side he is willing to act on.
What ICT Liquidity Pools Do Not Prove
Four limits belong with this material. First, no order-book or depth-of-market data appears anywhere: he says explicitly that you do not need it, which means the pools are an inference from old highs and lows rather than a measurement of resting orders. Second, every example is a chart reviewed after the move, presented for hindsight study; he says so himself when he calls the pip figures exercise parameters. Third, there is no account information of any kind (no entry or exit records, no position sizes beyond the illustrative limit prices, no risk parameters and no profit or loss figures), so the examples are not verified outcomes and the returns implied by phrases like “big payout” are not substantiated anywhere in the recording. Fourth, the attribution of behaviour to market makers, banks or smart money is his interpretation of who is on the other side, and the recording offers no evidence about counterparty identity.
The chart readings above are reported from his spoken narration of the charts. This review heard the audio and read the transcript; it did not independently verify the bars, the levels, the fills, the spreads or what price did outside the windows shown.
Watch the Original ICT Liquidity Pool Lesson
ICT Mentorship Core Content – Month 04 – Liquidity Pools
The Inner Circle Trader · watch page lists upload 9 September 2022 · 1,338 seconds, about 22 minutes 18 seconds. The speaker opens the recording as part