
Key takeaways
This is Month 04 of the Core Content mentorship, on interest rate effects on currency trades, and it opens with his claim that interest rates are 0:42 the single most influential driving force behind market moves.
Read the full summary
This is Month 04 of the Core Content mentorship, on interest rate effects on currency trades, and it opens with his claim that interest rates are 0:42 the single most influential driving force behind market moves. The tool is what he calls an interest rate triad – the 30-year Treasury bond futures, the 10-year note and the 5-year note, compared against one another rather than read in isolation (1:22, 1:31, 1:37). In his frame all three should confirm each important higher high or lower low; when two make the new extreme and the third fails to follow he calls that a failure swing and reads it as a shift in the interest-rate complex (7:20, 7:50, 8:32). He is explicit that it is not an entry signal: the trader starts with a predetermined read on the market being traded and waits for price to reach a focus point – an order block, a liquidity pool, a liquidity void or a fair value gap – before checking the triad against the U.S. Dollar Index (13:16, 18:49); if the rate markets and the index do not line up, he says to pass on the idea (19:02). In the worked example from the week of the recording he reports a failed higher high in the 30-year, a middle maturity he describes as flat to neutral, and a higher high in the 5-year (11:17, 12:02, 12:17), and reads that as confirming a bullish dollar view and bearish scenarios for the euro and cable. No fills, account results or chart levels can be established from the transcript.
How we researched this article
BestProps used document-based research from primary firm sources, checked September 24, 2026. The complete source list, scope, limitations, and commercial-state record appear near the end of this article.
In ICT Mentorship Core Content – Month 04 – Interest Rate Effects On Currency Trades, he presents a comparative framework that links U.S. Treasury futures, the U.S. Dollar Index and foreign-currency setups. His stated premise is that understanding interest rate shifts and changes can assist in selecting trades (0:50), and that comparing the three maturities gives a visual depiction of what he calls smart money accumulation and distribution (1:10).
The lesson does not offer the rate comparison as a signal to trade on its own. He builds it as a confirmation step inside a process that starts with an expectation about the market being traded and a price area chosen in advance. Because the source is an automated transcript of the audio and the charts are not reproduced on this page, every chart reading below is reported from his narration rather than inspected independently.
What he calls the interest rate triad
At 1:19 he defines the triad as three interest rate futures markets, traded on the futures exchanges (1:40):
- The 30-year Treasury bond, which he calls the key long-term interest rate benchmark (1:22)
- The 10-year note, which he calls the intermediate-term interest rate (1:31)
- The 5-year note, which he calls the short-term interest rate (1:37)
His claim is that reading their price action in relation to one another unlocks a great deal of what normally evades a trader hunting price action setups (1:53), and that failure swings at opportunistic times can validate institutional order flow (2:10). These are futures prices, not plots of yields; he states the inverse relationship himself later in the recording, saying that as these charts trend higher the interest rates are actually declining (19:59).
The accumulation and distribution model behind it
Before applying the triad to currencies he asks 2:44 and sets out a comparison model. In bearish conditions, a base asset or benchmark makes higher highs (3:04) while closely correlated instruments make lower highs, which he reads as distribution (3:24). He names the benchmark by market: the Dow Jones Industrial for stocks, the Dollar Index for currencies and the CRB Index for commodities (3:12). In bullish conditions the mirror image applies: the benchmark makes lower lows while related markets hold higher lows, which he calls accumulation (4:32).
His explanation is a supply-and-demand argument – if the position is being accumulated the price is not allowed to discount – and he attributes the pattern to institutional activity. That attribution is his interpretation; the recording offers no independent test of it. He then restates the triad (6:35) and says that overlaying the three markets is how accumulation and distribution can be highlighted inside the interest-rate market itself (6:56).
The failure swing he is looking for
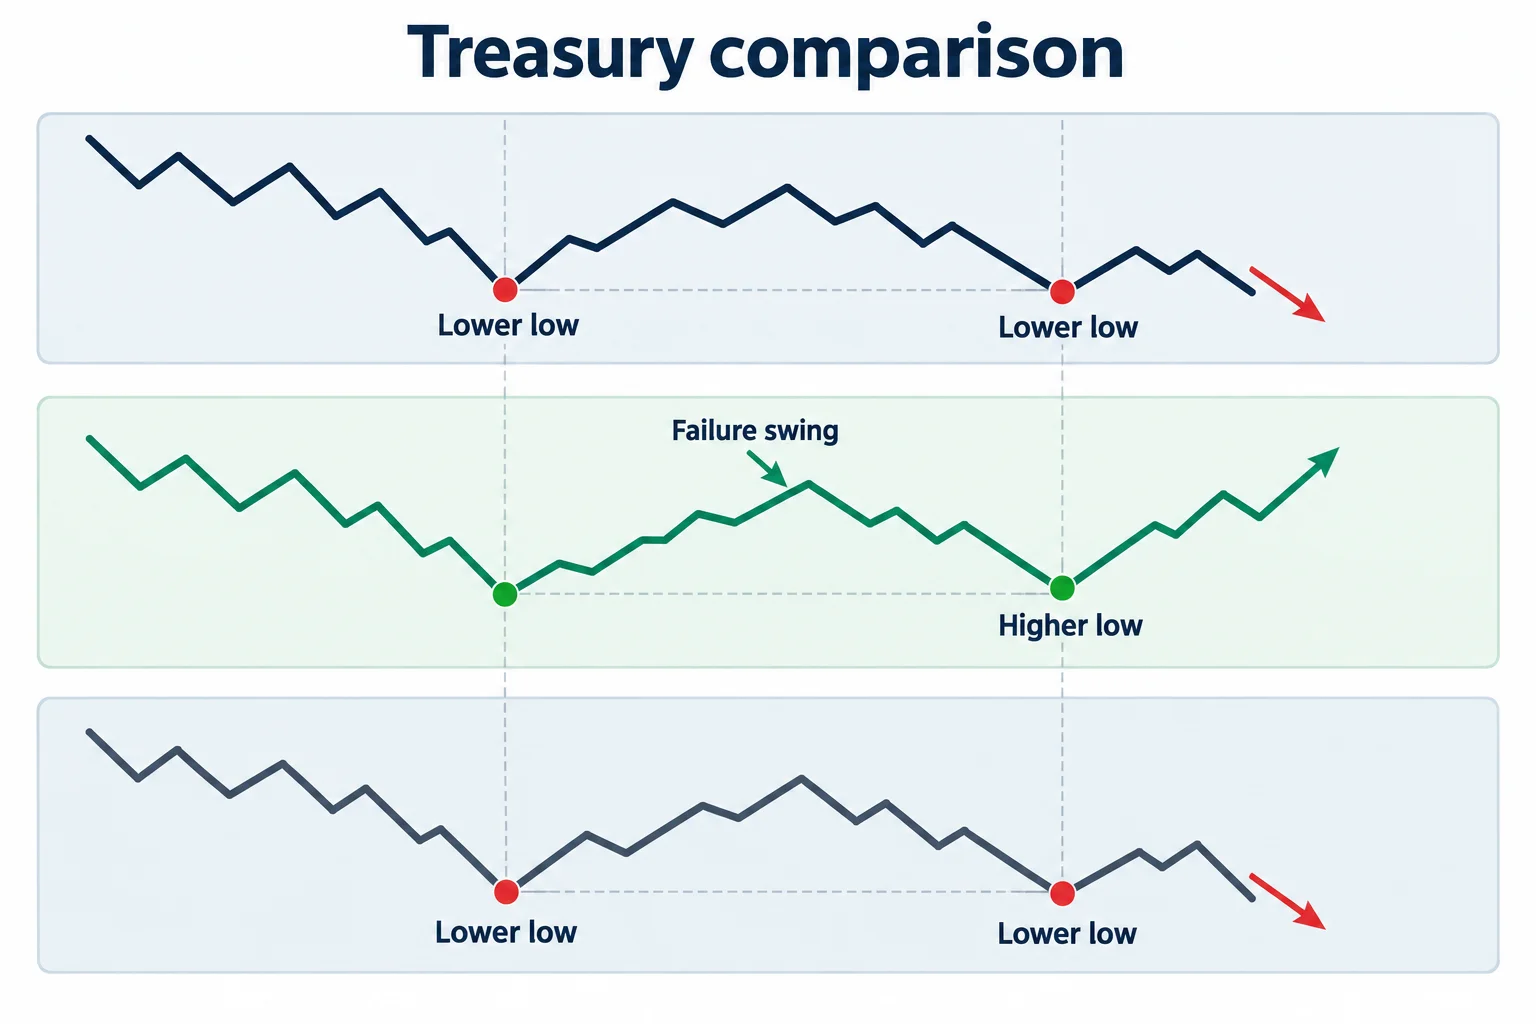
The operating rule comes at 7:20: the three Treasury markets should confirm every higher high or lower low at moments when the Dollar Index is at a significant price point. Failure swings, in his words, highlight smart money participation and validate trading opportunities (7:34). It does not take all three to break; he says you only need one of them to fail to follow the pattern (7:50).
He walks through a graphic: two of the three make the lower low, top and bottom, while the middle maturity highlighted in blue does not, and that middle one is what he labels the failure swing (8:32). He reads it as an interest rate shift, and says that if it happens while a trader is identifying an institutional order reference point in the Dollar Index – for example a bullish order block – it confirms that particular idea (8:55).
On the charts he uses: he says the ones shown come from bar chart dot com, which he describes as free (9:31). His point there is that simply plotting open, high, low and close on these specific markets does not convey understanding, and that the analysis has to be comparative rather than read off a single chart, which is why he says the pattern evades most people.
The week he walks through on the charts
At 10:33 he turns to the move in the Dollar Index during the week of the recording: he says it came down into the 99.50 level and rallied aggressively away from it (10:40). The 30-year chart he then shows is a 90-minute chart covering roughly fifteen to eighteen days (11:00), and in it he points to a failed higher high between the 5th and the 7th or 8th of the month, which he calls a failure swing in the 30-year (11:17), and says that on its own it means nothing.
He then compares the same highs on the shorter maturities: the next one down he describes as relatively unchanged, flat to neutral, neither a considerable higher high nor a lower high (12:02), and on the 5-year he says there was clearly a higher high (12:17). His summary is that this combination by itself highlights a shift in the interest rate market (12:32).
How the divergence is meant to confirm the trade
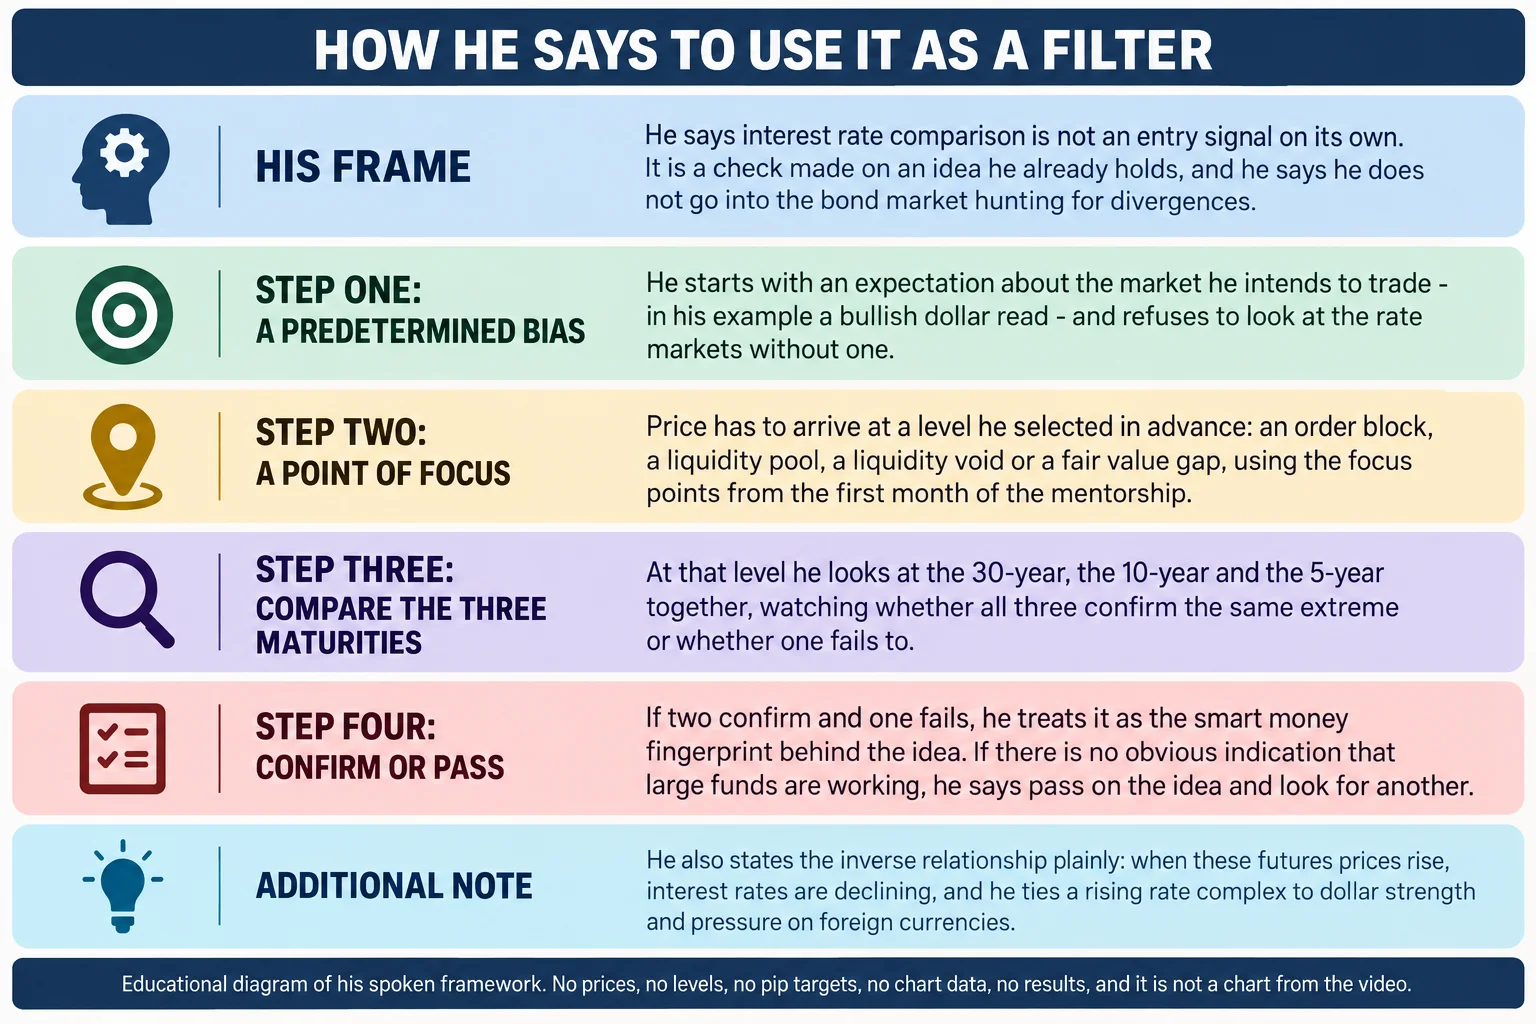
His next point is that the process has to start from an idea he already holds. At 13:16 he says he does not scan the bond market looking for these divergences, and that a trader has to have a predetermined view about how the market they intend to trade should behave. Over the same window he compares, he says the Dollar Index made a lower low and traded into a significant price level (13:31), which he notes is on a closing basis, and that this stands against the 30-year failing to make the higher high it should have made comparably.
The level itself he ties back to an old order block from the midpoint of November that had already been traded back into once, on 15 November, before price came back down into the same 99.50 area in the week that includes 8 December (14:15, 14:34) and rallied hard. For foreign currencies he draws the consequence: that dollar strength gives reasons to trust bearish order blocks, bearish turtle soups and returns to fair value, with big ranges closing, then continuation lower after a retracement higher (15:56).
At 15:12 he states the purpose of the whole exercise: when price trades into that order block, the rate markets are where he looks for a clue that the smart money is working the level. He says this is his answer to the common question of how to validate which order block to trade from, and that a matching divergence at a specific order block on the Dollar Index is what he calls the green light to start refining the idea.
The euro and cable examples from that week
With a bullish dollar read he says the natural focus is the other side of the pair, and he names the euro (using the nickname fiber) (15:56). He says a level of buy stops had been indicated before the week started and that the market rallied back above the 108.15 to 108.20 area, clearing out the buy stops, then rolled all the way up through 108.65, which he describes as an old low not shown on the chart he had up (16:20, 16:26). Those figures are reproduced exactly as the automated transcript renders them; he is describing a euro chart, the exact digits are his reported coordinates rather than prices confirmed here, and they should be treated as approximate.
He also blends a second market into the read: cable, meaning GBP/USD, failed to make a higher high at the same time the euro made its higher high and the dollar made its lower low (16:47). His conclusion is that divergence is not always a matter of one asset in one location, and that a couple of things sometimes have to be blended to read what the smart money is doing. He also concedes the limits of the model: 17:59, because a longer-term shift can disturb the short-term relationships, and he says the scenarios repeat themselves over a long period rather than every time.
His action plan, and when he says to pass
He then turns the teaching into a plan, saying it has to be framed so it is useful in context rather than in hindsight, and points back to the focus points taught in the first month of the mentorship (18:34). His sequence is:
- Hold a predetermined bullish or bearish expectation for the market being traded (13:16).
- Wait for price to trade to a focus point: an order block, a liquidity pool, a liquidity void or a fair value gap (18:49).
- At that point compare the 30-year, the 10-year and the 5-year against the Dollar Index (7:20).
- If there is no obvious indication that large funds are moving, pass on the idea and look for another (19:02).
The bearish-dollar version
He runs the same logic in the other direction. On a bearish dollar read he says you would see the rate markets making lower lows, one after another, until eventually one of them fails to make that lower low (19:33, 19:36), and that failure is what validates the sell signals being read on the Dollar Index at a bearish order block, an old high, a liquidity pool or a trade into a fair value gap. He then expects the dollar to roll lower and these three futures to trade higher in price, which in his framework means interest rates declining, and he calls that bearish for the dollar (19:59).
What the recording establishes and what it does not
In closing he repeats the main warning: this is not a matter of selling every up candle or buying every down candle, but of looking behind the scenes at the underpinnings of the market (20:29), and he describes the rate-market divergence as a fingerprint the smart money leaves behind that validates a setup (20:38).
What the recording contains is his framework and his reading of his own charts in one week. It does not contain order fills, position sizes, account results, win rates or any independent measurement of the pattern, and it does not define an objective tolerance for calling a swing flat or specify how close together in time two compared extremes must sit. The chart levels and drawings are reported from his narration; this article did not view the charts, and nothing here should be read as verified profitability, a recommendation to copy a trade, or evidence that the pattern works.
Date and identity note
He dates the whole content delivery of the first month of this mentorship to September 2016 (2:20), and describes the illustrated week as the week that includes 8 December. The transcript does not give the calendar year of that week, so no year is assigned to it here. The watch page lists the upload as 6 September 2022, which is the publication date of this recording on YouTube and must not be read as the date of the market activity he describes.
A note on the transcription
The source for this article is the full original audio of the recording, transcribed locally with the whisper-large-v3-turbo automatic speech recognition model; it is automatic transcription, not human-verified captions, and it carries automated timestamps. The cached source records a complete decode of the full audio, but automatic transcription still mishears terms and digits and it cannot see the charts. That is why the level figures he speaks are quoted as his reported coordinates and left unconfirmed here, and no claim depends on a chart the reviewer did not see. The recording itself is public and playable on YouTube; it is not embedded on this page because the video owner has disabled playback on other websites, which was tested directly – see the card below.
ICT Mentorship Core Content – Month 04 – Interest Rate Effects On Currency Trades
The Inner Circle Trader · watch page lists upload 6 September 2022 · 1255 seconds, about 20 minutes 55 seconds · public, not unlisted. The recording identifies itself as Month 04 of the Core Content mentorship and refers back to the first month of that mentorship. This recording is the primary source for every timestamp link on this page.
The recording is not embedded here. An embedded player was tested directly on 15 September 2026 from a BestProps page origin at desktop and mobile widths: the frame loads and then reports “Playback on other websites has been disabled by the video owner”, with no playable stream and no duration reported in either case. The link above opens the recording on YouTube itself.
Resources
These are the sources checked while preparing this article. The CME page is the exchange’s own overview of the 30-year Treasury bond futures contract at the long end of the triad; the CFTC advisory is the regulator’s note on trading systems and hypothetical results sold to the public. Neither evaluates this speaker, tests whether an interest rate divergence provides an edge, verifies the levels quoted in the recording or endorses anything said in it. Any ICT, smart-money or third-party indicator, script, note set, chart annotation, transcript pack or re-upload circulating outside the publishing channel’s own page is unofficial, has not been tested here, and no claims about its accuracy are made.
- [1] ICT Mentorship Core Content – Month 04 – Interest Rate Effects On Currency Trades — The Inner Circle Trader (primary source; watch page read 15 September 2026, published 6 September 2022, listed at 1255 seconds).
- [2] The Inner Circle Trader — official YouTube channel (read 15 September 2026) — the publishing channel for the Core Content mentorship series this module belongs to.
- [3] CME Group — U.S. Treasury Bond Futures and Options overview (read 15 September 2026) — the exchange’s own contract page for the long end of the triad, listing the contract unit, quotation convention, product code and trading hours. Contract reference only; it contains none of the lesson’s rules or figures.
- [4] U.S. Commodity Futures Trading Commission — Fraud Advisory: Commodity Trading Systems Sold on the Internet (read 15 September 2026) — notes that technical analysis attempts to predict future price movements from historical prices, price relationships and price trends, and that hypothetical trading results are typically simulations over historical data rather than real fills.