
Key takeaways
This recording identifies itself as Month 04 content on reinforcing fair value gaps, framed as a concept of trading inside the range 0:26.
Read the full summary
This recording identifies itself as Month 04 content on reinforcing fair value gaps, framed as a concept of trading inside the range 0:26. His definition is a range in price delivery where one side of the market liquidity is offered, usually confirmed by a liquidity void on a lower time frame, with the possibility of a literal price gap when price jumps 0:34, 0:36, 0:48. He works through a EUR/USD daily chart: a down candle leaves roughly a 20-pip pocket open between the low of the candle before it and the high of the candle after it, with the already-offered liquidity on both side candles excluded from the measurement 1:21, 1:26, 1:36, 4:27, 4:35. He then drops to a four-hour chart, where sell-side liquidity is run below an old low in what he calls a turtle soup or false break, before price trades back up and closes the gap 6:33, 6:47, 6:52, 7:20. On five- and fifteen-minute charts he refines the same idea to a few pips, including an actual opening gap between two candles, and states levels such as 104.75, 104.70 and 104.55 as he narrates them 9:56, 12:28, 12:35, 16:05. He closes by describing the overlap between fair value gaps, liquidity voids, order blocks and liquidity pools 17:36.
How we researched this article
BestProps used document-based research from primary firm sources, checked September 24, 2026. The complete source list, scope, limitations, and commercial-state record appear near the end of this article.
His definition of a fair value gap
He opens by naming the subject as the reinforcing of fair value gaps and placing it inside the idea of trading inside the range 0:26. The definition he gives is a range in price delivery where one side of the market liquidity is offered, typically confirmed with a liquidity void on the lower time frame charts covering the same range of price 0:34, 0:36. He adds that price can also gap outright, creating a literal vacuum of trading and posting an actual price gap 0:48. Those are two different things in his account — an inefficient range that was never traded, and a true jump in price — and he keeps them separate before moving to the charts.
The daily EUR/USD example and the three candles that frame it
He puts up a EUR/USD daily chart and asks where a fair value gap can be seen, then identifies it as the blue shaded area, describing it as about a 20-pip range on the daily 0:56, 1:05, 1:19, 1:21, 1:26, 1:36. What makes that pocket significant, in his explanation, is which parts of the surrounding candles were already traded.
He walks through the candles one at a time. To the left of the down candle that creates the gap there is a higher bearish candle: it closed down but came off its low, so he looks specifically at the low up to the close, that small wick 1:54, 2:03, 2:11, 2:16. That range, which he quotes as 105.15 to approximately the 105 big figure, has already been traded up into once, meaning the buy-side liquidity over that range has already been offered 2:22, 2:29, 2:38, 2:45, 2:52. His conclusion from that is direct: because that range has already been delivered, it is not the part of the down candle he is concerned with 2:58, 3:10, 3:17.
He then applies the same test to the other side. The candle to the right of the down candle is an up-close candle, and he says the open to the high on that candle has also offered buy-side liquidity 3:28, 3:35, 3:46, 3:52. So on both framing candles the liquidity over part of the range has already been delivered, which leaves one specific area untouched: the low of the previous candle and the high of the candle to the right of the down candle, with the down candle spanning the space between them 4:02, 4:09, 4:15, 4:27, 4:35. He quotes that as between the 105 big figure and down about 25 pips, and notes that nothing has traded outside the movement of that range except the down candle itself, with no up movement at all on this time frame 4:46, 4:54, 5:01.
Why the gap belongs to the time frame you are reading
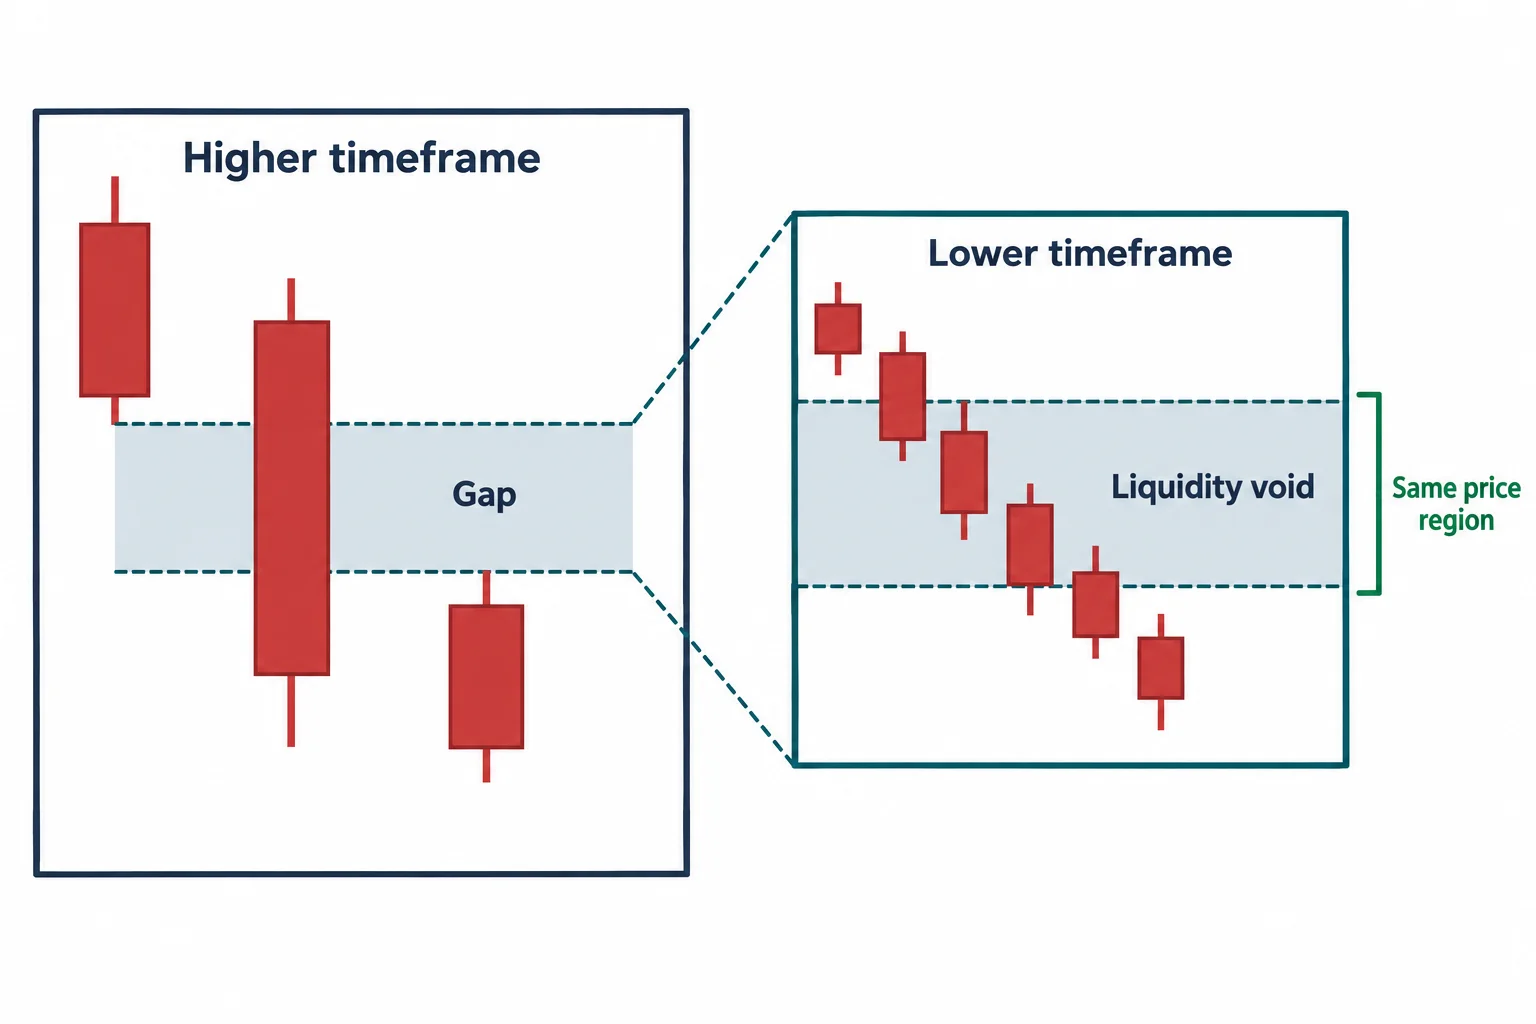
He pauses on a qualification that matters for anyone trying to reproduce this. If you are studying a specific time frame, he says, the gap occurs on the time frame you are looking at, and while you can break further into smaller time frames, on those smaller time frames you will probably see a liquidity void instead 5:06, 5:10, 5:15. His description of the difference is practical: on the higher time frame the gap is one clean pocket between two reference points, whereas on the lower time frame it is often multiple candles creating the same open space of range 5:19, 5:25, 5:29.
Back on the daily chart he summarises the setup he now has: the specific levels in mind, and two line segments marking one candle’s low and one candle’s high, with the big down candle in the exposed area between them 5:39, 5:43, 5:48. That exposed area is the gap, and in his reading only sell-side liquidity has been offered inside it 5:52, 5:56. He reaches for an analogy he says he has used before — a paintbrush on the down candle that creates the lowest low — and describes a pocket of what he calls porous price action that was only delivered on the downside, which is why he expects price to eventually want to trade back up into the gapped area and fill it in 5:56, 6:00, 6:05, 6:15, 6:19, 6:26.
The four-hour chart: the stop run comes first
Zooming in to a four-hour chart, he keeps the same delineated levels and points to a low marked out as a potential liquidity run on sell stops below it 6:26, 6:33, 6:39. Price does in fact go below that previous low, which he calls the formation of a turtle soup or false break below an old low 6:47, 6:52, 6:59. His reasoning for expecting a move back up to fill the gap is stated as a consequence: the sell-side liquidity below the low has now been taken out 6:59, 7:04, 7:09. Above, he notes equal highs delineated on the same four-hour chart with the fair value gap sitting right above them 7:09, 7:09.
He then reports that price does trade back up and closes the fair value gap, which completes that idea 7:20. He describes it as not a great deal of money or pips but something he calls a highly profitable and probable condition in the marketplace, where fair value gaps and double tops sit with buy stops resting above them, and a turtle soup run below the old low sets up the move 7:29, 7:38, 7:43. He also attaches a market-condition read to it: with the year ending and the holidays coming, trading is range bound, and in a range-bound consolidation profile this is the style of trading he wants to be doing, looking for stops and gaps 7:43, 7:43, 7:56, 8:00, 8:07. The move he reports is well over 100 pips taking about two days, and he notes the same gap was delineated on the daily chart earlier in the week and has since been filled 8:07, 8:20, 8:28, 8:35.
One statement in that passage needs to be read carefully. Calling the condition highly profitable and probable is his characterisation of what he is looking at, and the recording offers no sample, no win rate and no test to support it. What the transcript does support is that he described a gap, described a stop run below a low, and described price trading back into the gap afterwards.
The overlap he wants understood
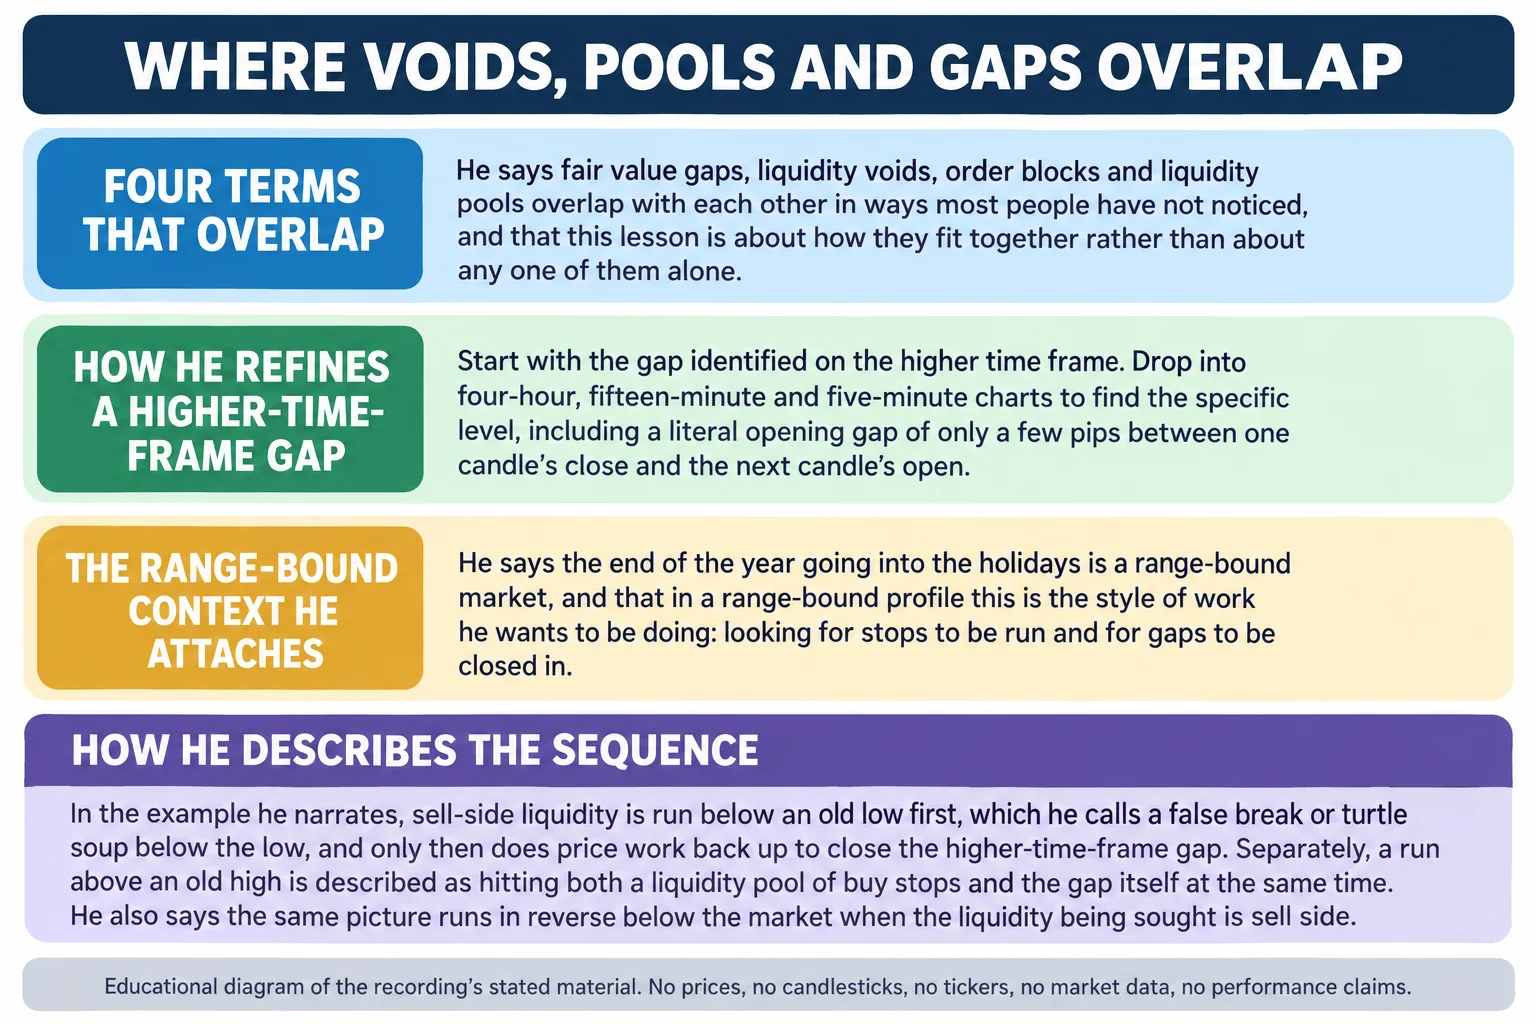
He notes before the next section that fair value gaps, liquidity voids, order blocks and liquidity pools overlap a lot, in ways he says most people are probably not aware of yet, and that this overlap is what the study notes and the following week’s supplementary teachings are for 8:59, 9:05, 9:11, 9:14, 9:19, 9:23, 9:29. He frames the month’s material as preparation for the January 2017 content 9:34, 9:39, 9:44, and says the chart work is the way to understand how voids and gaps sit together rather than as separate ideas 9:44, 9:48.
Five- and fifteen-minute charts: the same idea at a few pips
On a five-minute EUR/USD chart he focuses on the 104.75 level and the moment it was pierced, which he says was the second time price traded through that level 9:56, 10:04, 10:11. He then explains what that run is doing: it runs above an old high at 104.75, which is also a liquidity pool in the sense that it is running buy stops, and at the same time it is hitting the fair value gap 10:21, 10:30, 10:38. That combination — one move serving as both a stop run and a gap fill — is the overlap he was describing.
He also shows what a genuine void looks like at this scale. On the lower time frames he says you will often see a liquidity void rather than a clean gap, and he walks through a sequence where a candle moves lower, the next candle opens down at a separate level, leaving a gap between them, and then price trades up into it and closes it in 10:49, 10:56, 11:00, 11:06, 11:08, 11:13. What follows in his narration is a significant break lower and then lower still, ultimately trading through to where he said the sell stops were 11:30, 11:43.
On the fifteen-minute chart he reports the two visits into that level separately: the first time price trades up and closes the gap, and the second time it trades up and runs out the previous high 11:47, 11:51, 11:55, 11:57, 12:00. The numbers he gives are a previous high at 104.77 against a candle high of 104.78, which he calls trading to it in just about one pip 12:02, 12:06, 12:10.
He then shows the distinction he cares most about on this chart. After a down candle and a lot of movement lower, price comes off that low and gaps: one candle closes at 104.72 and the next opens at 104.70, a two-pip difference, which he treats as an actual gap 12:14, 12:19, 12:28, 12:32, 12:35. He says that lets a seller work from a more refined level, 104.70 on a limit order, or live as price hits it 12:45, 12:51, 13:00.
The reason he points at the candle bodies is the precision he is describing. The close on one candle is 104.72, which he says is exactly the high on the other candle’s close; the wick trades through, but the bodies close the gap completely, so the space between the two down candles is filled in by the up candle that followed 13:06, 13:11, 13:19, 13:25, 13:30. He calls that efficiency in the price delivery 13:34, 13:39. He runs the same check again on the next set: a candle with a high at 104.78 and a close at 104.75, the next opening at 104.74 and making a high at 104.76, which is the two-pip up move from open to high that he counts as buy-side liquidity offered, followed by a down close and a gap down 13:45, 14:00, 14:08, 14:14, 14:17, 14:19. He identifies the level where that liquidity sits as 104.74, the opening of the candle, and describes price returning there and filling that delivery exactly 14:25, 14:30, 14:37, 14:43, 14:45.
The lower levels he marks, and how he ties it back
He extends the same reading downward. With the buy-side liquidity already gone from the range above, he looks for where price was previously delivered on the buy side and marks 104.55, described as the last point at which a low had traded up to the close with buy-side liquidity delivered 15:08, 15:15, 15:21, 15:28, 15:33, 15:44, 15:52. Below that he says everything is sell side and nothing sits above it until later, and he describes a gap forming where price trades up into the level and he would be a seller 15:52, 15:57, 16:05. The levels he states for that idea are selling at 104.55 or 104.50, looking for a move down below 104.15 and then the 104.10 level 16:05, 16:16.
What he reports next is that the run produced exactly what he described, hitting the level twice, with the high on one candle and the low on another both reading 104.55 16:16, 16:30, 16:36. He characterises the whole picture as a full block of delivery deficiency both up and down, on both sides of price, and says that once the low breaks, everything is on the sell side and price comes right back to the level, which he calls perfect and efficient delivery at 104.55 16:46, 16:52, 16:56, 17:03, 17:10. He adds that it does it twice, then sells off and runs the sell stops below the low 17:10, 17:16, 17:23. He closes by saying this was intended to show how liquidity pools, liquidity voids and fair value gaps draw together in an overlapping scenario, with more scenarios to come in the December material 17:36, 17:43, 17:49.
Those chart observations, levels and reported reactions are all his spoken account of charts he is displaying. Relatively little of this can be independently established from the recording: there is no order detail, no fill report, no position size, no risk placement and no account figure anywhere in it, and no measurement of how often a gap is revisited or a projected reaction follows. What can be taken from the lesson as stated is the definition, the three-candle framing, the exclusion of ranges where liquidity has already been offered, the time-frame dependency of the gap, and the way he sequences a stop run and a gap fill together.
Watch the original recording
ICT Mentorship Core Content – Month 04 – ICT Fair Value Gaps FVG
The Inner Circle Trader · watch page lists upload 10 September 2022 · 1,077 seconds, about 17 minutes 57 seconds. The recording is presented as Month 04 material and refers forward to the December study notes and January 2017 content. This recording is the primary source for every timestamp link on this page.
The recording is not embedded here. An embedded player was tested directly on 15 September 2026 from a BestProps page origin at desktop and mobile widths, and it loads but then reports “Playback on other websites has been disabled by the video owner”, with no duration and no playback progress, while the video itself plays normally on YouTube. No half-working player is left on this page.
The watch page was read on 15 September 2026 and is publicly listed as ICT Mentorship Core Content – Month 04 – ICT Fair Value Gaps FVG by The Inner Circle Trader, with an upload timestamp of 10 September 2022, not private and not unlisted, and a listed duration of 1,077 seconds — about 17 minutes 57 seconds, against a transcribed audio duration of 1,076.7 seconds.
A note on the transcription
There was no usable caption track for this recording, so the transcript behind this article is an automatic speech-recognition pass over the full original audio, not human-verified captions and not YouTube’s own captions. The pass covered the complete audio and reported no low-confidence stretches, but a machine transcript still mishears terms and several here sit inside load-bearing statements. The word “gap” itself is rendered as “gapped” in one place and the phrase about fair value gaps is garbled in another 6:15, 11:51. A passage in the four-hour section that appears to concern what price is reaching for above the equal highs is unclear as recorded 7:04. The reference to the December 2016 trading year is rendered in the audio as 2006 7:43. The levels quoted throughout this article — 105.15, the 105 big figure, 104.78, 104.77, 104.76, 104.75, 104.74, 104.72, 104.70, 104.55, 104.50, 104.15, 104.10 and the pip and 20-pip range figures — all come from his spoken words and are reported as such. Nothing in this article is taken from anywhere other than the spoken content of this recording, and this review did not view the recording’s charts: the chart readings described above are reported from his narration of them, not inspected independently.
Resources
These are the sources checked while preparing this article. The CFTC and Investor.gov pages are general regulator material about how trading systems and technical analysis claims should be assessed, and the Treasury page is the published data behind the interest-rate side of a currency pair; none of them evaluates this speaker, verifies the fair value gap definition or the overlap claims, tests how often gaps are revisited, or endorses anything said in the recording. Any ICT, smart-money or third-party indicator, script, note set, chart annotation, transcript pack or re-upload circulating outside the publishing channel’s own page is unofficial and has not been tested here.
- [1] ICT Mentorship Core Content – Month 04 – ICT Fair Value Gaps FVG — The Inner Circle Trader (primary source; watch page read 15 September 2026, listed duration 1,077 seconds).
- [2] The Inner Circle Trader — official YouTube channel (read 15 September 2026) — the publishing channel for the mentorship series used here.
- [3] CFTC — Fraud Advisory: Commodity Trading Systems Sold on the Internet (read 15 September 2026) — notes that technical analysis attempts to predict future price movements from historical prices, price relationships and price trends, and that hypothetical trading results are typically simulations over historical data.
- [4] Investor.gov (U.S. SEC) — Day Trading (read 15 September 2026) — describes intraday buying, selling and short-selling over very short holding periods and states plainly that day trading is extremely risky; relevant to the lower-time-frame execution he describes.
Source: ICT, ICT Mentorship Core Content – Month 04 – ICT Fair Value Gaps FVG, The Inner Circle Trader, watch page upload date 10 September 2022; the recording is presented as Month 04 material aimed at the December 2016 to January 2017 period. Local automatic speech recognition of the full original audio was the transcript used for this article, and it is not human-verified captions. This commentary is educational and is not investment advice.