
Key takeaways
This recording identifies itself as teaching number eight of eight in the December 2016 mentorship content and its subject as double tops and bottoms 0:31, 0:40.
Read the full summary
This recording identifies itself as teaching number eight of eight in the December 2016 mentorship content and its subject as double tops and bottoms 0:31, 0:40. His argument is that a double top is not resistance and a double bottom is not support but a place where protective stops are likely to be sitting: buy stops above the equal highs, sell stops below the equal lows 4:26, 4:53, 8:05. He pairs that with a measured projection — the high down to the intervening low between the two peaks, projected above the formation, or the mirror for a double bottom — and reports two examples on the charts he shows: one where the candle open and the later high are both quoted at 77.42 6:43, 6:54, and one where the projected objective is 74.45 against a reported high of 74.46 9:14, 9:47. He ends by saying he does not trust double tops or bottoms at all, and that the extreme ends of a trading range are where he expects the higher-probability work to be 12:10, 12:37.
How we researched this article
BestProps used document-based research from primary firm sources, checked September 24, 2026. The complete source list, scope, limitations, and commercial-state record appear near the end of this article.
What the lesson covers
He opens by identifying the recording as teaching number eight of eight in the December 2016 mentorship content and says the specific subject is double tops and bottoms 0:31, 0:40. Before the formations themselves he spends time on measured moves and what he calls clean highs and clean lows, pointing at price action where there was a drop with relatively equal highs sitting in it 0:47, 0:57. He describes measured-move behaviour as a recurring phenomenon in the marketplace and points to one swing whose projection lines up close to the level above 1:14, 1:34.
He also explains where the framework came from. He says that as he was coming up as a trader he blended what he learned from institutional and retail trading, and that he noticed runs on stops below lows as well as measured-move ideas running throughout price action 1:42, 1:50, 1:58. The double tops and measured moves he then demonstrates are presented as examples of that observation, not as a tested system.
First example: the references he maps before any trade idea
On the first chart he identifies a consolidation with liquidity and ranges sitting above and below it 2:22, 2:28, 2:32. The specific references he marks are a candle opening at 77.42 and another candle whose high comes in at 77, which he calls a big figure, giving him the range he is working inside 2:51, 3:04, 3:07. Above that he says the open of one up candle and everything below a second up candle is sell-side delivery 3:09, 3:18, and inside the same area he marks a gap or liquidity void 3:24, a fair value gap 3:34, and the body of the last down candle before the big move up, which he calls the bullish order block 3:52, and he says he focuses primarily on that candle’s open 4:02.
His summary of that preparation is that both sides of the market’s liquidity are now mapped, which lets him build ideas about what he would reasonably expect price to do 4:16, 4:21. That step — marking the stops on both sides before forming the idea — is what the rest of the lesson elaborates.
The retail reading he contrasts with his own
He sets up the contrast explicitly. In the retail reading, the relatively equal highs are a double top, therefore resistance: short the level, put a protective buy stop above the highs, and expect price to trade down to the low that previously acted as support 4:26, 4:37, 4:42, 4:47. That is the interpretation he says he is arguing against.
In his reading, the important fact about the same formation is that price has buy stops above it 4:53. He describes the intention as making traders who are already short drop their protective buy stops lower, then waiting for price to drop, close in the fair value gap and potentially hit the order block below 5:00, 5:06, 5:08, 5:17. From there he lays out two sequences: price drops to that level and then goes back up to clear out the buy stops, or price comes up first, trades into the void and closes it, and then trades lower to close the fair value gap or hit the bullish order block 5:20, 5:24, 5:27, 5:35. He labels these the two scenarios 5:41.
He then narrates which one the chart produced. Price starts breaking down, so the liquidity he expected to be sought first is on that side: it drops into the fair value gap and the order block, then the equal highs are blown out and price reaches up into the area above 5:46, 5:51, 5:57, 6:02. He notes a range and a fair value gap below as well, sees price hit the bullish order block and show willingness to rally, and says the double top and the buy stops above it are now gone, leaving the void above as the next thing to close 6:06, 6:20, 6:31.
The precision he reports from the example is that he placed a level on the opening price of that candle, price traded up to it and hit it to the pip, and the high of 77.42 matched the opening price of the candle at 77.42 6:36, 6:43, 6:54. He restates the sequence as a double top, buy-stop liquidity, a run up into a liquidity void to a bearish order block formed by the last two up candles, the void closing, and then a run on the liquidity below the prior low 7:04, 7:14, 7:20.
The measured projection he puts above the formation
The second double-top example is where he introduces the measurement 7:30, 7:35. He describes price trading down into a bullish order block — the last down candle before the up move — and calls that a nice buying opportunity 7:38, 7:44, 7:46. The retail reading is again resistance, because price hit that level and traded lower, and short traders have their protective buy stop above the equal high 7:49, 7:55, 8:05.
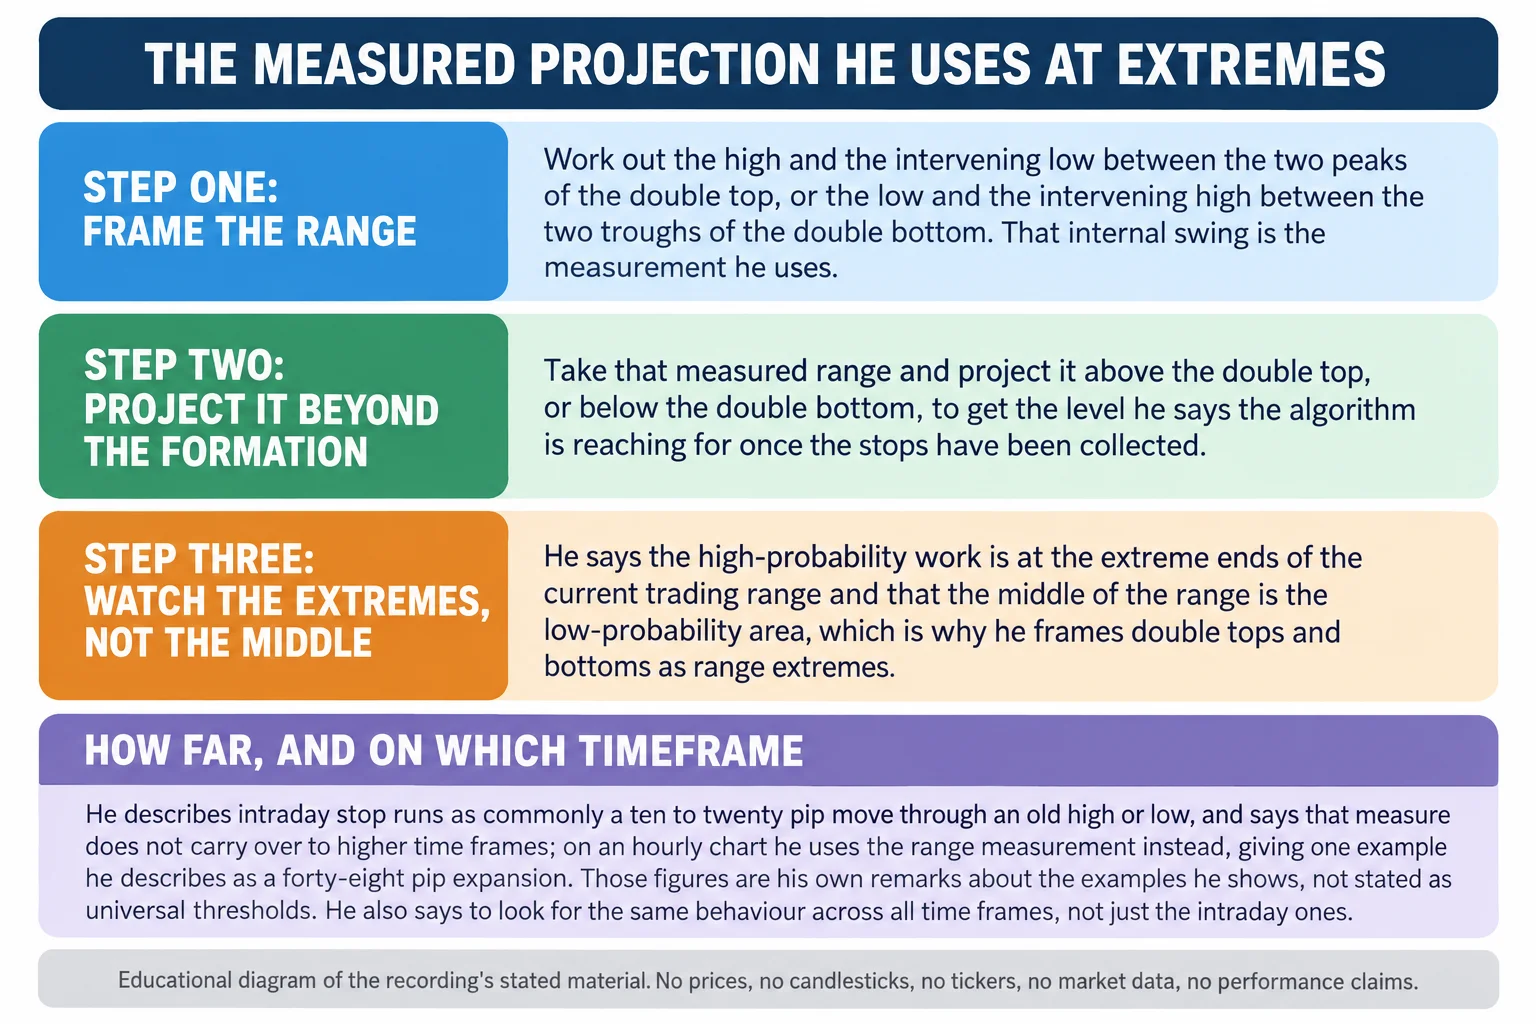
His addition is the measure. His instruction is to measure the high down to the low between the two peaks and project that range upward, because in his words the algorithm will reach that far up since it remembers the range back there 8:40, 8:50, 9:01, 9:11. The number he states as the objective is 74.45 9:14. He also notes that there is probably some kind of momentum divergence at that old resistance level, and puts a momentum indicator on the chart for completeness because the month’s material covers it 9:27, 9:31, 9:41, 9:47, but he keeps the projection as the basis of the idea rather than the divergence 9:47, 9:53.
What he reports next is that the high came in at 74.46, off by one pip, and he describes the move as reaching a specific price level and running the double top out, followed by a move lower that ran the liquidity below the lows 9:47, 10:04, 10:18, 10:27. Two things should be kept apart here: that is his account of what he says the chart shows, and the projection method is his stated explanation of why. The recording contains no verification of the marking, no order or fill detail and no test of the method against other approaches.
The double bottom, run in reverse
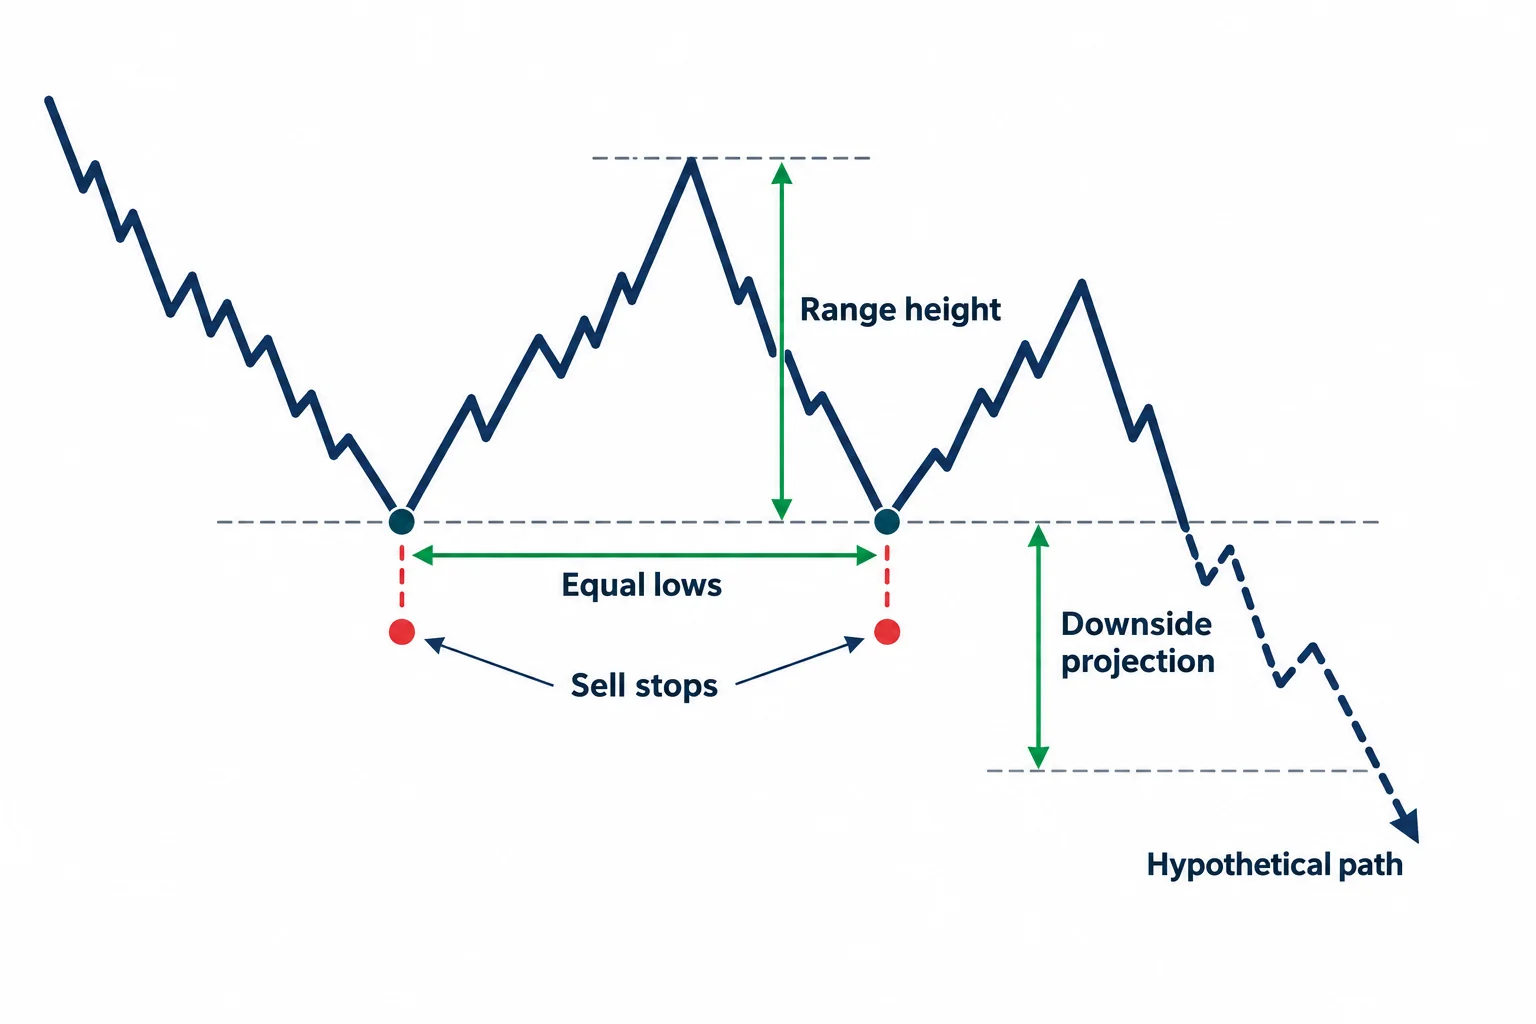
He then turns the same logic upside down 10:35. Traders see the equal lows as support and price rallies away from them, which is what he says lets sell stops build below 10:35, 10:43. The measurement is the mirror image: take the high down into the low, which gives the range, and project it downward to get the objective where he says price will look to seek downside liquidity 10:54, 10:57, 10:59, 11:07. He describes the projected level being reached and price then reacting back up to the double-top reference point, which he says lines up exactly on both price points 11:13, 11:22.
That example is short, and the reason is the point he pulls out of it: the tip-off is the reference points themselves. In his description the algorithm knows those levels, and even if time has passed it finds them from the consolidation, then expands the projections above and below, which is why he says you get spike reversals on both sides of the marketplace and the reactions that follow 11:32, 11:38, 11:43, 11:50.
His conclusion: do not trust the formation
The conclusion is stated plainly. Double tops and bottoms may take time to trade through, but in his words he never trusts them, because the market makers and the interbank algorithm will go through old highs and old lows seeking sell stops below and buy stops above 12:03, 12:10, 12:15, 12:23. He then sets out where he thinks the probability sits: the extreme ends of the range are where he places high-probability trading, and the middle of the range is the low-probability area 12:32, 12:37. From that he gives the practical instruction to frame the extremes of the current trading range, highlight double-top and double-bottom areas on every chart going forward, and treat them as the specific levels at which price will drive through — above for the buy stops and below for the sell stops 12:43, 12:48, 12:52, 12:58.
The timeframe qualification he adds
He is explicit that the distance travelled depends on the chart you are reading. On an intraday chart he describes a stop run as commonly a ten to twenty pip move above an old high or below an old low 13:04, 13:10, 13:16, 13:22, and he says that measure cannot be carried over to a higher timeframe such as the hourly chart 13:24, 13:28. On the hourly chart he falls back on the range measurement instead, and the example he gives is a range he puts at 48 pips, driven by the movement inside the consolidation before the double top was run out 13:30, 13:37, 13:45, 13:54. He notes that the double top formed and gave the reference point from its highs and the internal range, and that price traded for a long stretch before eventually working it out 14:00, 14:11.
At that point he refers back to something he says he taught in September about looking for clean levels, and the recording is not clear at the point where he explains when such a level becomes usable 14:17, 14:21. What comes through is that a level is not automatically actionable on the day, and that it becomes informative when price later runs through it — at which point the question he says to ask is which side of liquidity is next once the buy stops have already been taken, which for him is the sell stops 14:24, 14:29, 14:33, 14:37.
He closes by saying the phenomenon shows up on all timeframes, that he is confident a reader will be surprised by how often it appears, and that it should be studied across intraday, hourly and higher charts rather than on one timeframe alone 14:40, 14:46, 14:51, 14:53, 14:56, 14:58.
The distinction worth keeping is between what is descriptive and what is interpretive. Relatively equal highs and lows are observable, and stops do cluster at obvious levels. The explanation the recording offers — an algorithm that remembers prior ranges, seeks the stops and expands projections to reach them — is his market theory. Nothing in the recording measures how often the projections are hit, whether the examples were marked before or after the fact, or what the results would be after costs, and no order, fill or account figure is stated anywhere. The chart observations in this article are reported from his spoken description of the charts he displays, not from an independent review of those charts.
Watch the original recording
ICT Mentorship Core Content – Month 04 – Double Bottom Double Top
The Inner Circle Trader · watch page lists upload 10 September 2022 · 904 seconds, about 15 minutes 4 seconds. The speaker opens the recording as teaching eight of eight in the December 2016 content. This recording is the primary source for every timestamp link on this page.
The recording is not embedded here. An embedded player was tested directly on 15 September 2026 from a BestProps page origin at desktop and mobile widths, and it loads but then reports “Playback on other websites has been disabled by the video owner”, with no duration and no playback progress, while the video itself plays normally on YouTube. No half-working player is left on this page.
The watch page was read on 15 September 2026 and is publicly listed as ICT Mentorship Core Content – Month 04 – Double Bottom Double Top by The Inner Circle Trader, with an upload timestamp of 10 September 2022, not private and not unlisted, and a listed duration of 904 seconds — about 15 minutes 4 seconds, against a transcribed audio duration of 903.7 seconds.
A note on the transcription
There was no usable caption track for this recording, so the transcript behind this article is an automatic speech-recognition pass over the full original audio, not human-verified captions and not YouTube’s own captions. The pass covered the complete audio and reported no low-confidence stretches, but a machine transcript still mishears terms, and several are worth naming because they sit inside load-bearing statements. The phrase “double tops” comes through as “double toss” once, in the sentence about what the algorithm knows 13:35. The sentence about what measure applies on a higher timeframe than the intraday charts is garbled at the point of recording it 13:28. The passage where he refers back to his September teaching about clean levels, and to when a level becomes usable, is also unclear as recorded 14:17, 14:21. The chart levels quoted in this article — 77.42, 77, 74.45, 74.46, the ten-to-twenty pip intraday measure and the 48-pip range — all come from his spoken words and are reported as such. Nothing in this article is taken from anywhere other than the spoken content of this recording, and this review did not view the recording’s charts: the chart readings described above are reported from his narration of them, not inspected independently.
Resources
These are the sources checked while preparing this article. The CFTC and Investor.gov pages are general regulator material about how trading systems and technical analysis claims should be assessed, and neither evaluates this speaker, verifies the stop-liquidity explanation, tests the measured projection or endorses anything said in the recording. Any ICT, smart-money or third-party indicator, script, note set, chart annotation, transcript pack or re-upload circulating outside the publishing channel’s own page is unofficial and has not been tested here.
- [1] ICT Mentorship Core Content – Month 04 – Double Bottom Double Top — The Inner Circle Trader (primary source; watch page read 15 September 2026, listed duration 904 seconds).
- [2] The Inner Circle Trader — official YouTube channel (read 15 September 2026) — the publishing channel for the mentorship series used here.
- [3] CFTC — Fraud Advisory: Commodity Trading Systems Sold on the Internet (read 15 September 2026) — notes that technical analysis attempts to predict future price movements from historical prices, price relationships and price trends, and that hypothetical trading results are typically simulations over historical data.
- [4] Investor.gov (U.S. SEC) — Day Trading (read 15 September 2026) — describes day trading as buying, selling and short-selling within the day on short holding periods, and states plainly that day trading is extremely risky; relevant to the short-term timeframe he discusses in the middle of this lesson.
Source: ICT, ICT Mentorship Core Content – Month 04 – Double Bottom Double Top, The Inner Circle Trader, watch page upload date 10 September 2022; the recording identifies itself as teaching number eight of eight in the December 2016 content. Local automatic speech recognition of the full original audio was the transcript used for this article, and it is not human-verified captions. This commentary is educational and is not investment advice.