
Key takeaways
ICT Mentorship Core Content Month 04 Divergence Phantoms is a 21 minutes 52 seconds YouTube lesson teaching seven of eight from the December 2016 mentorship and framing momentum indicators as tools for reading other traders rather than predicting price.
Read the full summary
ICT Mentorship Core Content Month 04 Divergence Phantoms is a 21 minutes 52 seconds YouTube lesson teaching seven of eight from the December 2016 mentorship and framing momentum indicators as tools for reading other traders rather than predicting price. Type 1 classic divergence pairs a price higher high with a lower momentum high or a price lower low with a higher momentum low, while Type 2 hidden or trend-following divergence pairs a price higher low with a lower oscillator low. On hourly USD/CAD charts from 10 and 11 November and an hourly USD/CHF chart, ICT argues that apparent bearish divergence is a phantom that attracts sellers before price takes liquidity above prior highs, while the more relevant signal is price holding a higher low as momentum cycles lower. The USD/CHF example describes a dip into 96.45 to 96.40 without violating the low, a long near 96.45, an exit near 97.08, and subsequent runs through equal highs marked at 97.28 and 97.60. He recommends using the body rather than the wick of the prior down-close candle, says momentum need not reach oversold, and treats consolidation and whether conditions justify trading as a fifth consideration beyond overbought, oversold, bullish divergence, and bearish divergence. The lesson was published on 10 September 2022 and provides no backtest, sample size, win rate, verified fills, position sizing, stop, risk data, or profitability evidence, so all levels, liquidity claims, order blocks, and market-maker trap mechanics remain retrospective interpretations of selected charts.
How we researched this article
BestProps used document-based research from primary firm sources, checked September 24, 2026. The complete source list, scope, limitations, and commercial-state record appear near the end of this article.
In ICT Mentorship Core Content – Month 04 – Divergence Phantoms, the speaker argues that momentum indicators are worth watching only as a window into how other traders are thinking. This article follows the recording in order and links each point to the passage it comes from.
Two limits run through it. The charts he works through are charts he is describing and annotating himself, so the article reports his readings rather than verified swing counts, prices or fills, and nothing here is a data-backed test. And the transcript is an automatic speech-to-text rendering of the audio rather than a checked caption track, so the renderings that are genuinely ambiguous are flagged near the end instead of being silently corrected.
Why ICT Treats Momentum Indicators as Secondary
He opens by saying he does not teach much about indicators because they are mathematically derived and measure the past (0:47). That is the whole of his objection, and he states its consequence later in the lesson: indicators have no bearing on what the market does next, because price has no awareness of them (1:37).
His alternative is the market-efficiency frame he says he has used since the start of the mentorship: liquidity is either engineered or neutralised depending on whether participants are willing or unwilling, and market makers can draw traders in or push them out and then take the other side of the move (1:45).
He is careful about how far he takes this. His stated use for an oscillator is contrast – if he can see what an indicator-led trader is likely to be concluding, that tells him where the opposing orders probably are (10:20). He also notes that the funds and banks he names are not reading stochastics; they are interested in where buy stops and sell stops are resting, and they attack liquidity at the fund level (9:11, 9:21).
Two ICT Divergence Types and Their Origins
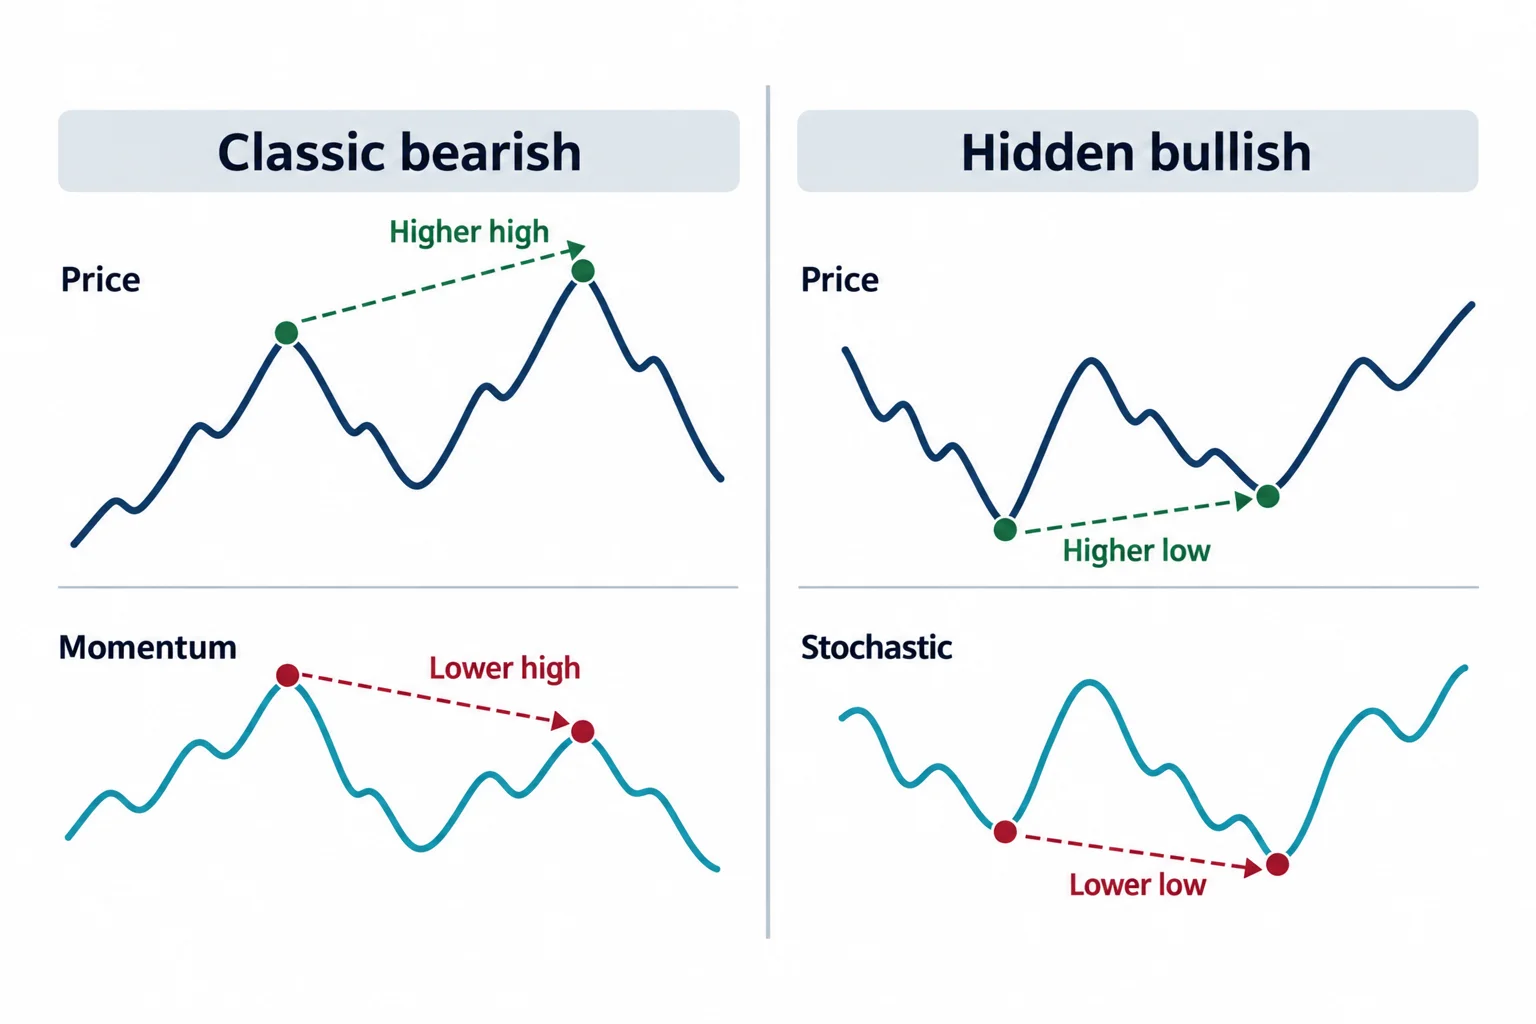
He splits divergence in two. Type 1 is the classic pattern: a higher high in price without a higher high in momentum, which he calls type 1 bearish divergence, and its mirror, a lower low in price with a failure to go lower in the oscillator, which is type 1 bullish (2:39, 2:49). Type 2 is what he calls trend following, and is commonly known as hidden divergence: a higher low in price while the stochastic cycles down to a lower low (3:01, 3:55).
He also uses the lesson to correct an attribution he feels strongly about. He says George Lane gets credit for the stochastic and for divergence, and that he was neither the creator of the stochastic nor the inventor of divergence (3:22, 3:26). He credits the release of the idea to the trading community to Nick Van Nuys (3:16). This is the speaker’s own claim about the history of the field; the recording presents no evidence for it, and it does not change how the two patterns are read.
Before the charts he adds a condition that indicator teaching usually leaves out. Having listed the familiar four – overbought or oversold, each with a bearish or bullish divergence (5:02) – he says there is a fifth: whether it is a time to be trading at all, because there are stretches where markets simply consolidate (5:24, 5:31).
Bearish ICT Divergence and the Phantom Trap
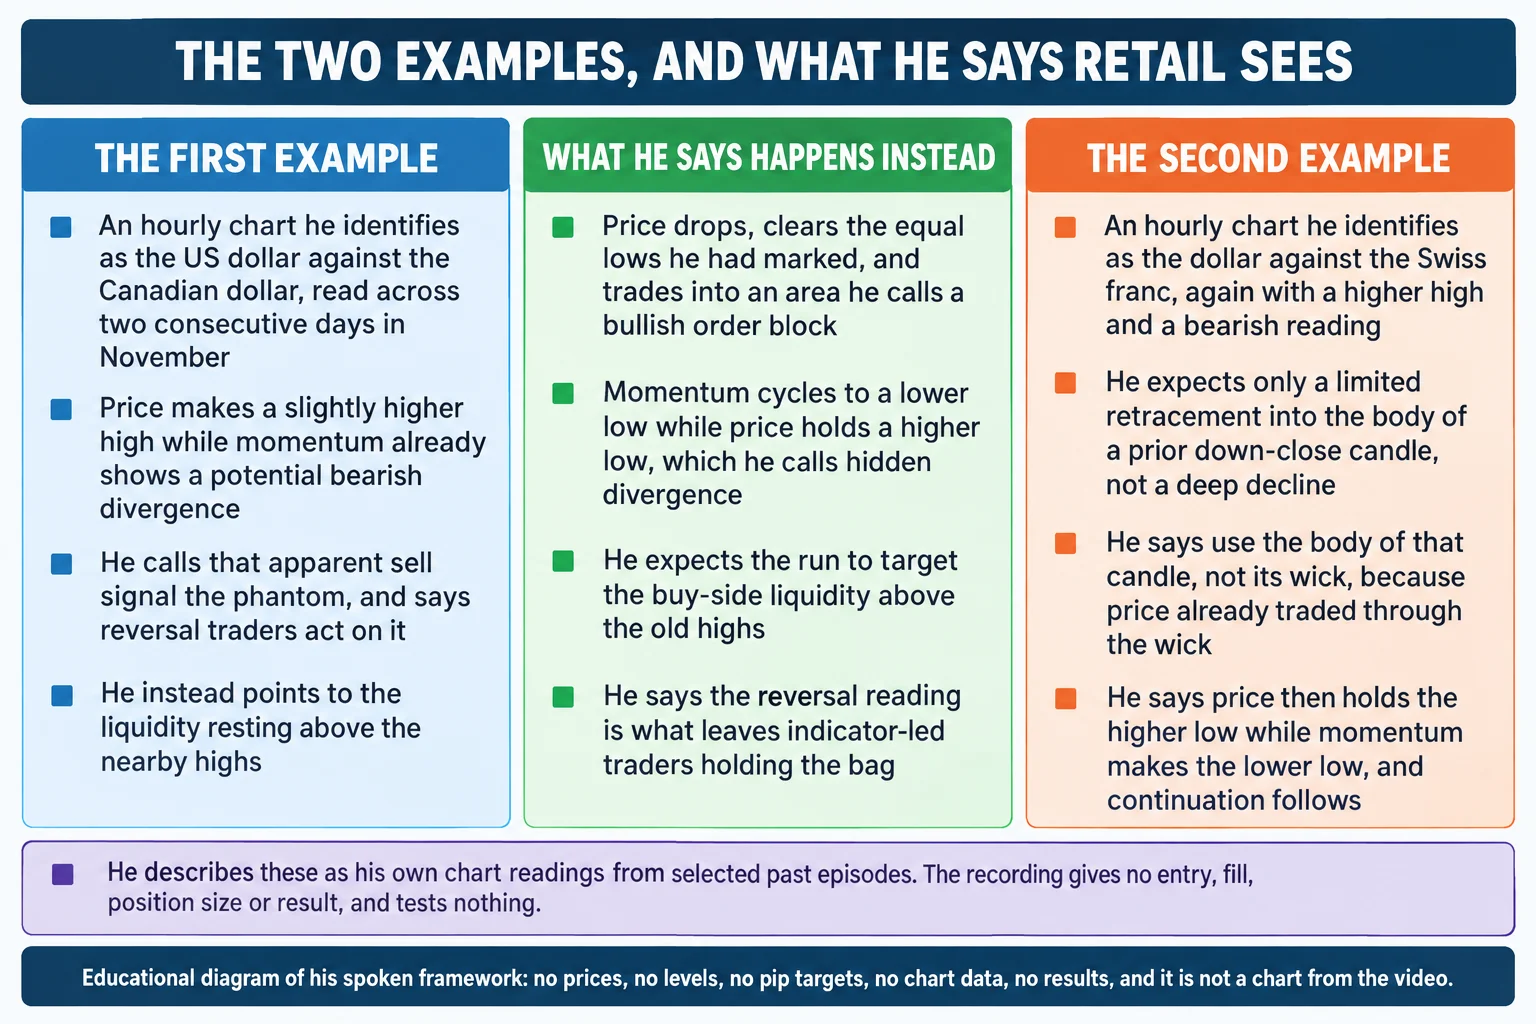
The first chart he identifies as the US dollar against the Canadian dollar on an hourly timeframe, marked up on 10 and 11 November, and he begins from a slightly higher high in price while momentum was already showing a potential bearish divergence (2:15, 2:19, 2:27).
His reconstruction of the retail reading is that this is a sell: price made a higher high and the oscillator did not, which is the textbook signal. He says he traded that way himself when he started in 1992 (6:04), and he names the problem with it – there is liquidity sitting above the nearby high, and price is too close to those levels for them not to be run (6:10, 7:31).
What he says happened instead: price dropped, cleared the equal lows he had marked, and traded into an area he calls a bullish order block (6:40, 6:47). He adds a second reference inside that candle, the range from its high down to its open and the midpoint of it, which he treats like a mean threshold (7:07). So the two sides read the same candle in opposite directions: indicator-led traders treat the divergence as confirmation of lower prices (7:15), while price-action traders treat the delivery into those lows as a buy (7:21).
Then he shows the pattern that reverses the signal entirely. Price makes a higher low while the stochastic makes a lower low (7:57, 8:02). In his reading that higher low, with momentum cycling lower, is the pattern in conflict with the reversal traders – he describes it as arm wrestling with the people who are looking at the bearish divergence (8:22) – and his stated expectation is that price runs the liquidity above the old high rather than rejecting from it (14:06).
He is explicit that this is not a claim that divergences fail. What he disputes is the mythology that tops and bottoms can be picked with an indicator at all, and he concedes that historical charts contain profitable and unprofitable examples of that approach (8:27). His narrower argument is that an oscillator output says nothing about where the actual orders are in the marketplace.
How ICT Divergence Phantoms Trap Both Camps
He frames the same chart as two camps. One sees the higher high and the move lower and concludes it caught a top; the other is looking for the liquidity above (10:58). His stated reason for expecting price to come back down before going higher is mechanical: the market wants the sell stops resting below those lows, so that the orders being offered there can be bought (11:49).
That is why he calls the momentum low the real divergence in his framework: he expects momentum to cycle down and take the sell stops while price refuses to make a lower low, and then price to run for the orders it is actually reaching for (12:14, 18:37). He also says the oscillator does not have to reach oversold for this to matter – only the cycle down is required.
He puts a cost on the error for the other side: a trader who takes the sell signal might get thirty pips or so in their favour, but he says that trade is not taught to hold for just that (12:42), and in the first example he states that the people who looked for that bearish divergence were left holding the bag (14:16). He offers this as his own account of how the pattern traps traders, not as a measured result.
ICT Divergence in the Dollar Swiss Price Chart
The second chart he identifies as the dollar against the Swiss franc, hourly, with price having rallied into what he also reads as a type 1 bearish divergence and the stochastic crossing down (14:22, 14:33, 14:47).
Again he lays out the retail expectation first: a top, with price trading down to two prior support levels – the second of which he locates inside the range of the last down candle before the advance (15:54, 15:58). He then answers a question he attributes to a viewer about whether to use the whole candle or its body, and says to use the body, because price has already traded repeatedly through the wick while the advance only started from that point (16:14, 16:18).
That gives him a bounded expectation rather than a reversal: price may dip into 96.45 to 96.40, but he says that low should not be violated, while the oscillator does make a lower low than its previous one (17:08, 17:22). He states a long around 96.45 with an exit around 97.08 (18:14, 18:19), and he points to the low of the candle at 96.45 and the reaction afterwards as the demonstration (18:45, 18:57).
He then extends the target using order-block logic and the equal highs he has marked, at 97.60 and then 97.28, and says price runs through both (19:41, 19:51, 19:57). Read as he presents them, those are retrospective observations on a saved chart, not fills or a realised result, and the recording gives no position size, stop, risk figure or outcome for either example.
ICT Lessons on Momentum and Price
The summary he offers is that these were examples of divergence phantoms, where a trader looks for one thing to happen and the opposite unfolds (20:01). He then repeats the structure once more: another bearish divergence and the expectation that price simply goes higher and gives a sell only after one further push (20:28, 21:10).
His closing instruction is not to abandon indicators but to use them only for the contrasting view of what indicator-led traders are thinking, alongside a reading of institutional order flow that suggests the opposite, which he says is where the edge would be (21:25, 21:36, 21:44).
Limits of These ICT Divergence Claims
Nothing in the recording is tested. There is no backtest, no sample of trades, no win rate and no verified profitability for either pattern described here, and the levels and reactions are the speaker’s own annotations on selected historical charts. The causal story he tells – that stops are harvested and that funds trade on liquidity at the fund level – is his interpretation of why price behaves as it does, and the transcript cannot establish who was trading or why. Treat the whole lesson as one trader’s framework for reading a chart, not as evidence that divergence phantoms can be traded profitably.
The transcript is also audio only. It records what he said while pointing at charts, not what the charts showed, so the candle counts, the equal lows, the order block and the 96.45, 97.08, 97.28 and 97.60 levels are reported here exactly as he described them and were not independently verified against any chart.
ICT Divergence Video Date and Identity
The upload date and the lesson date are not the same thing, and it is worth keeping them apart. The YouTube watch page shows the recording published on 10 September 2022 and running about 21 minutes 52 seconds, while the recording itself introduces its content as teaching seven of eight of the December 2016 mentorship (0:35). The examples are drawn from then-recent hourly charts he dates to 10 and 11 November, which he says nothing about being future-dated.
ICT Divergence Phantom Transcription Notes
This article was written from automatic speech-to-text of the original audio, not from a checked caption track, so a few renderings in the source are ambiguous and are flagged rather than silently corrected. He refers to large banks, and the transcription renders part of that passage as “UBS credit Swiss this city” (9:09); the firms meant cannot be established from the audio alone. A phrase rendered as “institutional overflow” (18:41) sits where institutional order flow is being described, and “Strength following in nature” (14:06) sits in the middle of his description of trend-following divergence. The name he credits, Nick Van Nuys, is also transcribed as “Nick Van Nice” in one place (3:53). Where the meaning was clear from context the normal spelling of the term is used in this article; where it is not, the ambiguity is left in place.
Watch the ICT Divergence Phantom Recording
ICT Mentorship Core Content – Month 04 – Divergence Phantoms
The Inner Circle Trader · published to YouTube on 10 September 2022 · listed at 1313 seconds, about 21 minutes 52 seconds. The recording identifies its content as teaching seven of eight of the December 2016 mentorship. This video is the primary source for every timestamp link above.
The recording is not embedded here because the video owner has disabled playback on other websites. That was tested directly on 15 September 2026 from a BestProps page origin at both desktop and mobile widths: the embedded player loads and then reports “Playback on other websites has been disabled by the video owner”, with no playable stream and no duration reported in either case. The link above opens the recording on YouTube itself.
ICT Divergence Phantom Resources
These are the sources checked for this article. The Investopedia entry is the general definition of divergence in technical analysis that the lesson’s type 1 pattern follows, and the CFTC advisory is the regulator’s own note on risk and fraud in the retail forex market the examples are drawn from. Neither assesses this speaker or tests anything he says. Any ICT, smart-money or third-party indicator, script, note set, transcript pack or re-upload circulating outside the publishing channel’s own page is unofficial and untested here.
- [1] ICT Mentorship Core Content – Month 04 – Divergence Phantoms The Inner Circle Trader (primary source; watch page and metadata read 15 September 2026, published 10 September 2022, listed at 1313 seconds).
- [2] The Inner Circle Trader (official YouTube channel) (read 15 September 2026), the publishing channel for the ICT mentorship series this lesson belongs to.
- [3] Investopedia: Divergence Explained: A Guide to Technical Analysis (read 15 September 2026), general definition: divergence occurs when price and a technical indicator move in opposite directions. Background on the conventional pattern the lesson contrasts itself with; it contains none of the lesson’s charts and endorses nothing here.
- [4] U.S. Commodity Futures Trading Commission: Fraud Advisory: Foreign Currency (Forex) Fraud (read 15 September 2026), the regulator’s statement that the forex market is volatile and carries substantial risks. Context for the risk side of the two examples above; it is not a comment on this speaker or this method.
Source: ICT, ICT Mentorship Core Content – Month 04 – Divergence Phantoms, The Inner Circle Trader, published 10 September 2022; the recording identifies its content as teaching seven of eight of the December 2016 mentorship and discusses November charts. Captions were not available, so the transcript is automatic speech-to-text of the original audio under SHA-256 e3ed7d8c3199f32e21a6c52b068b6544139b8a2d1339d7dd70a6e39fe95e1639. Educational write-up of the speaker’s own framework; it is not trading advice, and no pattern, reading, level or setup described above has been tested or verified here.