
Key takeaways
ICT presents breaker blocks as retracement areas identified after price runs an old swing and then breaks an intervening swing in the opposite direction.
Read the full summary
ICT presents breaker blocks as retracement areas identified after price runs an old swing and then breaks an intervening swing in the opposite direction. In the bullish version he describes: a short-term low is violated and the sell stops beneath it are taken, price then breaks the short-term high sitting between the two lows, and a later return to that old high is read as support. The bearish version mirrors it: an old high is run, the swing low formed between the two highs is broken, and a later return to that low is read as resistance. He attributes the reactions to mitigation — traders caught on the wrong side unwinding and repositioning — and argues the level needs that structural storyline rather than a bare horizontal line. He also says he uses the entire range of the highest up-closing candle before the drop rather than one exact price. The lesson states no fills, no sizes, no results and no test, so the order-flow explanation and every anticipated reaction remain his interpretation.
How we researched this article
BestProps used document-based research from primary firm sources, checked September 24, 2026. The complete source list, scope, limitations, and commercial-state record appear near the end of this article.
In ICT Mentorship Core Content – Month 04 – ICT Breaker Block, ICT explains a breaker as a price area identified after a prior swing is breached, price shifts structure in the opposite direction, and the market retraces toward the intervening swing. The lesson presents bullish and bearish versions of the pattern.
He frames it at 0:21 as a form of mitigation used to highlight a trade setup. The central idea is not simply to label an old high as support or an old low as resistance. ICT argues that the level needs a supporting sequence: a run beyond an earlier swing, a decisive reversal through an intervening swing, and then a return to the area associated with that structural break. This is ICT’s interpretation of price action, not proof that the setup offers a reliable trading edge.
How an ICT Breaker Block Works
ICT introduces the bullish sequence by asking the viewer to imagine price forming a short-term low and then trading beneath it into support. He describes that initial move below the low at 0:44 as a possible false break, or what he calls a “turtle soup” long scenario. The area below the low is interpreted as containing sell-stop liquidity.
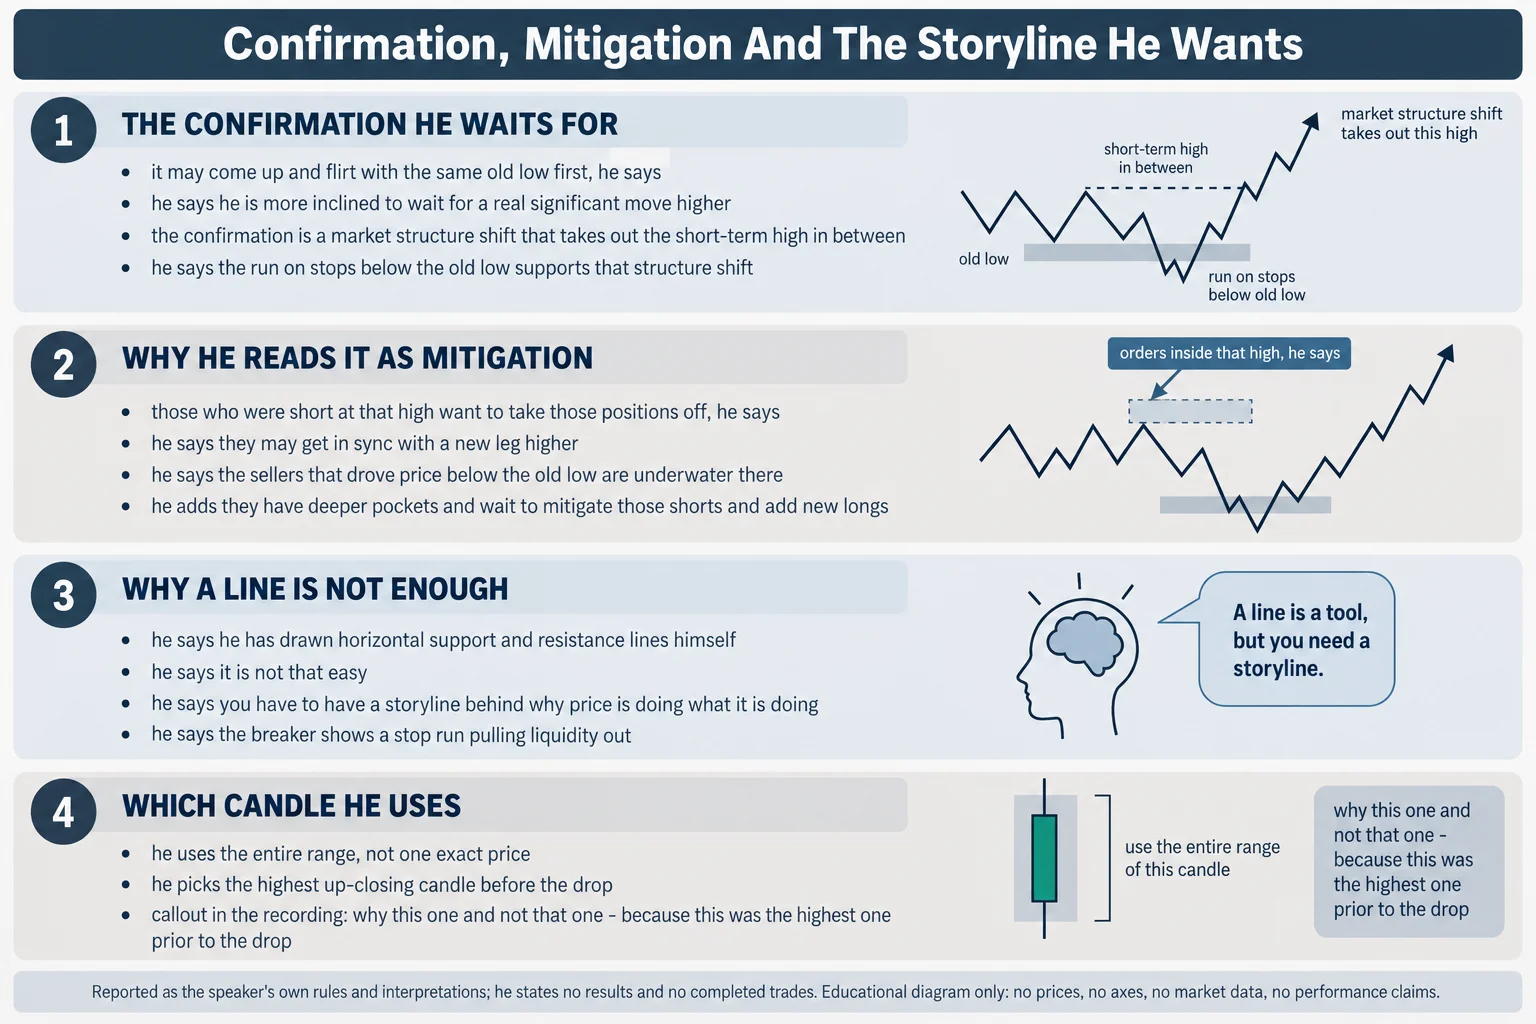
A move back above the breached low alone is not enough. At 1:08, ICT says price may initially “flirt” with the same old low and hint at it acting as resistance, and that he is more inclined to wait for a real significant move higher. In the bullish example, confirmation arrives as what he calls a market structure shift: price takes out the short-term high situated between the two lows, and he says that high is what he focuses on. A later retracement toward that old high is then treated as potential support, on the reasoning that orders inside that high are looking to be mitigated.
In simplified terms, the framework has three stages:
- Price trades beyond a previous swing, which ICT interprets as a run on stops.
- Price reverses and breaks the intervening swing in the opposite direction, creating what the lesson calls a market structure shift or break.
- Price retraces to the relevant swing area, which is classified as the breaker and considered a possible setup location.
He restates the bullish logic at 2:29: focus on the high in between the two lower lows, and treat that broken high as a resistance level that becomes support — which he calls a bullish breaker.
Bullish ICT Breaker Block Setup
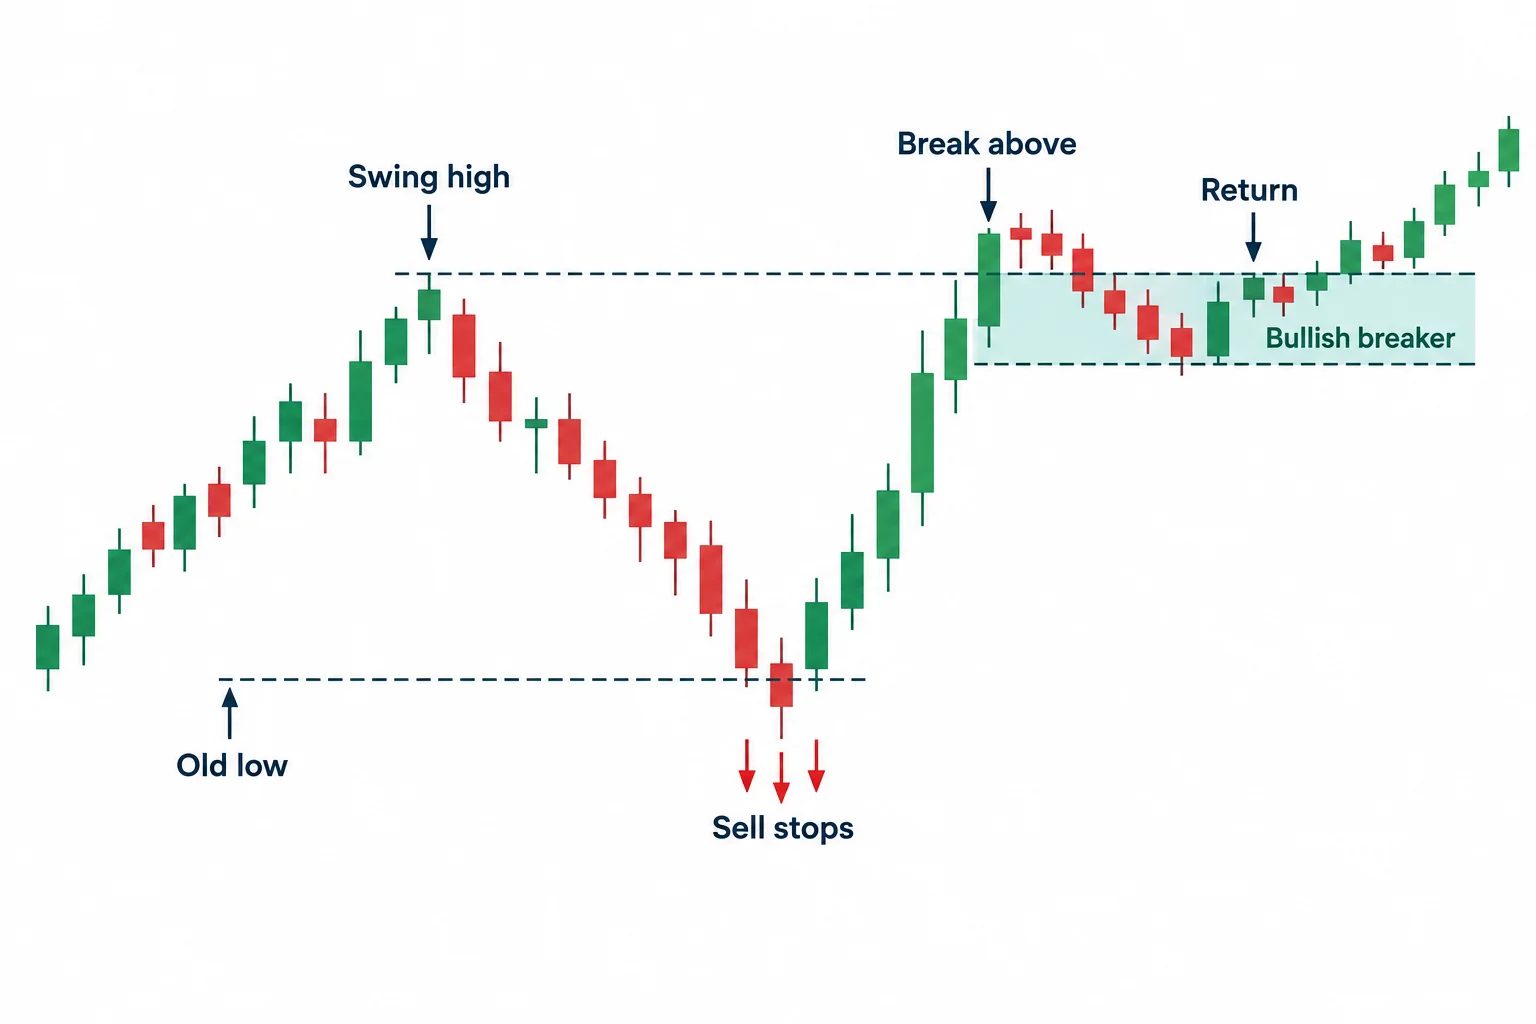
ICT summarizes the bullish construction at 5:08. He defines it there as a bullish range or up-closing candle in the most recent swing high prior to an old low being violated. The sellers who sold that low and later see the same swing high violated will look to mitigate the loss, and when price returns to the swing high he treats that as a bullish setup worth considering.
His worked description: an old low is violated, taking out the sell stops below it; the swing high is where the bullish breaker is expected to sit; price must then break through that swing high to confirm a run on stops has occurred; and as price trades back down to that swing high, he describes buying it in expectation of mitigation. He then anticipates range expansion to the upside.
His explanation for the reaction is mitigation. At 6:05 he says those who sold and drove price below the old low are underwater there, that they want to take those positions off and add more longs, and that the sellers have deeper pockets and will wait for price to reach an area where they can mitigate those shorts and add new longs. That order-flow narrative is ICT’s market interpretation; the transcript does not independently establish who held positions or which orders were executed.
Bullish Breaker Setup Checklist
- An identifiable old low is breached and the sell stops beneath it are taken.
- A short-term high exists between the two lows, and it is the focus point.
- Price expands upward through that intervening high, which he reads as the market structure shift.
- The broken swing high becomes the area monitored on a retracement and is read as support.
- The anticipated scenario is continuation upward, although no outcome is guaranteed.
At 7:21 the video moves to what ICT describes as real price action: an old low, price trading below it and punching through it again, then a rally he reads as the market structure shift after sell-side stops were taken. He repeats that any retracement from that point is viewed as a new buying opportunity when price trades back into the old swing high. Because the source is an audio transcript rather than a verified capture of the chart, exact instruments, prices, candle boundaries and later results cannot be recovered from the text alone.
Bearish ICT Breaker Block Setup
Contrarily, ICT describes the bearish case at 2:47: when the market trades higher and takes out an old high, and then breaks below the low that made that new high, that area becomes the focus and he views it as a bearish breaker.
His more detailed bearish explanation begins at 3:06. In his terminology the relevant breaker is a bearish range or down-closed candle at the most recent swing low prior to an old high being violated. The buyers who bought that low and later see the same swing low violated will look to mitigate the loss, and when price returns to that swing low he treats it as a bearish setup worth considering.
He walks the sequence: an old high is traded through and rejected, running the stops above it so those buy stops are neutralised; attention goes to the swing low formed between the two highs; a market structure break is seen; and the return to that swing low is the bearish breaker. From there he looks for another low to form with a new leg lower.
At 4:20 he names what he calls the salient points: an old high being run out or a false break above an old high; the raid on buy stops interpreted as buyers being trapped long; and a quick repricing lower after those buy stops are taken, which he treats as confirmation that a new breaker may be forming. He adds that once market structure is broken down, all future retracements are viewed as new selling opportunities, especially when price trades back up to that low.
Bearish Breaker Setup Checklist
- An identifiable old high is breached and the buy stops above it are taken.
- A swing low forms between the relevant highs, and it is the focus point.
- Price repricing lower and breaking below that intervening low supplies the structural confirmation.
- The old swing-low area is monitored during a retracement and is read as resistance.
- The anticipated scenario is continuation lower, subject to failure like any price pattern.
Why ICT Breaker Block Context Matters
Near 8:38, ICT contrasts breaker analysis with simply drawing a horizontal support or resistance line. He says he has drawn those lines himself, that it is not that easy, and that you have to have a storyline behind why price is doing what it is doing. In his reading, the breaker indicates a stop raid pulling liquidity out: he says to find the short-term low that was violated and the short-term high that recently formed, and that when price trades back down to it, that will in fact be a support level he considers highly probable for bullish prices.
The lesson also states that he uses a candle’s entire range rather than necessarily treating the breaker as one exact price. At 9:16, discussing the bullish chart, he selects the highest up-closing candle before the drop and says he is using its entire range, explaining that this one was chosen because it was the highest one prior to the drop. The chart itself was not available for visual confirmation here, so the exact candle selection remains dependent on ICT’s on-screen illustration.
Key ICT Breaker Block Takeaways
The most useful way to study this lesson is as a conditional sequence rather than as a standalone candle label. Mark the old swing, locate the intervening swing, wait to see whether price breaks structure after moving through the old extreme, and only then identify the possible retracement area. Reviewing historical examples may help clarify the terminology, but retrospective pattern recognition does not demonstrate profitability or predict future movement.
This summary is educational and reflects ICT’s explanation in the cited video. It is not investment advice, a recommendation to trade, or a promise of performance.
Watch The Original Recording
ICT Mentorship Core Content – Month 04 – ICT Breaker Block
The Inner Circle Trader · watch page lists upload 8 September 2022 · 601 seconds, about 10 minutes 1 second; the lesson belongs to the Month 04 mentorship block. This recording is the primary source for every timestamp link on this page.
The recording is not embedded here. An embedded player was tested directly on 15 September 2026 from a BestProps page origin at desktop and mobile widths: the frame loads and then reports “Playback on other websites has been disabled by the video owner”, with no duration and no playback progress, while the video itself plays normally on YouTube. No half-working player is left on this page.
The watch page was read on 15 September 2026 and is publicly listed as ICT Mentorship Core Content – Month 04 – ICT Breaker Block by The Inner Circle Trader, with an upload timestamp of 8 September 2022, not private and not unlisted, and a listed duration of 601 seconds — about 10 minutes 1 second, against a transcribed audio duration of 600.2 seconds. The upload date and the Month 04 session the lesson belongs to are different dates; they are kept distinct here rather than presented as a contradiction.
Resources
These are the sources checked for this article. The regulator and investor-education pages are general material on assessing trading systems sold to the public and on short-term trading risk. None of them evaluates this speaker, and none of them verifies the breaker construction, the intervening swing, the mitigation reading or any level discussed above. Any ICT, smart-money or third-party indicator, script, note set, chart annotation, transcript pack or re-upload circulating outside the publishing channel’s own page is unofficial and has not been tested here.
- ICT Mentorship Core Content – Month 04 – ICT Breaker Block — The Inner Circle Trader (primary source and the recording transcribed for this article; watch page read 15 September 2026, listed duration 601 seconds).
- The Inner Circle Trader — official YouTube channel (read 15 September 2026) — the publishing channel for the mentorship series this lesson belongs to.
- CFTC — Commodity Trading Systems Sold on the Internet (read 15 September 2026) — the regulator’s guidance on assessing trading systems sold to the public, including its warning that hypothetical results are typically simulations calculated over prices that occurred in the past.
- Investor.gov (U.S. SEC) — Day Trading (read 15 September 2026) — the regulator’s definition, which states that day trading is extremely risky and can result in substantial financial losses in a very short period of time. Relevant to a lesson built on short-term stop raids and retracements.
A Note On The Transcription
There was no usable caption track for this recording, so the transcript behind this article is an automatic speech-recognition pass over the full original audio, not human-verified captions and not YouTube’s own captions. The pass covered the complete audio, reported no low-confidence characters and a maximum level of -5.9 dB, and returned a duration of 600.2 seconds against the watch page’s listed 601 seconds. Because the text is machine-recognised, terms were checked against context rather than trusted as printed: the passage rendered as “this rate on buy stops” is read here as this raid on buy stops, and “the rate on sell stops” as the raid on sell stops, since both are described as taking out stops at an old extreme, and “recapitalizes” is read as recapitulates in his sentence about sellers being underwater. The charts themselves were not available to this review; only the spoken description was.
Source: ICT, ICT Mentorship Core Content – Month 04 – ICT Breaker Block, The Inner Circle Trader, 8 September 2022. Educational commentary, not investment advice. The breaker sequence, the intervening swing, the mitigation reading and the anticipated reactions are the speaker’s stated framework and interpretations, reported with no fills, no order sizes, no costs and no account results, and the chart levels and candle selections he narrates were not independently verified.