
Key takeaways
ICT Mentorship Core Content Month 03 teaches timeframe selection and setup definition by matching monthly charts to position trading, weekly charts to swing trading at typically one or two trades per three months, daily charts to short-term trading, and four-hour or lower charts to day trading, with intraday exits by 2 p.m.
Read the full summary
ICT Mentorship Core Content Month 03 teaches timeframe selection and setup definition by matching monthly charts to position trading, weekly charts to swing trading at typically one or two trades per three months, daily charts to short-term trading, and four-hour or lower charts to day trading, with intraday exits by 2 p.m. New York time. ICT recommends starting with the daily chart even for aspiring day traders because it combines higher-timeframe direction with near-term liquidity, stop, fair value gap and liquidity void references, while traders who find it too fast should move to weekly. Setup choice should fit patience, aptitude and life rather than imitate the mentor. The top-down process uses a monthly directional premise, weekly refinement, and a daily range between a known high and low graded with Fibonacci levels. ICT’s three current setups are pullbacks into an exposed known range, bearish order blocks, and turtle soup stop runs or false breakouts above previous highs in line with higher-timeframe bias. The monthly example describes roughly 2,000 pips over four months, about 20 trading days and four weekly candles per monthly bar, more than 13 months for setup formation, and about six months for the move. Short-term weekly-range trades are held roughly one to five days. The 49 minutes 25 seconds YouTube lesson was published on 31 August 2022 and is the first of eight teachings in the mentorship’s third month, but it provides no verified fills, account results, win rate, risk, expectancy or profitability evidence.
How we researched this article
BestProps used document-based research from primary firm sources, checked September 25, 2026. The complete source list, scope, limitations, and commercial-state record appear near the end of this article.
What ICT Timeframe and Setup Teaching Covers
He opens by framing the session as the first of eight teachings in the third month of the mentorship, on timeframe selection and defining setups for your model (0:36). Timeframe selection comes first and is treated as vocabulary: which chart he associates with which kind of holding period. Defining setups comes second, and it is put in personal terms – what a given trader can actually recognise and wait for.
ICT Timeframe Selection by Trade Holding Period
From the 0:54 mark he pairs each chart with a holding period:
- Monthly chart – position trading. He says it suits traders he calls intraday intolerant, meaning people who cannot work in lower timeframes, and he adds that the monthly chart still does a great deal for their analysis (1:00).
- Weekly chart – swing trading, which by his own definition is typically one or two trades within a three-month period, and which he says takes a great deal of patience because the setups form slowly (2:56).
- Daily chart – short-term trading. He calls it the best chart there is and says it gives the best of both worlds, a long-term perspective alongside the near-term levels he says banks would be interested in (4:21).
- Four hours or less – day trading. He says he will not teach it here because its concepts are inherently tied to time of day, and that the focus of this session is what each timeframe is used for (7:08).
He is explicit that this is a description of his own preferences rather than a ranking. At 1:52 he says he is not a long-term trader and does not have the personality to hold a position that long, which is why he places position trading first in the list while not trading it himself. He later describes his own defined setups as sitting on a timeframe lower than the daily chart (14:59).
Why the Daily ICT Timeframe Is the Starting Point
His case for the daily chart is that it carries higher-timeframe context without going as far back as the weekly or monthly, while still showing the levels he says institutions care about: areas where stops may sit, a liquidity void, or a fair value gap (4:54). He says the daily chart does a very good job of suiting swing traders and short-term traders who cannot watch intraday price action (5:41).
Two qualifications come with it. First, he says if the daily chart feels too fast or creates too much emotional reaction, the answer is to move up to the weekly chart rather than to force it (6:25). Second, his counsel to students is to start on the daily chart even if they know in their heart they want to day trade, because he treats it as a bellwether that supplies the higher-timeframe reference points and the directional bias (19:43). He adds that the hard part is not finding that bias but trusting it (20:25).
Defining Your Own ICT Trade Setup
The second half of the teaching starts at 7:38, where he says his goal as a mentor has never been to produce a copy of himself. He gives a concrete example of why fit matters: a four-hour turtle soup sell into a daily bearish order block may be a setup a given student simply cannot wait for, while the same formation on a weekly turtle soup into a monthly bearish order block may form too rarely for that student (8:36).
He says a trader’s bread-and-butter setup is applicable across all of these timeframes once it is understood, and that the timeframes are what make the selection personal. What has to align, in his words, is patience, aptitude and life – including whether a person can be in front of the charts to do the analysis and to execute on it (9:38). He says he does not expect students to learn every tool, and describes his own progress as moving from indicators to a model built on institutional order flow and price action, where setups had criteria he could define objectively (11:14).
He then names models rather than one system: a trend trader using only the monthly and weekly direction (13:11), a swing trader trading the daily intermediate-term price action (13:59), and short-term trading of weekly ranges (17:06) held for roughly one to five days (17:17). Day trading, he says, is intraday swing trading with exits by 2 p.m. New York time, and it is placed outside this teaching (17:22).
He is also careful about not universalising his own answer. He says his preference for faster turnover is his own pursuit, tells the listener not to be talked into it, and says it is not about the setups or the timeframe but about the alignment between the two that produces a workable middle ground for that person (18:47, 18:53).
An ICT Timeframe Setup With a Monthly Premise
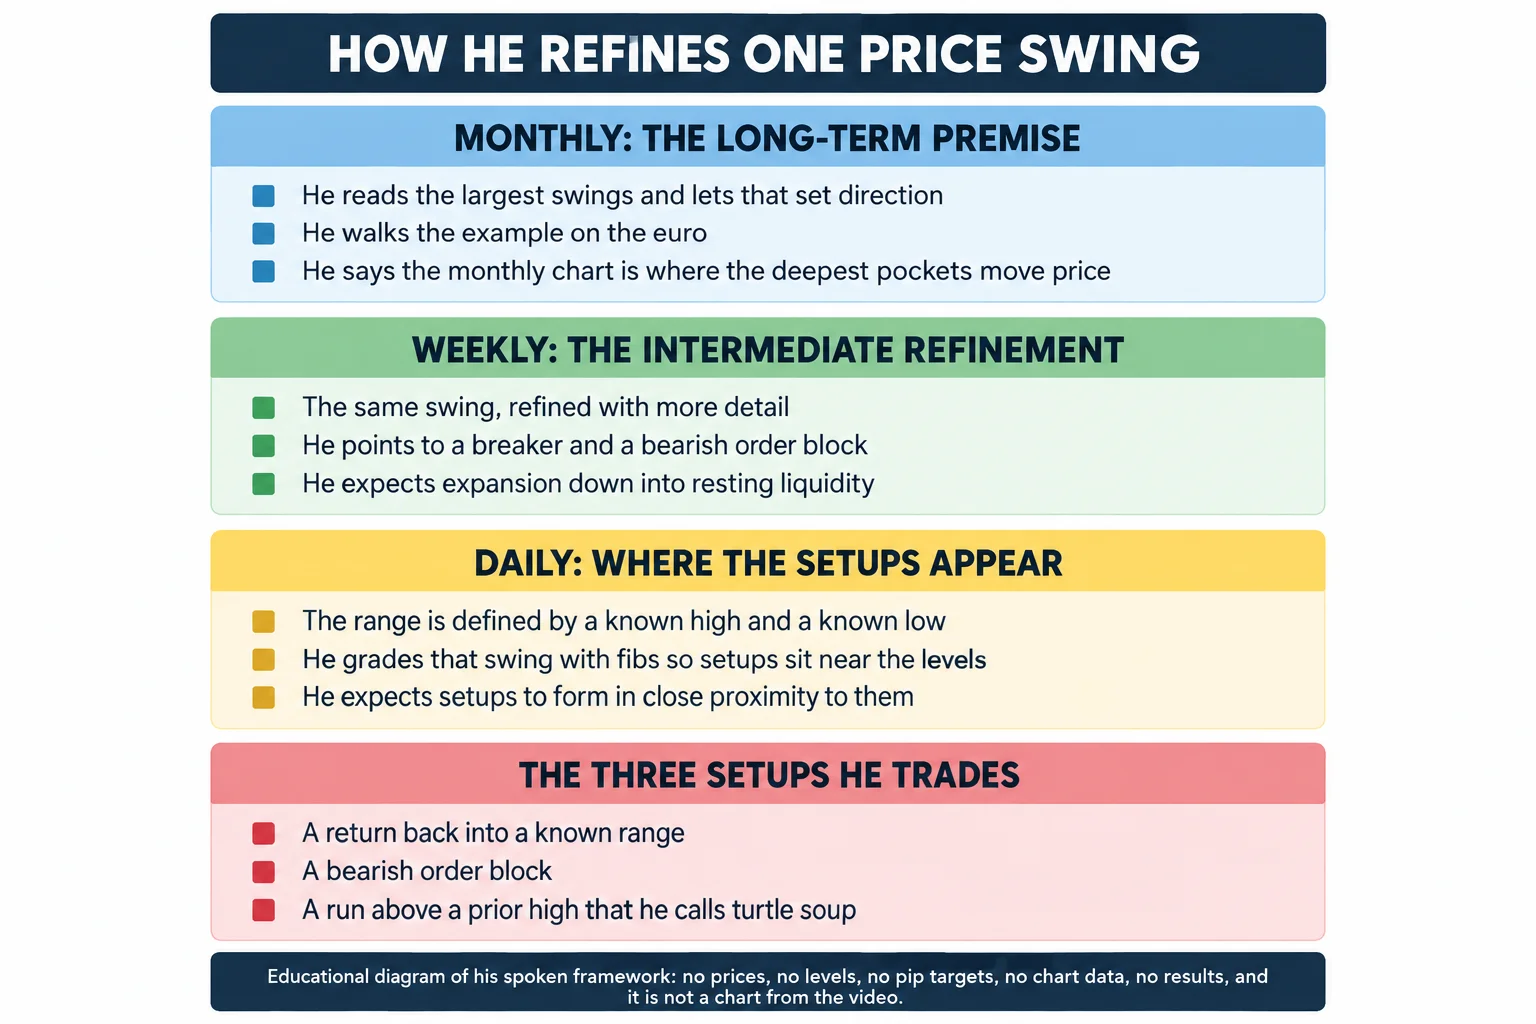
At 20:38 he begins a chart walkthrough. He describes the monthly chart as the long-term price action reference for the largest swings, with setups that unfold over many months rather than appearing as short blips, and he argues that trading in the direction of the most recent monthly setup can yield the lowest risk because the timeframe itself leaves time to participate (20:41, 21:20).
In the walkthrough he narrates a consolidation followed by a breakdown on a monthly basis, and says the move he is pointing at covered a couple of thousand pips over roughly four months (22:39, 23:40). He explains how to read a monthly candle – high, low, open and close for that month – and notes that each monthly bar covers roughly twenty trading days, with about four weekly candles inside it, which is the basis of his seed analogy for higher timeframes (24:11, 24:41, 25:42).
He then applies it: price moves away from a consolidation with magnitude, he identifies the up candle that he says smart money sold into, and he defines the trade by that candle’s low – the level he calls a bearish order block – with the return to it taking over a year to arrive (27:20, 28:29). He says he expects price to return to that level, and then asks where it would go next, answering that below the lows in the example there would be sell stops belonging to long-term trend-following funds (31:38, 32:03). He describes the setup phase as over thirteen months and the move itself as about six months, and says he could not personally hold a position for that long even though he can use the idea (32:46, 34:32).
He is deliberate about scale here: he says the monthly chart is no different from what he does on a fifteen-minute, hourly or daily chart, the difference being the size and duration of the swing (30:54). The visuals behind this narration – the actual candles, the exact levels and any execution – are not verifiable from the audio, and this article does not assert them.
Refining the ICT Trade Setup on Weekly and Daily Timeframes
At 35:47 he moves to the weekly chart and calls it the intermediate-term reference. He points to a down candle that he labels a breaker, explaining that it broke an old high and ran stops, and then to a bearish order block that offers another selling opportunity with expected expansion down into resting liquidity (36:20, 37:01).
At 37:23 he refines it once more onto the daily chart. The range, he says, is defined by a known high and a known low – the high where the monthly bearish order block was, the low at the equal lows being targeted – and he lays a fib across those two reference points to grade the swing so that new setups can be anticipated near those levels (37:53, 38:12). He notes that the range was known before the move traded, and that the returns back into equilibrium and into the void repeat, with the last of them described as the terminus of the move (38:51, 39:08).
Three ICT Trade Setups in His Own Model
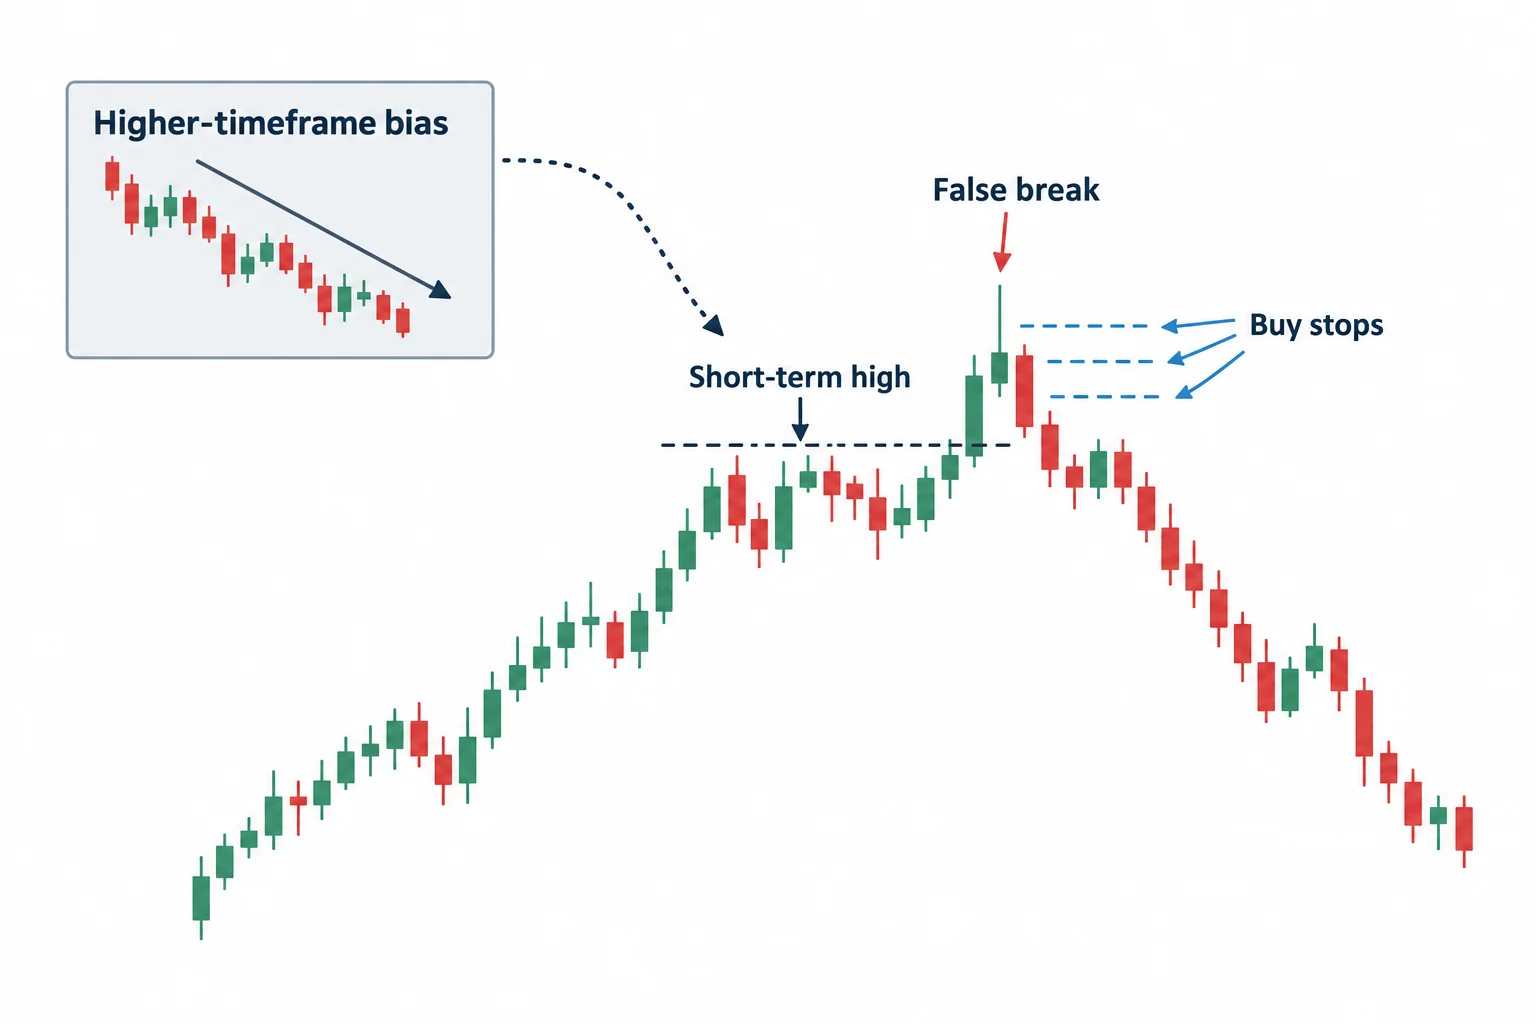
From around 39:36 he lists what he describes as the ICT-camp approach: optimal trade entries as a simple return back into a known range, order blocks, and stop runs he calls turtle soup or false breakouts. He says the return-into-range idea is the only indicator-based construct he likes, and that it rests on fibs and a return into a known open range (40:31).
He illustrates the stop run on the daily chart: buy stops resting above a short-term high, price running above it and then accelerating lower, which he explains as absorbing buy-side liquidity to pair orders (40:37, 41:05). He calls this kind of false break above an old high, in the direction of a higher-timeframe premise, a “holy grail setup” for him (41:50) – that is his characterisation, not a measured result. He adds the condition that the higher-timeframe bias has to be known first and held until price shows it is wrong (42:26).
Then he narrows his own list to three: trading inside a range on a pullback into an exposed range, selling at a bearish order block, and selling short into a run above a previous high where sell stops are resting (45:20, 45:04, 45:47). He says he does nothing outside those three today, that he could reduce the list to one, and that he looks for them every day because he likes a lot of action (48:19, 48:45).
His closing advice to a student who cannot read order blocks or stop runs reliably is to take whichever of the three they can see clearly and master that one, and he says those three patterns exist in all timeframes (46:42, 47:12). He ends by saying that once those characteristics in price action are understood nothing evades the trader – reversals, trend-following pullbacks or expansions out of consolidation (48:56).
What This ICT Timeframe Model Does Not Claim
The recording is a framework walkthrough, not a test. It contains no fills, no statement of which setups were taken, no account figures and no realised outcome, and nothing in it measures the win rate, the risk or the expectancy of any of the three setups. The orders-of-magnitude figures he narrates – a couple of thousand pips over roughly four months, a setup phase of over thirteen months – are his descriptions of a chart he is looking at, and they are reported here as narration, not as verified market data.
The statements about smart money, banks, institutions, long-term funds and resting stops are his interpretation of how markets work. The recording does not evidence them, and they should not be read as established fact. The one-to-five day and quarterly frequencies are his own working definitions, not measured statistics. Nothing here is a recommendation to copy a trade or a claim of profitability.
ICT Model Date Identity and Transcription Notes
The upload date and the series position are two separate facts. The YouTube watch page shows this recording published on 31 August 2022 and listed at 2965 seconds, about 49 minutes 25 seconds, while the recording introduces itself as the first of eight teachings in the third month of the mentorship (0:36). No contradiction is asserted between the two, and nothing in the audio dates the chart shown.
This article was written from automatic speech-to-text of the original audio rather than from a checked caption track, so several renderings are ambiguous and are flagged instead of silently corrected. The transcription reads “non-farm paper” where non-farm payroll is meant (24:16), and “FIV” where fib is meant (44:37). One spoken percentage at 44:39 is transcribed in a way that does not parse cleanly, and it is therefore not reproduced here. The numeric price levels he reads from the chart are transcribed inconsistently across the walkthrough, so they are described qualitatively in this article rather than quoted as levels. Where the meaning was clear from context the ordinary term is used; where it was not, the ambiguity is left visible.
Watch the Original ICT Timeframe and Setup Lesson
ICT Mentorship Core Content – Month 03: Timeframe Selection & Defining Setups
The Inner Circle Trader · published to YouTube on 31 August 2022 · listed at 2965 seconds, about 49 minutes 25 seconds. This video is the primary source for every timestamp link above.
The recording is not embedded here because the video owner has disabled playback on other websites. That was tested on 15 September 2026 from a BestProps page origin at both desktop and mobile widths: the embedded player loads and then reports “Playback on other websites has been disabled by the video owner”, with no playable stream and no duration reported in either case. The link above opens the recording on YouTube itself.
ICT Timeframe and Setup Resources
These are the sources checked for this article. The CME Group page is the exchange’s own overview of the FX marketplace, relevant because the example is a currency pair, and the CFTC advisory is the regulator’s note on trading systems sold to the public – context for reading any rule-based model of this kind. Neither assesses this speaker or tests anything he says. Any ICT, smart-money or third-party indicator, script, note set, transcript pack or re-upload circulating outside the publishing channel’s own page is unofficial and untested here.
- [1] ICT Mentorship Core Content – Month 03: Timeframe Selection & Defining Setups The Inner Circle Trader (primary source; watch page and metadata read 15 September 2026, published 31 August 2022, listed at 2965 seconds).
- [2] The Inner Circle Trader (official YouTube channel) (read 15 September 2026), the publishing channel for the Month 03 mentorship series this teaching belongs to.
- [3] CME Group (FX futures and options) (read 15 September 2026), the exchange’s own marketplace page for regulated FX trading. Background on the asset class used in the example; it contains none of the lesson’s rules or figures.
- [4] U.S. Commodity Futures Trading Commission (Commodity Trading Systems Sold on the Internet) (read 15 September 2026), the regulator’s advisory on claims made for trading systems sold to the public. Context for reading any rule-based model, including this one; it is not a finding about this speaker.
Source: ICT, ICT Mentorship Core Content – Month 03: Timeframe Selection & Defining Setups, The Inner Circle Trader, published 31 August 2022. Captions were not available for this recording, so the transcript is automatic speech-to-text of the original audio under SHA-256 04ebd930534dbb9a5ef1c2d0d074421794d2c512ce15fd7bc3ff9fdf085ed41b. Educational write-up of the speaker’s own stated framework; it is not trading advice, and no setup, rule or figure described above has been tested or verified here.