
Key takeaways
The Inner Circle Trader’s ICT Mentorship Core Content Month 03 lesson teaches a repeatable, indicator-free routine for anticipating forex setups through institutional order flow.
Read the full summary
The Inner Circle Trader’s ICT Mentorship Core Content Month 03 lesson teaches a repeatable, indicator-free routine for anticipating forex setups through institutional order flow. Mark the open, high, low and close of each monthly candle for the last three months on every pair of interest, identify the most recent down candle and an earlier up candle whose low is above that down candle’s high to define the trading range, then transfer the levels to weekly, daily and hourly charts to refine entries and risk. A down candle becomes a bullish order block after price trades above it, with a return into that candle treated as a buy area targeting the last up candle, while an up candle becomes a bearish order block when price violates its low, with the most recent down candle defining the downside range. Three narrated examples include a European pair, USDJPY and a New Zealand dollar pair. The USDJPY range is stated as 106.28 to 103.26, roughly 300 pips, followed by a claimed move of more than 300 pips toward old and equal highs. The New Zealand dollar example uses approximately 69.83 to 69.85 as a downside objective, 70.05 as a likely cover level, about 120 pips of distance and 67.80 as ICT’s personal extended target. The method is designed to identify setups before they become obvious, but all chart levels, pip counts and reactions are ICT’s own retrospective readings, the transcript is automatically generated, and the lesson provides no independent verification, trade log, position sizes, account results or test of the method.
How we researched this article
BestProps used document-based research from primary firm sources, checked September 24, 2026. The complete source list, scope, limitations, and commercial-state record appear near the end of this article.
This page covers ICT Mentorship Core Content – Month 03 – The Next Setup – Anticipatory Skill Development, a recording from The Inner Circle Trader. He identifies it near the start as the fourth teaching of eight in the November 2016 mentorship content, on anticipatory skill sets, and says it deals specifically with using institutional order flow to help find new setups 0:32, 0:43, 0:49.
One boundary matters before the detail. Everything in the three examples is his own narration of charts he is displaying: the levels, the pip counts and the described reactions are reported here as he states them, and the transcript is an automatic transcription of the audio. No chart marking, level or outcome has been independently verified, and nothing in the lesson constitutes a test of the method.
Why ICT Next Setup Starts With Monthly Charts
His reasoning for the time frame is the first thing he establishes. He says that when you look at a monthly chart the first thing to remember is that it only moves with a great deal of money behind those price swings, and that retail is not going to have it 1:01, 1:15. Big ranges on a monthly chart, he says, are the result of enormous buying or selling interest by what he calls the smart money 1:19, 1:28. From that he draws the practical conclusion: because retail cannot move price, if you can see where the large orders are most likely to be placed to buy or sell, and you can see it on the monthly chart, you stand to make a great deal of pips without having to trade a lot 1:34, 1:41, 1:44.
That claim (that a monthly swing is necessarily the footprint of large institutional orders rather than the aggregate of many participants) is his interpretation of how price is delivered. It is the premise the rest of the lesson rests on, and it is presented here as his view rather than as an established fact.
The ICT Next Setup Study Before Trading
The homework he gives is deliberately repetitive. He asks the viewer to think about the open, the high, the close and the low of every single candle on a monthly chart over the last three months 1:50, 1:56. He says to do this for every pair on the platform, clarifying that it is a study and not a reason to trade every pair, and that the ones to work through are the pairs of interest 2:01, 2:06, 2:09. The levels are to be delineated on the monthly chart over the last three months 2:13, 2:15.
He demonstrates the layout: at the time of recording it is November, so the three candles are October, September and August 2:19, 2:19. Having those reference points on the chart, and having those levels transposed into the lower time frames, is what he says will bring a great deal of clarity 2:31, 2:36. He also acknowledges a practical wrinkle that comes up on real charts: you may have a few levels real close in proximity, with different opens and closes overlapping, and he says that is okay 2:38, 2:41, 2:46.
Defining the ICT Next Setup Monthly Range
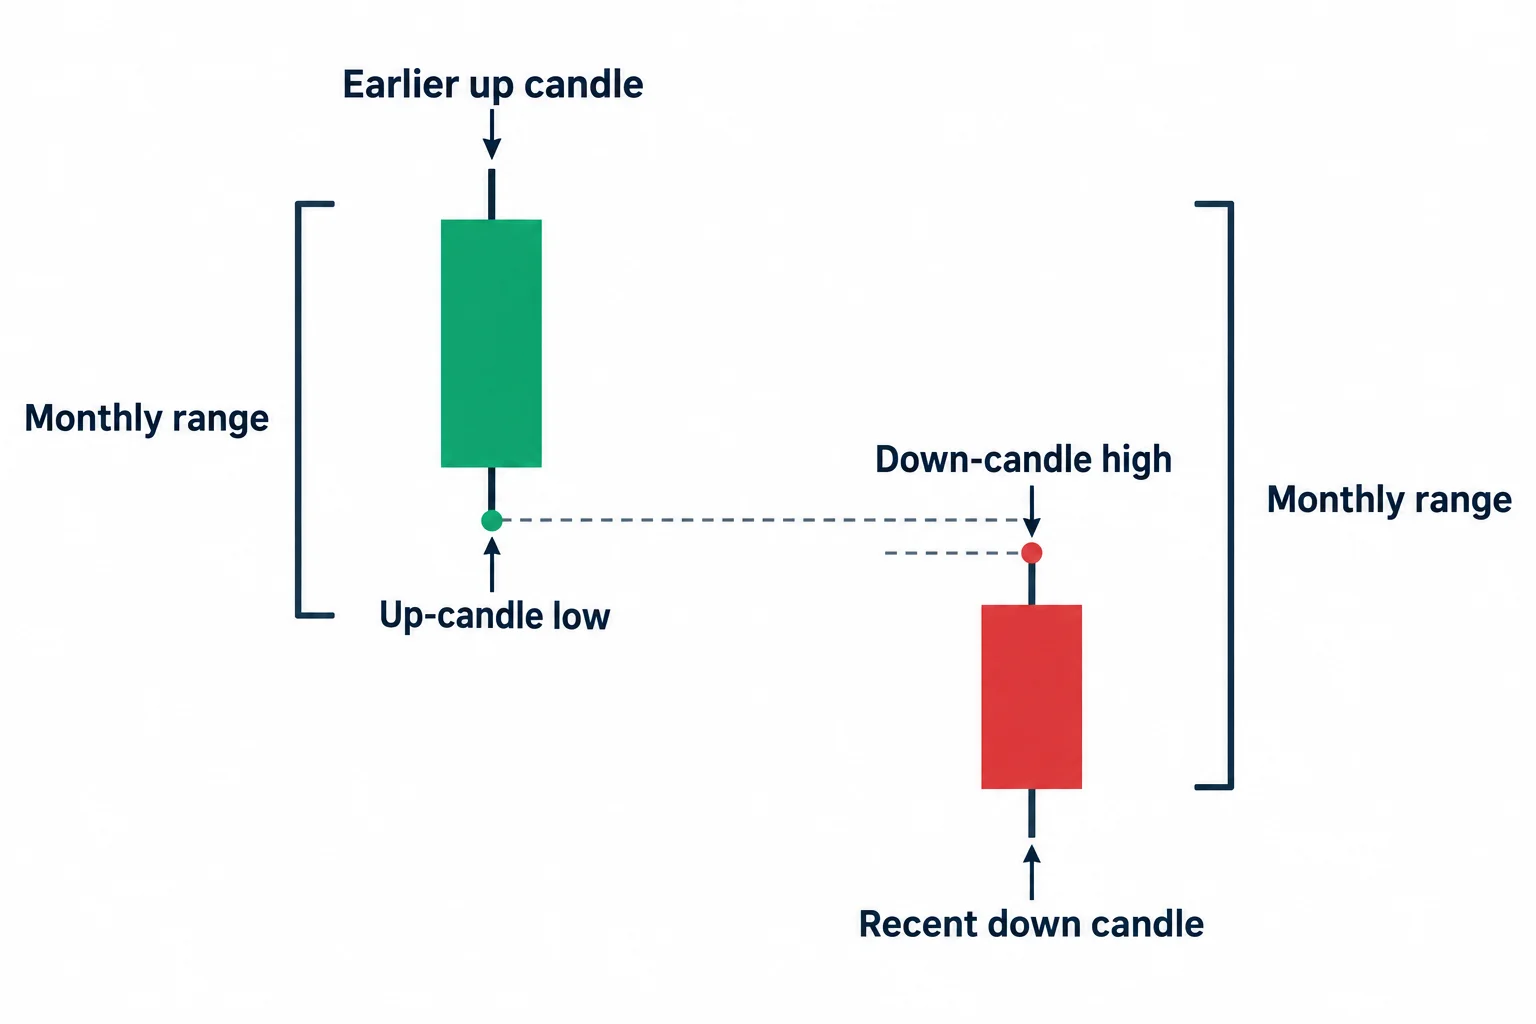
The range comes from two candles, and he is specific about the search order. Find the most recent down candle first 2:46, 2:52. Then, prior to that down candle, find the up candle that exists above it: he says you have to go above the down candle’s high, so the up candle or up-closed candle must have at least a low that is higher than that high 2:57, 3:06. In the chart in front of him he reads the high as a level he states as thirty-one forty-four 3:11, 3:17, and identifies the qualifying up candle 3:31. He notes that just from those two candles a range on the monthly chart has been delineated 3:38.
He is candid about why he does not simply stop there. He says that by itself the viewer has done a great deal already, but that he knows they will not believe it, and that you have to see it to have faith in it 3:45, 3:50. What has been defined, he says, is the range in which to trade 3:54.
He then transposes it. Taking those two reference points down into a weekly chart gives a lot more information to refine, and he marks the month and the month prior with vertical lines, so the down candle sits to the right of the line 3:56, 4:07, 4:19. He identifies that month as June with a down close 4:29, 4:30.
How ICT Next Setup Candles Become Order Blocks
This is the mechanical core of the lesson. On the weekly chart he describes price still in a long-term consolidation with many weeks passing, then points to two down candles that price trades through on a following candle, and says those two down candles are now activated as a bullish order block 4:37, 4:43, 4:50. He notes the upside movement that violates the two down candles, and says that now price returning back down into them would be a bullish scenario 4:54, 4:58, 5:02.
He also brings in a monthly level he states as one thirty point seven oh (which he immediately rounds to one thirty point eighty, with the remark that it is close enough for government work) and says price drops into that level a couple of different times before expanding 5:07, 5:20, 5:24. He then identifies what he calls the monthly bearish order block above, which he says is also the beginning of the last three up candles and the same level as that up candle’s low, and he says he can visualise price reaching for it, probably in the following week or the week after, with more continuation on the upside 5:28, 5:39, 5:53.
ICT Next Setup Daily Chart Example
On the daily chart he first notes that vertical lines delineate each month 5:59, 6:15. He then shows price dipping into the monthly open he rounded, and responding aggressively off it 6:29, 6:41, before describing the beginning of a decline in October 6:44. At this point he addresses the obvious objection directly: he says it sounds like hindsight when you watch it without having been part of the live sessions and the recordings of the previous week 6:51. What follows is his recollection of that prior work rather than a live call: he says they had looked at a specific level as a downside objective, that the reason was the two down candles, and that they were looking for higher prices relative to what the monthly had shown 7:09, 7:14, 7:21.
He then describes price re-trading back into the down candle multiple times before retreating down into a level he states as roughly three thousand two hundred and eighty 7:35, 7:39, and says price is expanding on the upside, with a target he gives as the one thirty-eight big figure and potentially higher 7:53, 8:04.
The ICT Next Setup Trading Rule
Before moving to the other pairs he states the method in rule form, and it is short enough to quote in substance. Look at the monthly chart and define where you are presently in the range. Find the most recent down candle and the most recent up candle: that is the range. If the market trades above a down candle, you wait for a return back to that down candle to trade up into the last up candle. If the market trades up into an up candle, you find the last down candle, which becomes the range for the downside 8:04, 8:18, 8:37. He adds, for the pair on the screen, that there is still upside to go on a monthly basis 8:44.
ICT Next Setup USDJPY Example
The second example runs the same study on a dollar-yen pair. He identifies the most recent down candle and then looks above and to the left for a candle higher than its high, which he states as one hundred and four point thirty-five, and finds the qualifying up candle 9:07, 9:21, 9:32. That gives him a range he states as between one hundred and six point twenty-eight and one hundred and three point twenty-six, which he calls basically three hundred pips 9:40, 9:40.
The rule is then applied explicitly: as soon as a candle trades above the down candle’s high, that down candle becomes a bullish order block, so he says he can be a buyer at the lower level of the range or less 9:46, 9:54. On the weekly chart he shows price trading below that level, and again on the U.S. election, trading down into the bullish order block 10:06, 10:09. He then refines on the daily chart, comparing the body of one down candle with another and saying the larger body marks the beginning of the bullish order block 10:31, 10:35, 10:38. He points out the mean threshold of that down candle and says it is not challenged at all, even on the election knee-jerk reaction, with price dipping into it, a buy, and a rally away, and then the next candle opening on the election and trading down into the previous bullish order block as another buy 10:47, 11:00, 11:09. He identifies old highs and equal highs back on the monthly chart as the objective, and says that has already happened with the move he puts at three hundred pips plus 11:16, 11:25, 11:29.
ICT Next Setup New Zealand Dollar Example
The third example gives the bearish version. On the monthly chart of a New Zealand dollar pair he identifies the last down candle and the most recent up candle, and says price has moved away from the last up candle, exercising that as a bearish order block 11:49, 12:04. On the weekly chart he shows price trading up into the bearish order block and through the body of that candle, which he describes as rather sloppy at that point 12:15, 12:18.
He gives the downside objective as roughly sixty-nine point eighty-three, rounded to sixty-nine point eighty-five, and says the close of the candles he is looking at comes in at seventy point oh five, which is where he would probably look to cover, a distance he puts at about a hundred and twenty pips or so 12:23, 12:35, 12:36. He then states a personal view distinct from the stated objective: he says personally he thinks it is going to go down to sixty-seven point eighty 12:46. On the daily chart he notes price has already moved a good distance, identifies the bearish order block above, and says that area can be refined into a lower-time-frame bearish order block, with a minimum expectation of trading down to a first level, then a next one below, and then below the lows 13:00, 13:30, 13:44.
How the ICT Next Setup Approach Works
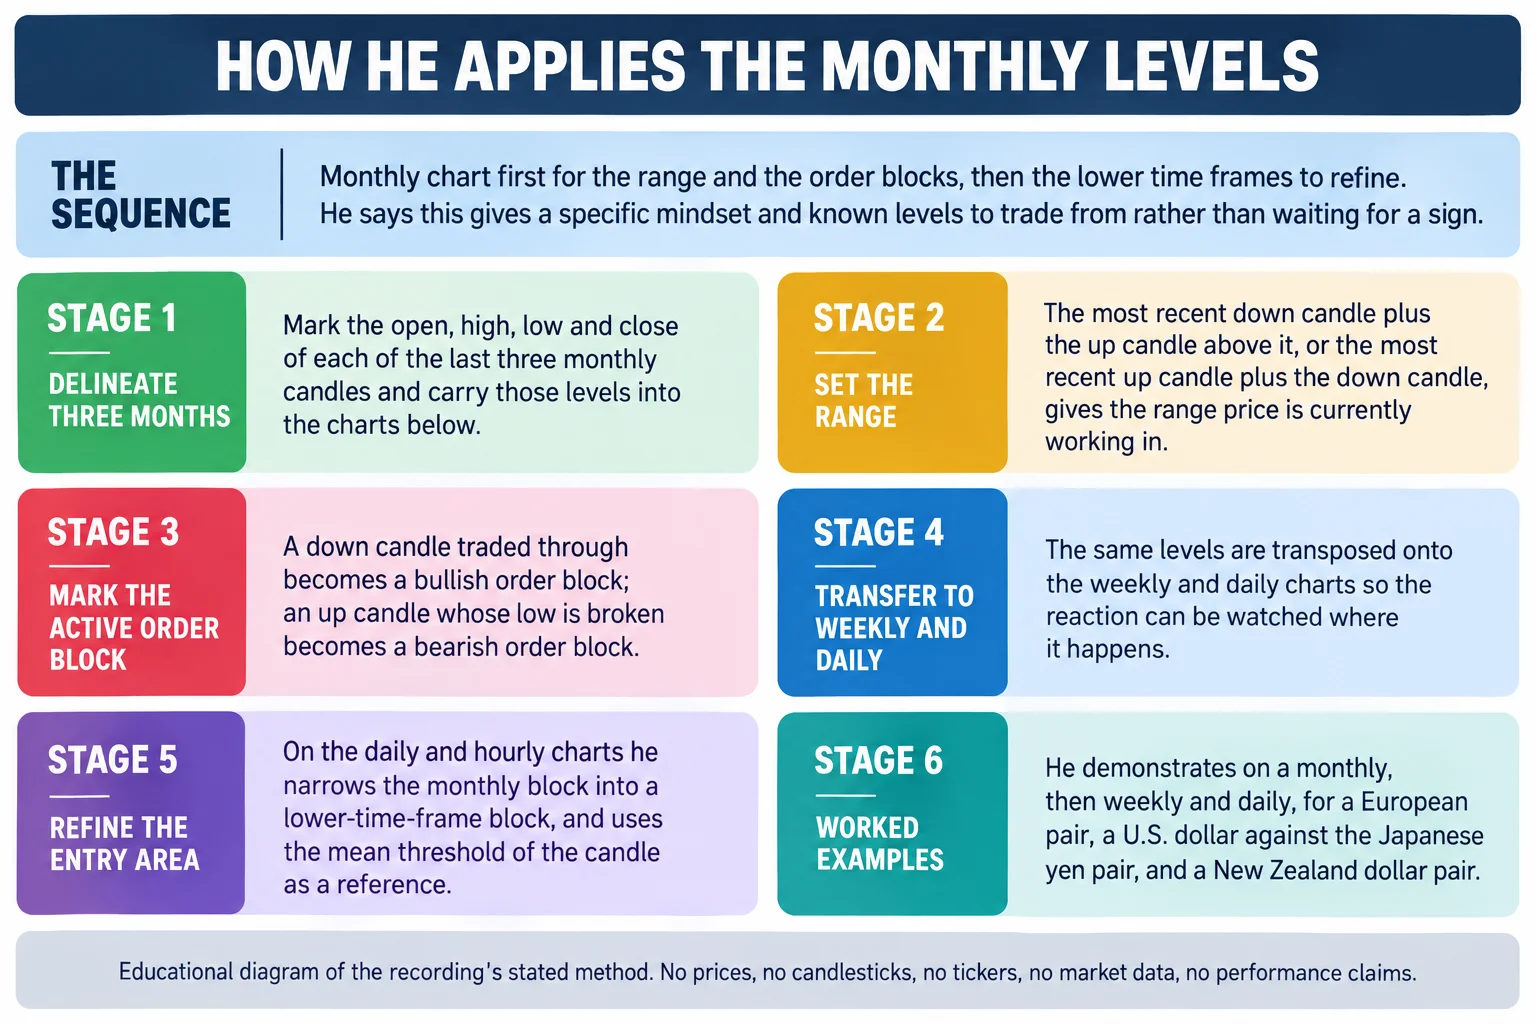
He closes by restating the division of labour between time frames: the monthly chart supplies the bullish and bearish order blocks and defines the range, and the lower time frames bring you closer to the market and let you refine risk 13:48, 13:56, 14:00. He repeats the search procedure (most recent up candle and most recent down candle, that is your range) and frames it as a question about what the most recent order flow did: did price violate a down close or a down candle, which gives permission for that candle to become a bullish order block, or did price break an up candle by violating its low, which activates it as a bearish order block 14:02, 14:08, 14:24. The answer, he says, is simply to look for the contrary order block on the monthly chart, and take those levels down into a weekly, a daily and an hourly chart 14:34, 14:40, 14:43.
His closing rationale is about preparation rather than prediction. He says there is a plethora of opportunities to study across the pairs, and that it gives you a context to look into the marketplace with a specific mindset instead of waiting for a neon sign to jump out and tell you what to do. You will know which levels to trade off relative to the monthly chart, and he says that approach leads you to setups you would not otherwise have known were there 14:44, 14:55, 15:08.
What the ICT Next Setup Lesson Establishes
What it establishes is a fully specified, repeatable study routine: a fixed lookback of three monthly candles, a defined way to choose two of them as the range, an explicit rule for when a candle becomes an order block of each kind, and a procedure for carrying those levels down through the time frames. For a viewer wanting a structured way to prepare before the session starts, the routine itself is the deliverable, and it requires no indicator and no proprietary tool.
What it does not establish is that the levels work. The lesson contains no trade log, no position sizes, no account results and no sample of outcomes. The levels, pip counts and reactions in the three examples (including the move he puts at three hundred pips plus and the hundred-and-twenty-pip distance in the third example) are his own narration of charts he is displaying in a 2016 recording, and the review behind this article read the transcript without viewing the recording, so none of them have been independently checked. Two of his statements in the lesson are explicitly retrospective: he acknowledges that the daily-chart walkthrough sounds like hindsight without the prior live sessions, and what he offers in response is his recollection of earlier work rather than a contemporaneous call, which is reported here as such. His premise that a monthly range necessarily reflects large institutional orders is his interpretation of price delivery and is not demonstrated by the lesson. The third example ends with a stated objective and a separate personal expectation pointing lower, which is a reminder that the levels he derives are a framework for study rather than a forecast with a fixed answer. Third-party ICT material found anywhere other than the publishing channel’s own page (indicator scripts, note packs, re-uploads, transcript packs) is unofficial, has not been tested for this article, and no claim is made about its accuracy or whether it repaints.
ICT Mentorship Core Content – Month 03 – The Next Setup – Anticipatory Skill Development
The Inner Circle Trader · watch page lists upload 3 September 2022 · 915 seconds, about 15 minutes 15 seconds. The recording identifies itself as the fourth teaching of eight in the November 2016 mentorship content, and it is the primary source for every timestamp link on this page.
The recording is not embedded here. An embedded player was tested directly on 15 September 2026 from a BestProps page origin at desktop and mobile widths: the frame loads but then reports “Playback on other websites has been disabled by the video owner”, with no duration and no playback progress, while the video itself is publicly playable on YouTube. No half-working player is left on this page.
Watch the Original ICT Next Setup Recording
The three chart examples are the part worth watching rather than reading about, because the method depends on seeing which candles he selects as the range. Every timestamp link above opens the recording at the moment referenced so the narration can be checked against the spoken source directly.
ICT Next Setup Learning Resources
These are the sources checked while preparing this article. The two regulator pages are general material about how technical-analysis and short-horizon trading claims should be assessed; neither evaluates this speaker, tests the monthly-chart routine, or endorses anything in the recording.
- [1] ICT Mentorship Core Content – Month 03 – The Next Setup – Anticipatory Skill Development The Inner Circle Trader (primary source; watch page read 15 September 2026, listed duration 915 seconds, publicly playable).
- [2] The Inner Circle Trader (official YouTube channel) (read 15 September 2026), the publishing channel for the mentorship series this recording belongs to.
- [3] CFTC (Fraud Advisory: Commodity Trading Systems Sold on the Internet) (read 15 September 2026), notes that technical analysis attempts to predict future price movements from historical prices, price relationships and price trends, and that hypothetical trading results are typically simulations over historical or “real time” computer data rather than executed trades.
- [4] Investor.gov (U.S. SEC), Day Trading (read 15 September 2026), describes day traders as buying, se