
Key takeaways
ICT’s seventh teaching for the November 2016 mentorship material is about what he calls trendline phantoms, or false trendlines 0:33, 0:40.
Read the full summary
ICT’s seventh teaching for the November 2016 mentorship material is about what he calls trendline phantoms, or false trendlines 0:33, 0:40. He defines diagonal support as a line under higher lows that retail traders extend into the future and buy on the next touch, and diagonal resistance as the mirror image that they short 0:45, 0:49, 0:57. His stated position is that there is no statistical edge he has been able to build with diagonal support or resistance, that price has no awareness of a line on your chart, and that price only respects where the actual liquidity is: protective sell stops, protective buy stops, new buy stops for long entries and new sell stops for selling entries 2:25, 3:45. In the bullish trap he aims at the high that forms between the second and third touches of the uptrend line, looking for a bearish order block, a bearish breaker or a brief poke above that high for what he calls a turtle soup entry, and he says he wants the higher timeframe to show it is not a bullish environment 8:01, 8:16, 8:22, 8:27. In the bearish trap he aims at the low between the second and third touches for a bullish order block, or accepts a break just below that low as a turtle soup long or a run on the sell stops, and watches the second high because that is where he says the short sellers’ protective buy stops sit 10:36, 10:53, 11:26. His worked examples use an intraday uptrend line inside a daily reference area around 11 December 2015 and descending lines he reads as buy scenarios in 2016 13:56, 19:44, 20:38. Nothing in the recording is a statistical test, an account statement or a verified result, and every level quoted below is his own spoken narration of a chart this review did not see.
How we researched this article
BestProps used document-based research from primary firm sources, checked September 24, 2026. The complete source list, scope, limitations, and commercial-state record appear near the end of this article.
In ICT Mentorship Core Content – Month 03 – Market Maker Trap Trendline Phantoms, ICT sets out to dismantle ordinary diagonal trendline analysis and to reframe the same drawings as information about where other traders have placed entries and stops. The recording opens by identifying itself as teaching number seven of eight for the month of November 2016 in the mentorship 0:33, 0:40. Its YouTube watch page lists an upload of 4 September 2022 and a duration of 1,482 seconds, against a transcribed audio duration of 1,482.0 seconds.
What He Means by a Trendline Phantom
He starts with the two conventional readings. Diagonal trendline support is primed, in his description, by a market beginning to make higher highs and higher lows, so that an imaginary diagonal line appears to repel price higher; retail traders extend that line into the future, attribute support theory to it, and buy when price returns to it 0:49, 0:57, 1:04. Diagonal trendline resistance is the same construction inverted: lower highs and lower lows, a line that appears to propel price lower, and retail traders shorting its next touch 1:24, 1:41, 1:48.
He calls the projected level a phantom because the point on the line has not traded yet. At 2:57 he asks which lows you draw connections to and which highs, and says that the answer quickly stops looking as easy as the textbook examples 3:01, 3:06. From that he draws his central objection: you are associating future price movement with a level that has not been traded to yet, using reference points in the past that he says have no bearing on what future price does 4:56, 5:02, 5:12.
He also states his own history in this recording: that he has been trading for 24 years, and that when he started he was indoctrinated with trendline analysis and found it persuasive because he could see it working in the past 2:33, 2:50, 2:54. That is a personal account given in the recording; the recording contains no data set with which to test it.
Why He Says Price Has No Awareness of Your Trendline
The claim he repeats is that price does not respect what you draw on your charts and that it respects only where the actual liquidity is 3:20, 3:26. He lists that liquidity as buying and selling interest already in the market: protective sell stops, protective buy stops, new buy stops for long entries and new sell stops for selling entries, and he says that is the only thing that moves price 3:45, 3:55. In his framing it is then hinged on the context of which large participant has control at the moment 4:03.
Pressed on whether banks assign value or prognostication to a diagonal level, his answer in the recording is no, because the exercise is subjective 4:33, 4:56. He adds that he is telling viewers the banks do not care what they are scribbling on their charts and are not aware of it, but that they are aware of the sentiment that shifts and builds around those levels, because those levels are replicated at fund level 5:37, 5:48, 5:53. He then describes large traders as the prey the market is driven toward, with their orders and not retail orders as the objective 6:00, 6:07.
He extends the objection to the third touch specifically: that when price supposedly returns to the line for a third time, the fact that the line was drawn is not by itself a reason for price to turn 5:28, 5:33. From 6:46 he describes the shape of trendline analysis as a set of dangling carrots, and says charts will paint beautifully disguised opportunities that are impossibilities 6:46, 7:00, 7:05.
He states plainly that there is no basis for trendline theory in the form of diagonal support or resistance in his view, and that there is no statistical edge he has been able to build with it 2:08, 2:25. He also says the mentorship does not subscribe to down-sloping or up-sloping trendlines to formulate support or resistance 4:17. The claim is presented as his own perspective; no test or sample is offered in the recording.
His conclusion from all of that is the coin-flip passage. He asks whether you have confidence that the line you are drawing will really provide support or resistance, calls the exercise a toss-up, compares it to flipping a coin where heads makes you a buyer and tails makes you a seller, and says he does not trade with the perspective of chance 11:50, 11:57, 12:03, 12:13. What he says they do instead is look to the marketplace for clues as to where smart money will use the liquidity made available by the funds and by uninformed money 12:24, 12:30.
The Bullish Trendline Trap: Retail Support Becomes a Sell Scenario
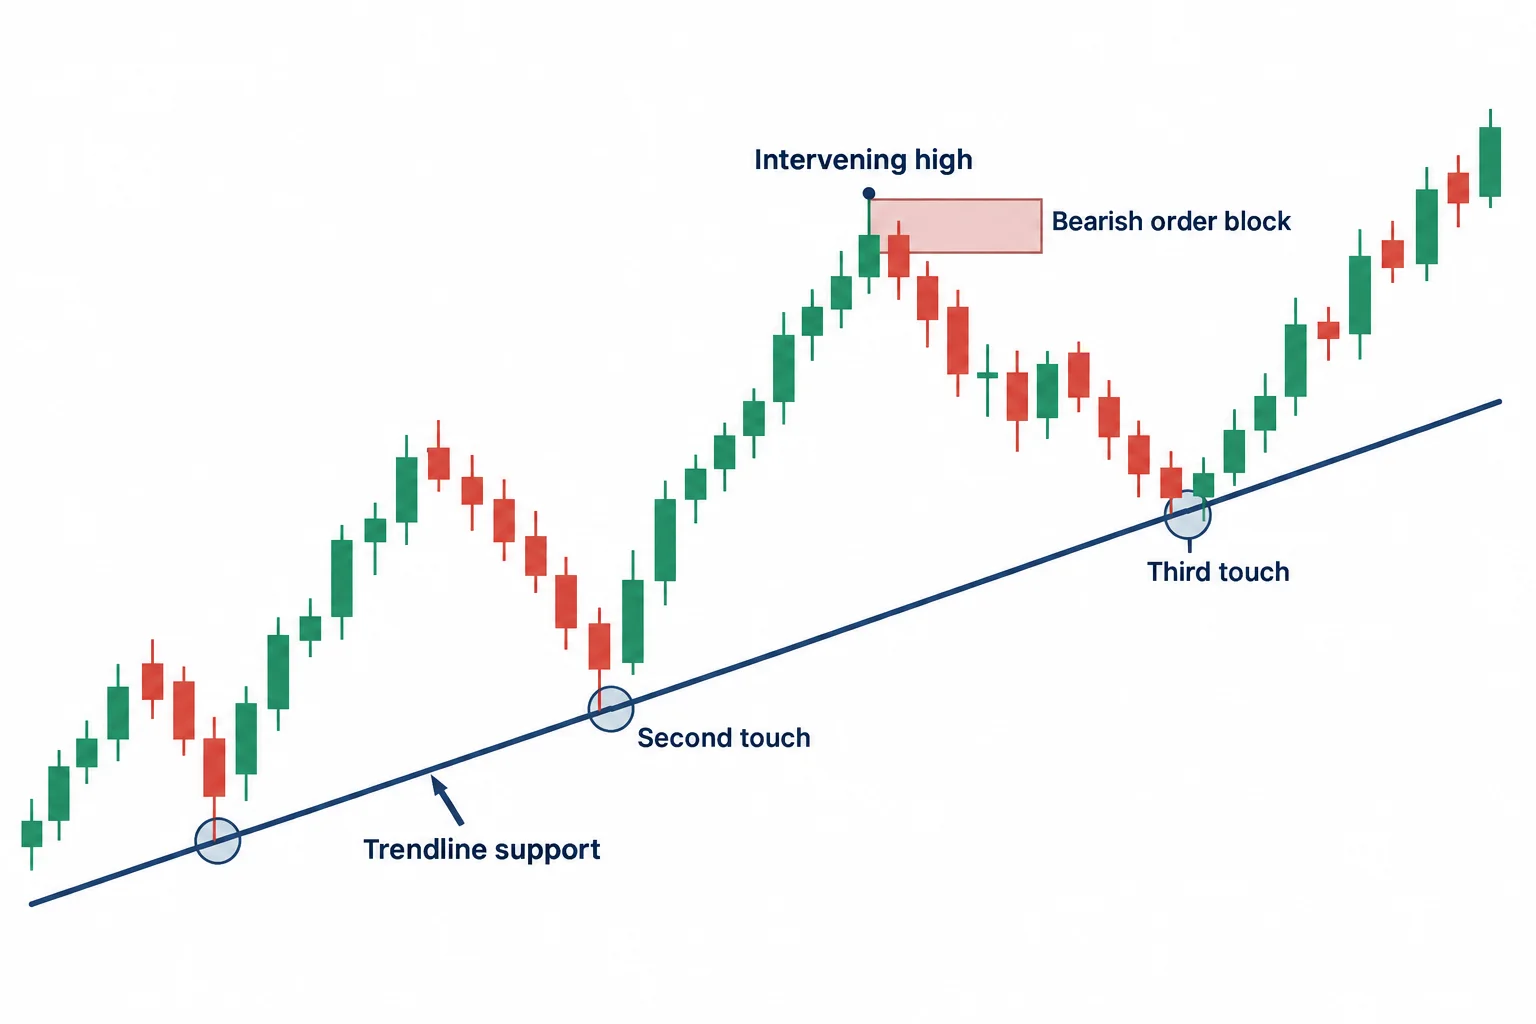
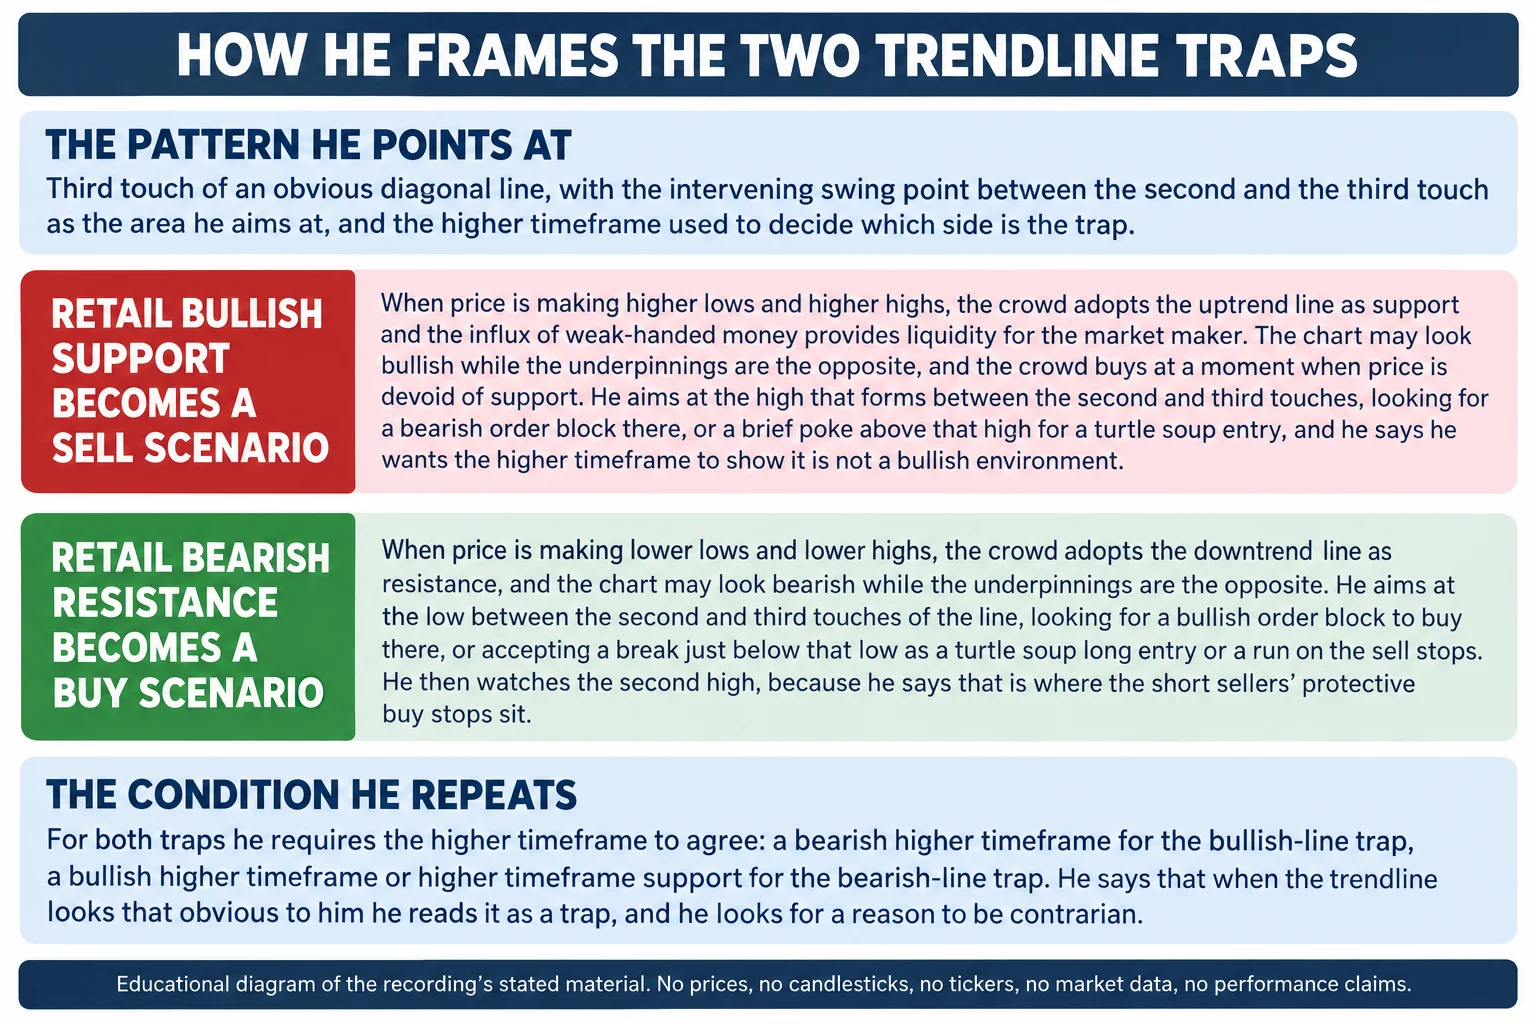
At 7:24 he introduces what the market maker can do with the fallacy. In periods when price is making higher lows and higher highs, he says, retail traders adopt trendline support, and that influx of weak-handed or less informed money at a price level provides liquidity for the market maker. The chart may look bullish while the underpinnings are the opposite, and the retail crowd buys at a moment when price is devoid of support, leaving them long with drawdown in the trade 7:24, 7:29, 7:34, 7:41, 7:47, 7:52.
His own use of that setup is narrow and it is located between two touches. When he sees the third touch of that uptrend line, he says he gets dialed in on the high that forms between the low at the second touch and the third touch 8:01, 8:06, 8:12. He aims at that intervening high for a bearish order block, or he allows price to poke its head briefly above that high for what the audio renders as a “turtle suit” entry — the same concept he calls turtle soup elsewhere in the recording — especially if the higher timeframe charts he uses indicate the market is not in a bullish environment 8:16, 8:22, 8:27, 8:32.
He adds that sometimes, on a lower timeframe, what he wants there is not an order block but a bearish breaker, where the market has already shown a willingness to rally up and take out an old high 9:02, 9:06, 9:09. He sums the whole approach up as looking for a reason to be contrarian, because if the trendline looks that obvious to him he reads it as a trap 9:20, 9:26.
The Bearish Trendline Trap: Retail Resistance Becomes a Buy Scenario
At 9:31 he mirrors the construction. When price is making lower lows and lower highs, retail traders adopt trendline resistance, the chart may appear bearish while the underpinnings are the opposite, and the crowd sells at a moment when price is devoid of resistance, leaving them short with drawdown in the trade 9:31, 9:37, 9:42, 9:45, 9:52, 10:02.
The area he aims at is the low between the high at point two and the high at point three 10:08, 10:14. He conditions that on the higher timeframes pointing to higher prices in the near term and on price trading at a higher timeframe support level based on order blocks or institutional order flow 10:18, 10:22, 10:27. At that low between the two points he looks for a bullish order block to buy, or he accepts a break just below the old low as a turtle soup long entry or, as he puts it, a run on the sell stops 10:36, 10:41, 10:45, 10:53.
The second point of the structure matters to him for a specific reason. He says that when the market rallies in that descending pattern he is actually looking for a move up into the second high, because that is where he says a lot of the buy stops will be residing 11:00, 11:08, 11:26. In the bullish-support version he describes the same idea in reverse: retail is looking for price to go higher, while he is looking for it to go below point number two, because that is where he says everyone’s stop-loss sits 11:41.
His First Worked Example: An Intraday Uptrend Line Inside a Daily Reference Area
The chart walkthrough begins at 12:58 with an intermediate-term high, an impulse swing lower, and a gap he identifies as a fair value gap running from the low of one candle to the high of another, with the low of that candle used as the reference area 13:04, 13:11, 13:18, 13:24, 13:30. In his narration price then rallies into what the audio renders as the 52.34 level on what he says is 11 December 2015, and he pulls up the fifteen-minute chart for that date to delineate the same high 13:48, 13:56, 14:02, 14:08, 14:27.
The point of the example is the third touch. He asks the viewer to see how one low connected to another low and projected out in time eventually gets hit a third time, which he says trendline followers read as continuation to a higher price 14:33, 14:37, 14:43. Against that he sets a daily institutional reference area he describes as already closed in, which he says sends him looking for the next area of liquidity lower 14:50, 14:56, 15:00. He then traces that objective off a down candle’s high and another down candle’s low, notes the level has only been passed once on the upside, and says he is looking for price to come back down into that candle’s high, which the audio renders as the 150-60 level 15:10, 15:23, 15:29, 15:37.
He then shows what the chart looked like as it was forming: a low apparently finding support that a retail trader could reasonably expect to carry price higher, when the only thing price had actually done was move back up into the last up candle, which he calls a bearish order block 16:02, 16:08, 16:14. In his market-efficiency framing that return is not trendline support but a reason to get short, and he says the buyers coming in at that point give him “wonderful opportunities to be sellers to them” 16:24, 16:30, 16:46.
The sequence he narrates next is the trap firing. Price comes back to the projected third touch and he says it does not make a bullish scenario; it only rallies to the last up candle’s midway point, or mean threshold 16:58, 17:07. He identifies an equilibrium reference point, a liquidity void where price closes in, and sell stops beneath a low, and repeats that he is working off the daily chart the way he says a bank would 17:12, 17:18, 17:23. Anything viewed as diagonal support in that area he treats as suspect 17:39. Price then trades up into the equilibrium, pierces a high in what he calls a turtle soup, sells off, and trades down into the level 18:03.
He zooms out to a thirty-minute chart at 18:12 to show a second projected line, says price comes into it and asks whether that is a buy, answers no because it is only coming back into the last up candle he reads as a bearish order block, and repeats that he does not see it as a bullish scenario because that area is one where he expects selling 18:18, 18:26, 18:33, 18:39. He describes price running back above an old high into either a turtle soup or a bearish order block, notes that his stop would sit above an old high from the higher timeframe setup, and narrates price accelerating through what would be considered trendline support and down into the 150-60 level again 18:48, 18:57, 19:03, 19:10.
The Second Set: Descending Lines He Reads as Buy Scenarios
From 19:23 he turns to downtrending lines that he says are actually buy scenarios. He marks a run up, two down candles immediately before it, and a level the audio renders as 143.85 or thereabouts with an opening price of 143.84, then carries that level down to a lower timeframe chart and says he sees price trade down to it again 19:49, 20:02, 20:11, 20:22, 20:27, 20:33.
His reading of the third touch here is the opposite of the first example. Where a trendline follower would sell it, he says he sees it as a potential turtle soup long for a return back to a bullish order block 20:27, 20:33. He states the order he would place and where he says a better fill might come: a buy at what the audio renders as 43.85 or 43.90 on a limit, or a fill at 43.80 or lower, on the expectation that this is a false trendline 20:38, 20:46. He then points at the second high, says that is where anyone short would have protective buy stops sitting, and narrates price rallying away, coming close to that high, making a normal retracement lower, and coming back into the last two down candles as a buying opportunity 20:51, 20:57, 21:02, 21:14, 21:20.
The follow-through he describes is the buy stops being tagged, and only then lower prices being permitted, because the highs have been taken out and the liquidity beneath is allowed to be tested 21:28, 21:36, 21:47, 21:54, 21:59. He never presents a fill, an entry price on a live account or a result for any of these narrations.
A final example starts at 22:13 with a down candle he labels a bullish order block, validated in his description when a candle trades above that down candle’s high, followed by a third candle that opens and trades down into the body of the down candle 22:14, 22:16, 22:21, 22:23. He puts the mean threshold at approximately the 144 figure with the open at 144.46 on that down candle, and dates the day on the candle as 18 May 2016 22:29, 22:35, 22:46.
He notes a lower high that can be extended out in time, says price sells off a little and then pops through it one more time, and argues that traders who saw the pattern as a downtrend and read that as a return to sell into were wrong there as well 22:46, 22:55, 23:00, 23:05. He adds that a classic triangle pattern and false breakout would also have been wrong on that chart 23:16, 23:21. The rally he narrates finished at what the audio renders as the 146 big figure, which he says is the last up candle on the daily chart, closed in by all the down candles, so that price has to be efficiently balanced by offering on the buy side after being sold off 23:26, 23:30, 23:36, 23:39, 23:52.
What He Says the Point of the Exercise Is
He closes by saying directly that breaking the idea of these supposed trendlines is not the key to it, but that when retail fingerprints are all over a chart, probabilities shift in his favour when he does the opposite, and that he can justify that with institutional order flow and institutional reference points on the daily chart, as he puts it, just like a bank would 24:03, 24:10, 24:13, 24:17. His instruction to the viewer is to go back through charts, drop to lower timeframes, and watch how price treats these retail trendlines: in his words, retail chases them, they end up being not really there, and “they end up giving up the ghost” 24:24, 24:27, 24:32, 24:35.
How to Read This Lesson Without Overreading It
The lesson separates cleanly into material that can be checked against the recording and material that cannot:
- The mechanism is his interpretation. That an obvious diagonal line concentrates entries and stops is a claim ICT makes about market behaviour in this recording; nothing in it is a measurement of who bought or sold at those levels.
- The edge claim is attributed, not verified. The statement that there is no statistical edge he has been able to build with diagonal support or resistance is his own perspective, offered without a test, a sample or a period 2:25.
- No trade results appear. The recording narrates chart behaviour and the orders he says he would place. It does not present fills, account figures, win rates or profits, and none should be inferred from the examples 20:38.
- The levels are speech, not verified data. Every price quoted on this page is the automatic transcription of his narration, and several of them are plainly unreliable renderings. The chart markings themselves were not inspected.
- Contrarian is not automatically right. He says the higher timeframe condition has to agree. A false trendline reading taken against the higher timeframe is the situation he describes himself as avoiding 8:27, 10:27.
- This is not instruction to trade. The material is educational explanation of one trader’s framework. It is not investment advice and no part of it is a recommendation to copy the examples.
Watch the Original Recording
ICT Mentorship Core Content – Month 03 – Market