
Key takeaways
This is his lesson on fading classical head and shoulders patterns, and he is clear at the start that he is not teaching the pattern itself.
Read the full summary
This is his lesson on fading classical head and shoulders patterns, and he is clear at the start that he is not teaching the pattern itself. He defines head and shoulders as three successive peaks — a high, a small retracement, a higher high, then a lower peak — with a neckline drawn across them; a break below the neckline is classically a sell, and the objective is the neckline-to-head range subtracted from the neckline 0:45, 1:31. His objection is that because the pattern is in every retail book, traders hunt it on lower time frames, while he says it forms genuinely at intermediate or long-term highs 1:41, 2:02. What he says he actually trades is the conflict: when his higher-timeframe premise says price is going the other way, he reads the neckline break as a liquidity run rather than a continuation 2:27, 5:35. In a bullish context he says the run below the neckline lows takes out sell stops, which he calls a turtle soup long, and he buys them, targeting the buy stops above the highest high of the pattern 6:20, 6:50. The inverted version works in reverse for him: a breakout above the neckline in a bearish environment is, in his words, a run on buy stops and he looks to go short there 7:07, 7:27. He says the first profit on either pattern can be taken at the right shoulder 7:35. Two GBP/USD chart examples follow, and everything he reports from them is his own reading of those charts 7:47, 12:13. No fills, no sizes, no account results and no test of the method appear anywhere in the lesson; the prices and pip counts below are attributed to him, not verified.
How we researched this article
BestProps used document-based research from primary firm sources, checked September 24, 2026. The complete source list, scope, limitations, and commercial-state record appear near the end of this article.
This page covers ICT Mentorship Core Content – Month 03 – Market Maker Trap Head Shoulders Pattern, a recording from The Inner Circle Trader. He opens by identifying it as a 2016 mentorship session on false top and bottom patterns as they relate to classical head and shoulders 0:35. The structure is straightforward: he defines the classical pattern so the audience can recognise it, explains why he thinks it misleads people, sets out what he does instead, and then works through two charts.
One boundary matters before the detail. The two worked examples are his own narration of his own charts, delivered in 2015-vintage market conditions, and the lesson contains no order log, no account statement and no outcome data of any kind. Prices, dates, levels and pip counts below are reported as he states them, are the transcript’s rendering of spoken words, and are not evidence that anything was traded or that the approach works.
How he defines the classical pattern first
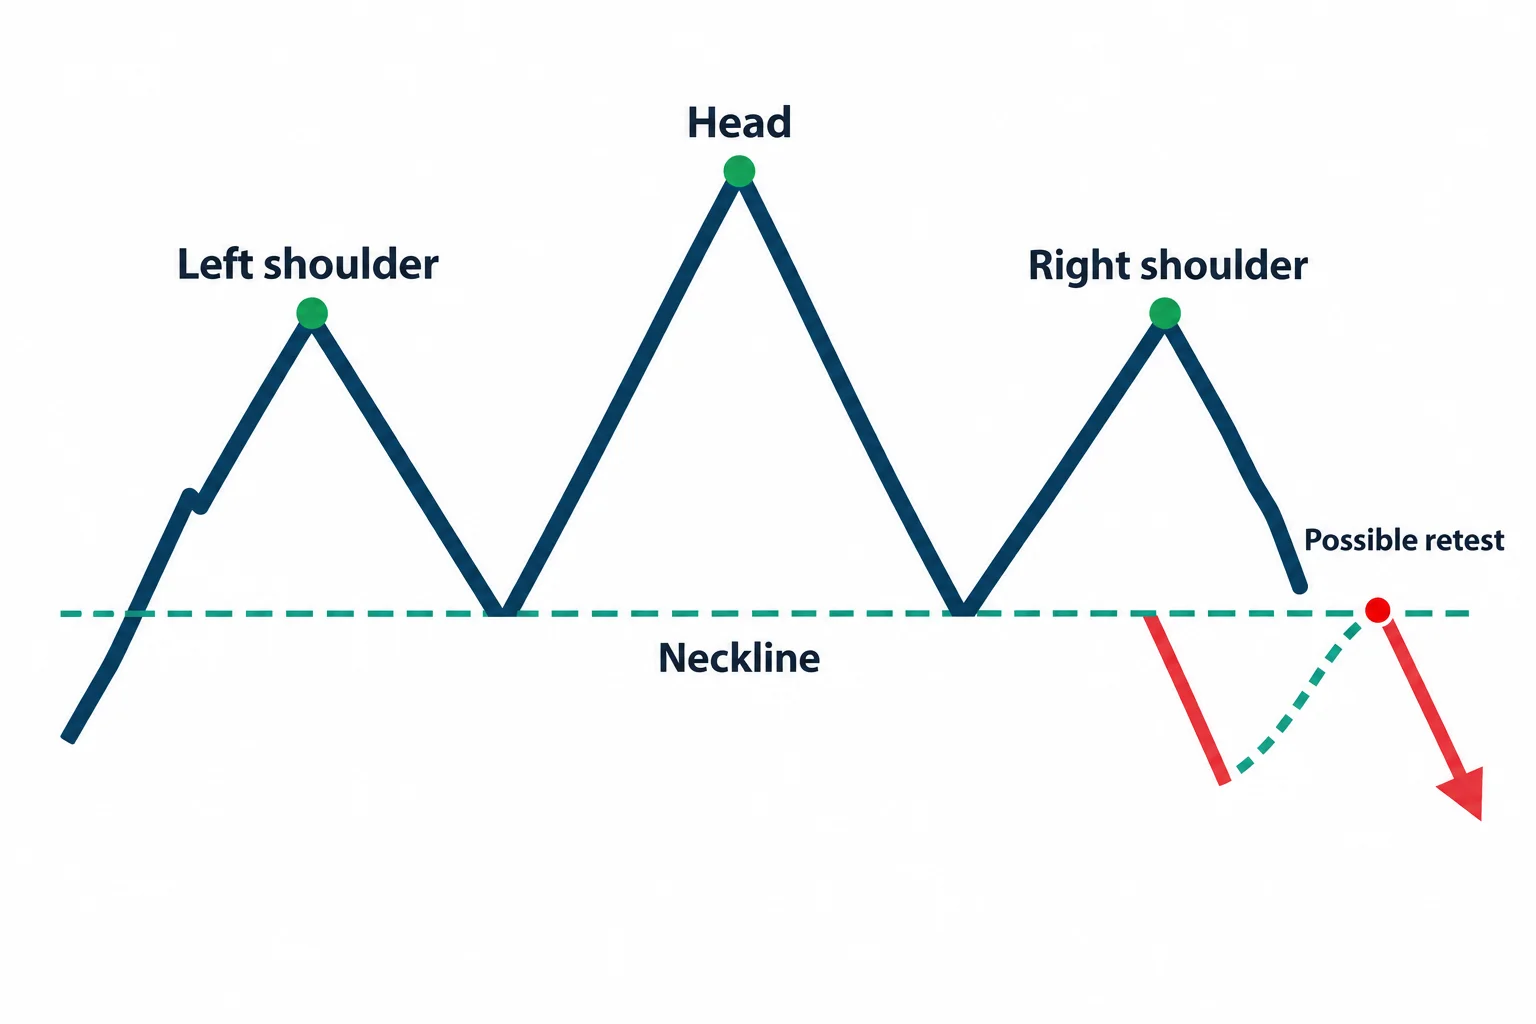
He spends the opening minutes establishing the pattern in plain terms, which is useful because everything after it is a reaction to that definition. A head and shoulders top, he says, is typically seen as a price high that trades into a small retracement, then creates a higher high, retraces back lower, and then creates another lower price peak or short-term high 0:45, 0:56. Connecting those three successive peaks in price is what is classically called the neckline 1:03.
From there he describes the classical trade: the neckline behaves like support and resistance, price often retraces or pulls back up to it after a break and then sells off again, and the target is selected by measuring the range from the neckline up to the head, the highest peak, and subtracting that range from the neckline once price breaks below it 1:10, 1:31. He gives the inverted version the same treatment: a short-term low, a lower low, then a higher short-term low, with the neckline connecting the highs around those three lows, a break upward classically expected to pull back to the neckline and then advance to a target, with the range from the neckline down to the lowest of the three lows added to the neckline 2:35, 3:11.
He is explicit that this is groundwork and not the lesson. He says he is not going to teach the classical patterns because they can be found on the internet, and that what he will actually tell the audience is how to capitalise on them when they appear and his higher-timeframe premise indicates the opposite direction is unfolding 2:19, 2:31.
Why he says the pattern misleads people
His criticism is about where and why the pattern gets drawn. Because it is taught in retail books, he says every trader comes to the charts looking for these patterns, but he says price generally forms them genuinely at intermediate or long-term highs only — and that, through a low understanding of how the market works, retail traders draw topping patterns on lower time frames, many times at a significant low in price, and then marry the pattern to the wrong conclusion 1:41, 2:08. He makes the mirrored point for the inverted pattern: it forms genuinely at intermediate or long-term lows, while retail goes into the lower time frames hunting the classic bottom pattern, many times at a significant high 3:14, 3:36.
He then describes the failure mode in the first person. He says that as a new trader you get the textbooks and the ideas and you force what you learned out of the books onto the charts, concluding that because you learned about head and shoulders there must be one right now, so you go and trade it 3:42, 3:57. He adds that he says this as someone who started as a futures trader and had this promoted hard to him, and he argues picking tops and bottoms is one of the worst games to play, saying even seasoned professionals do not pick long-term tops and bottoms 4:03, 4:39.
The conflict he actually trades
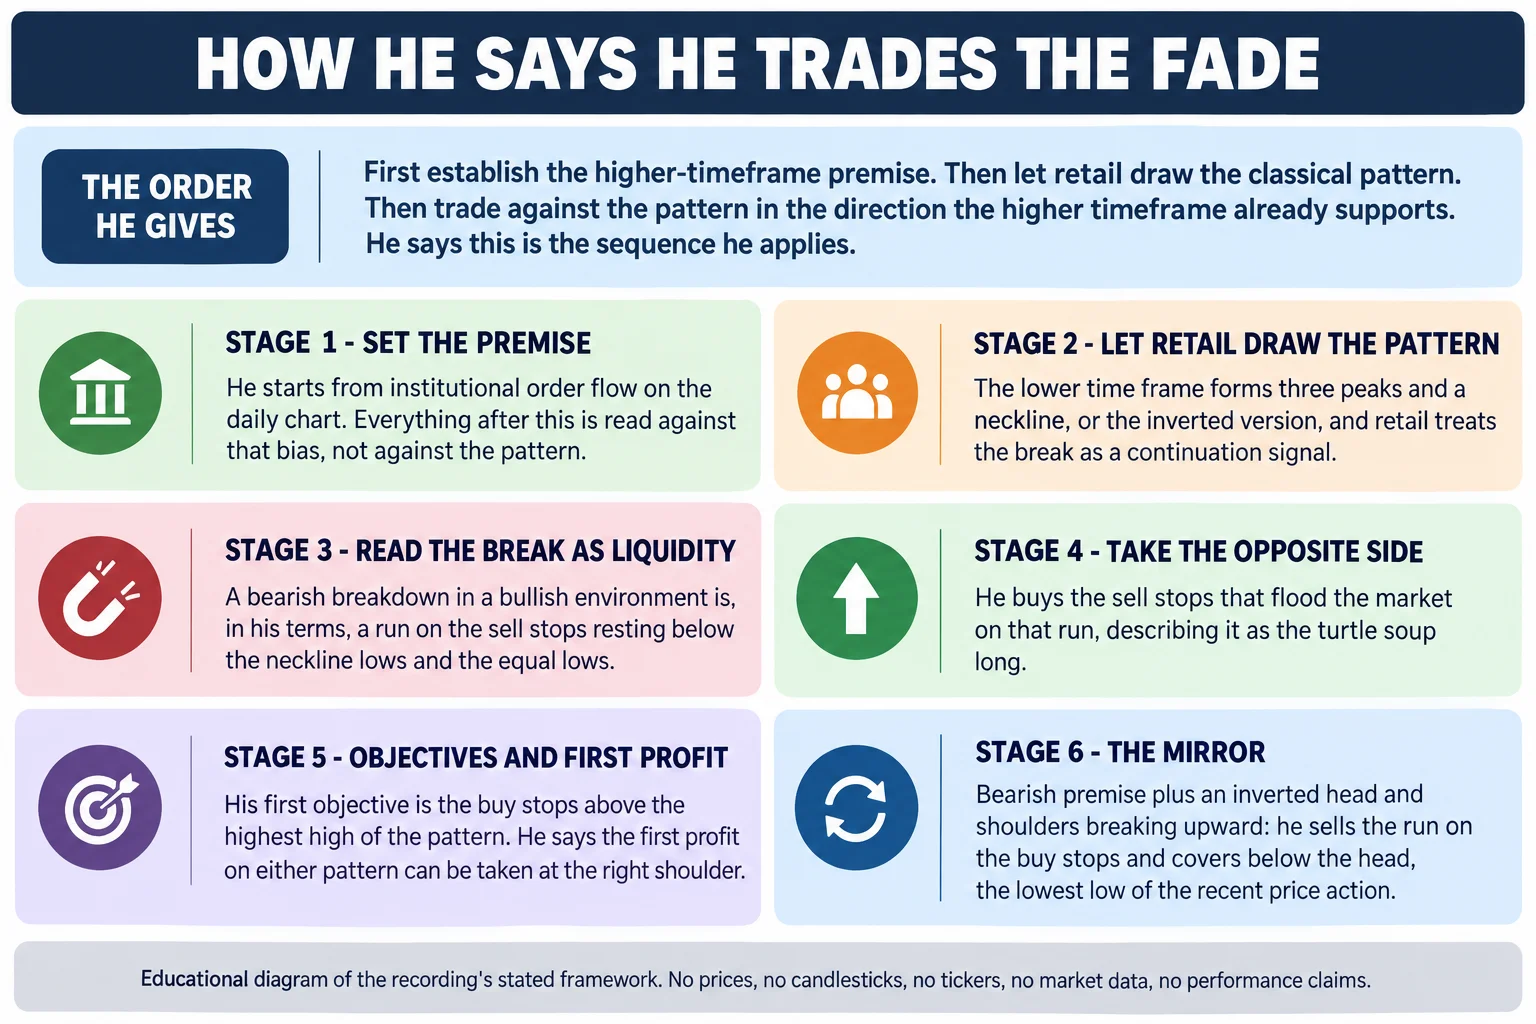
This is the core of the lesson. He says his institutional order flow studies, and watching how interbank pricing is delivered, allow him to see these patterns when they form and read them against the higher-timeframe picture. If he has an indication that price is going higher and he sees a head and shoulders pattern that retail reads as a top forming, he treats it as a false top. Conversely, if the market is bearish and he sees an inverted head and shoulders that is classically viewed as bullish, he says he would be looking to go short 4:45, 5:17.
He then names the mechanism in his own vocabulary. Referring back to the standard pattern, he says that when he looks at the neckline he sees an opportunity to be long once the neckline is broken on the downside, particularly if the environment is institutionally trained bullish — that is, if the market is at a long-term or intermediate-term low and forms three successive peaks moving higher that a pure chartist would read as bearish 5:23, 6:01. He says he likes seeing price do that because, to him, it is a retail trap, and he describes the market as designing classical chart patterns in price so that traders get tripped up by a formation and a neckline break 6:06, 6:16.
What he does with the break is where he is most specific. He says he does not see the pullback as a resuming lower or a new selling scenario, but as what he calls a turtle soup long that took out two clean lows, and he treats it as a buying opportunity. He says he will buy the sell stops below those equal lows or where the neckline is, then look for the head — the highest peak — to be violated, and try to pair his long exits with the buy stops above the highest high in the pattern, which he calls his first objective. For the inverted pattern, he says he does the opposite 6:20, 6:59.
He then spells out the short side of the same logic. If his higher-timeframe read is bearish and he sees a low, a lower low and a higher low that would be deemed an inverted head and shoulders, he says he does not read a break above the neckline as a bullish breakout; he reads it as a run on buy stops and looks to go short there, not expecting price to continue higher but expecting those equal highs to be blown out and then a run for the sell stops below what would be the head on the pattern, or the lowest low in the most recent price action. He adds that the first profit on either pattern can be taken at the right shoulder 7:07, 7:35.
His first chart example: a daily bullish read with a bearish lower-timeframe pattern
The first example is a daily chart of the British pound against the US dollar, which he calls cable. He points to a down candle before an up move, describes a period of consolidation, and says price came down and hit the same order block, closing into the fair value gap between the high and the midway point of the candle, with the next candle respecting that range and not going further 7:47, 8:09. He dates the day the market traded through the down candle as 10 August, calls that down candle a bullish order block, and says its high down to its opening makes it sensitive for a buyer 8:25, 8:39. He gives the high as a level he states as one fifty-five forty-six, and says the market traded down into the body of that bullish order block on 12 August 2015 8:51, 9:00.
He then moves to the hourly chart for the same period and shows the setup that the lesson is about: a high, a higher high and a lower high, with two equal lows, which he says retail will read as a head and shoulders pattern and therefore as a selling scenario 9:15, 9:27. He walks through the retail arithmetic in his own terms — the break of the neckline, the range from the high down to the neckline subtracted to give the short objective, and the duplicated range producing a downside target around the level he states, which he describes as a range expansion down to a low he states as one fifty-four ninety-five 9:39, 10:15.
His own expectation is the opposite, and he says so plainly: he does not expect that target because the daily chart has a bullish order block he expects to send prices higher 10:24. He reads the run below those lows as a run on sell stops, and explains the reasoning in terms of who is resting there: he says the market is looking to go below that level to pair up orders to go long, and that traders already long with trailing stops will have sell stops below, particularly because the most recent move has been higher. He says he sees the move below the equal lows as an opportunity to buy those sell stops as they flood the market 10:29, 11:04. He frames that resting liquidity as the market efficiency paradigm 11:10.
The trade he describes from it is a buy at a level he states as one fifty-five fifty, looking for a move above a high he states as one fifty-six twenty, a target he puts at about seventy pips, and he says the market ran below that low several more times to gather sell stops before expanding and pairing up the buy stops above the level he named, followed by a pullback 11:21, 11:51. He summarises it as using the head and shoulders pattern against what retail would expect and reading the daily chart as the banks would 11:58, 12:02.
His second chart example: the inverted pattern sold, not bought
The second example reverses the trade. On the daily chart he points to a down candle before a large move up, notes equal highs that would have had buy stops resting above them, and says the rally took those buy stops out before closing back inside its range 12:13, 12:28. His reading is that the down candle was a bullish order block used to break the buy stops, and that when price subsequently trades back up into it the market is inside a breaker, which he calls a bearish environment around levels he states as one fifty-three forty-five to one fifty-three fifty, where he is looking for a reason to expect a bearish move 12:32, 12:58.
On the lower time frame he identifies the pattern retail would see: a low, a lower low and a higher low, which he calls an inverted head and shoulders, with the neckline drawn connecting two levels and the difference measured from the low up to the neckline 13:08, 13:44. He says the stops below would be targeted, and that he would be selling the break above the neckline rather than reading it as bullish — looking for a run into the buy stops above the highs he points to, and then a run below the lows 14:01, 14:27. He describes the result as not a bad little trade at a pip count he lists out himself, and then returns to the daily chart 14:31, 14:41.
He then extends the example to a dated setup, referring to the 15-minute chart creating an inverted head and shoulders on the 18th of October, and says that if price gets above that high he can be a seller because he expects the buy stops to be read by breakout traders as bullish 15:06, 15:37. He offers a choice of reference: using the bodies of the candles, as he says he teaches, identifying the highest body, and giving a level he states as fifty-five point zero two as a sell if price gets above it 15:42, 15:54. From there he describes selling above that level rather than waiting for a pullback to new higher prices, with the objective to cover below the low he identifies as the head, says that happens, and describes another opportunity to cover and one more run above the level for buy stops 16:02, 16:38.
What the lesson asks the viewer to take away
He closes by restating the logic as a rule of thumb. He says you look for the pattern because retail will look for it, but you fade it based on what you see on the higher time frames, looking for institutional order flow to justify why price should be bearish up there and for a reason to be selling rather than buying. He adds the mirror case: if inverted head and shoulders appears on the lower time frames, retail will be all over it looking for bullish upside moves, and that is not what he says he sees. He describes the session as just the beginning of a series on retail-minded classical chart patterns that he expects to fall victim to institutional order flow 16:44, 17:26.
What this lesson does and does not establish
What it establishes is a complete statement of a method: define the classical pattern, note where retail draws it, establish a higher-timeframe premise independently, and when the two conflict, treat the pattern’s break as a liquidity sweep and trade against it, using the pattern’s own high and low as reference points for entries, targets and first profit. That is a coherent idea and it is set out carefully, including the mirrored version for a bearish premise.
What it does not establish is that it works. The lesson contains no trade log, no position sizes, no account results and no sample of outcomes; the pip counts and levels he refers to are his own narration of charts he is displaying, and the review behind this article read the transcript without viewing the recording, so no chart marking, level or fill has been independently checked. The claim that the market designs classical patterns to trap traders is his interpretation of price behaviour, not a demonstrated mechanism. The two examples are 2015-era GBP/USD charts chosen by the presenter, and selected examples cannot show how a method performs across the many occasions when a pattern does not resolve the way he expects. The classical measured-move arithmetic he describes is reported here only as he states it; this article is not teaching it and makes no claim about its accuracy. Third-party ICT material found anywhere other than the publishing channel’s own page — indicator scripts, note packs, re-uploads, transcript packs — is unofficial, has not been tested for this article, and no claim is made about its accuracy or whether it repaints.
ICT Mentorship Core Content – Month 03 – Market Maker Trap Head Shoulders Pattern
The Inner Circle Trader · watch page lists upload 4 September 2022 · 1054 seconds, about 17 minutes 34 seconds. The recording identifies itself as a 2016 mentorship session on false top and bottom patterns, and it is the primary source for every timestamp link on this page.
The recording is not embedded here. An embedded player was tested directly on 15 September 2026 from a BestProps page origin at desktop and mobile widths: the frame loads but then reports “Playback on other websites has been disabled by the video owner”, with no duration and no playback progress, while the video itself is publicly playable on YouTube. No half-working player is left on this page.
Watch the original recording
The two chart walkthroughs in the second half are the part worth watching rather than reading about, because they show which candles and levels he is pointing at. Every timestamp link above opens the recording at the moment referenced so the narration can be checked against the spoken source directly.
Resources
These are the sources checked while preparing this article. The two regulator pages are general material about how chart-pattern and trading-system claims should be assessed; neither evaluates this speaker, tests whether head and shoulders patterns are constructed deliberately, or endorses anything in the recording.
- [1] ICT Mentorship Core Content – Month 03 – Market Maker Trap Head Shoulders Pattern — The Inner Circle Trader (primary source; watch page read 15 September 2026, listed duration 1054 seconds, publicly playable).
- [2] The Inner Circle Trader — official YouTube channel (read 15 September 2026) — the publishing channel for the mentorship series this recording belongs to.
- [3] CFTC — Fraud Advisory: Commodity Trading Systems Sold on the Internet (read 15 September 2026) — notes that technical analysis attempts to predict future price movements from historical prices, price relationships and price trends, and that hypothetical trading results are typically simulations over historical or “real time” computer data rather than executed trades.