
Key takeaways
This module of the Core Content mentorship deals with the institutional sponsorship he looks for in long setups (0:39).
Read the full summary
This module of the Core Content mentorship deals with the institutional sponsorship he looks for in long setups (0:39). He defines it as the willingness to protect an underlying price swing that has a high probability of unfolding (5:15, 5:20), and describes it at another point as large institutions coming in to fund one side of the marketplace (5:31). The criteria are stated as a sequence: first a notation of higher-time-frame price displacement, which he says can take the form of a reversal, an expansion or a return to fair value (0:46, 0:54); then a move to discount or a sell-side liquidity run, which can begin by price going below an old low to run out the sell stops (1:05, 1:09); then short-term buy-side liquidity above the marketplace as the place to pair long exits into, with a London-open or New York-session low for time-of-day context (1:27, 1:40). What he says confirms it is an immediate, dynamic response when price returns to the origin of the move: if the reaction is lethargic he reads that as no institutional orders in the area and says to reduce risk or leave the trade (13:33, 13:37, 13:52). He works the idea through a daily Dollar Index versus yen example, then a four-hour and a 60-minute view of the same swing, marks bullish order blocks with the body of the last down candle plus a small buffer, ties them to the London and New York sessions and to the New York midnight opening price, and closes by saying the destination comes before the order block (40:56, 40:59). The recording is his interpretation of his own charts: it contains no fills, no results and no measurement of the pattern, and the levels below are his reported coordinates.
How we researched this article
BestProps used document-based research from primary firm sources, checked September 24, 2026. The complete source list, scope, limitations, and commercial-state record appear near the end of this article.
In ICT Mentorship Core Content – Month 03 – Institutional Sponsorship, he sets out what he calls institutional sponsorship and how he tries to identify it in setups (0:30). The lesson deals only with long setups, and he says the short-side criteria are simply the same list reversed (4:22, 4:26).
The terminology describes his model of who is on the other side of a chart. He says sponsorship is the impact of large institutions and big equity traders coming in to fund one side of the marketplace (5:31, 5:38), and at one point he puts it as the banks capitalising an old low and buying it again (10:08). A chart on its own does not establish who placed an order, so those attributions are reported throughout this article as his reading rather than as verified participants.
What he says institutional sponsorship is
His definition is at 5:15: the willingness to protect an underlying price swing that has a high probability of unfolding. He gives the same idea in plainer terms when he describes it as the impact of large institutions coming in to fund the side of the marketplace the trader anticipates (5:44), and he presents the whole exercise as looking for repeating fingerprints of that behaviour on higher-time-frame setups (5:06).
The long-side criteria he lists
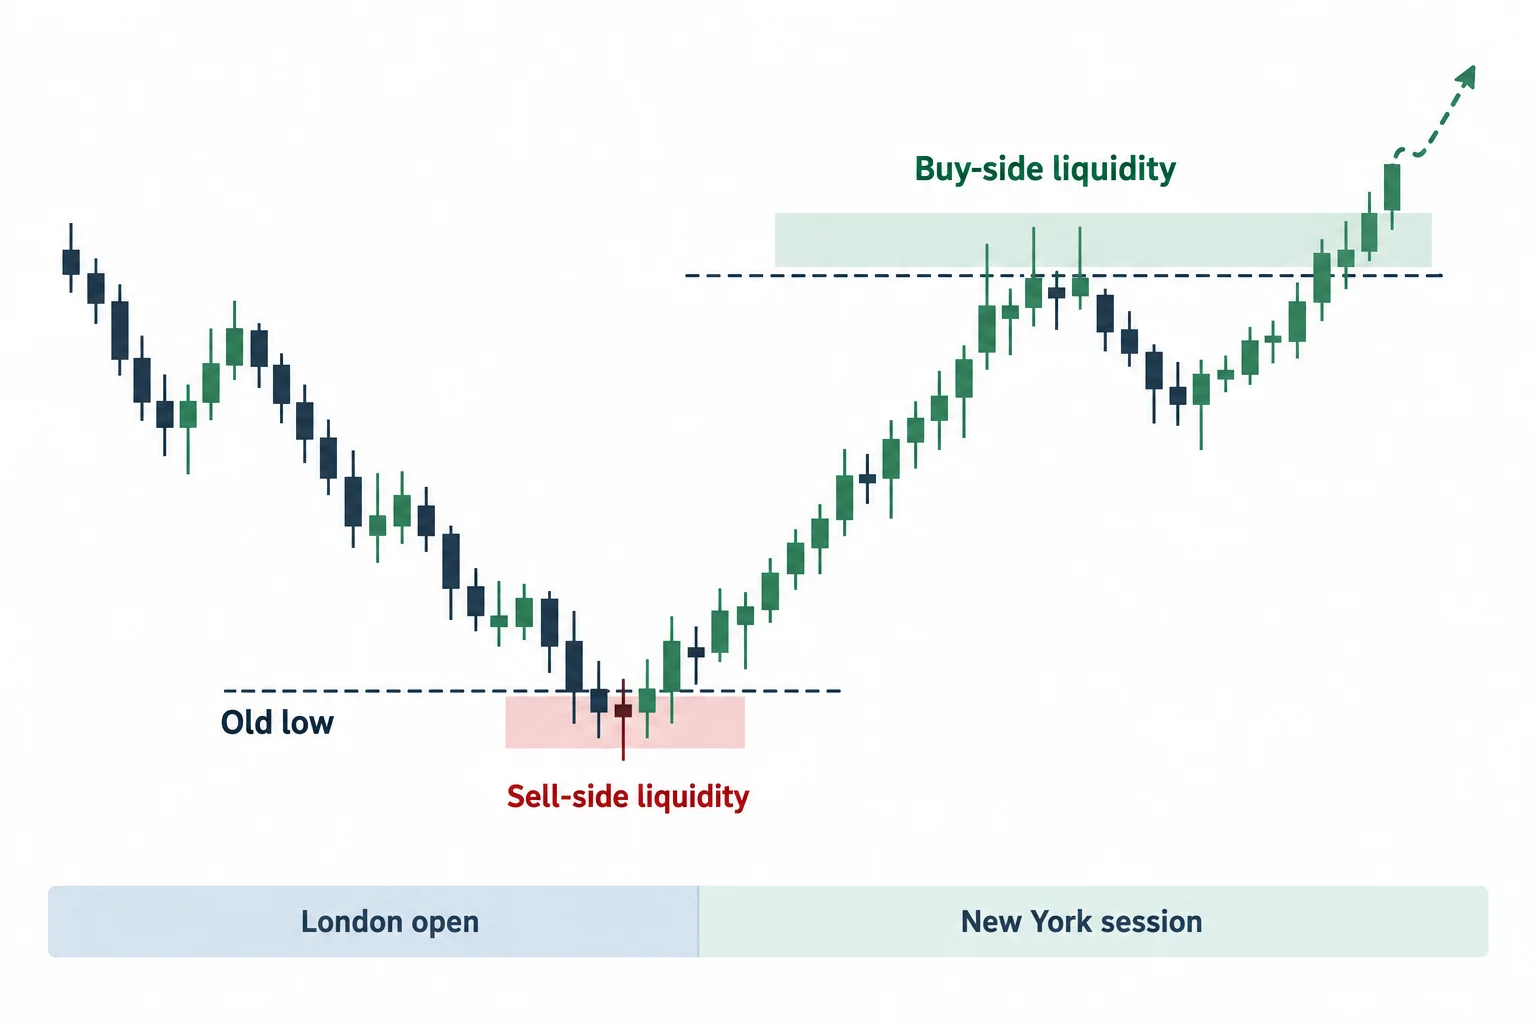
The criteria are introduced as a numbered set at 1:48. The first is the notation of higher-time-frame price displacement (0:46), which he says can come as a reversal, an expansion or a return to fair value (0:54). The second is a move to discount, or a sell-side liquidity run (1:05) – price retracing, or beginning by going below an old low to run out the sell stops (1:09). Then, in his words, the actual sponsorship shows up by attacking the marketplace for the buy-side liquidity resting above it (1:59, 2:06). He says he is looking for short-term buy-side liquidity above the market as the place to pair long exits into (1:27, 1:31), and he notes the buy stops will be layered through the marketplace, which is why he reads them on a higher time frame (2:37). Time-of-day context is the last input: a London-open or New York-session low formation (1:40, 1:45), with London open, New York session, London close and sometimes Asia named as the windows he trades (3:07).
The short-side mirror he states
Before the examples he states the reverse case briefly (3:27): higher-time-frame price displacement, this time as a reversal, expansion or return to fair value (3:36); a move to premium or toward the buy-side liquidity to run the buy stops (3:44); and short-term sell liquidity below the market as the place to pair short exits to cover (3:55, 4:00), with a London-open high of day or a New York high formation for timing (4:15). He then says the rest of the lesson works only the long side, and that everything in the examples would simply be reversed for the short criteria.
The market-maker framing behind it
The perspective he asks for is the one he calls the market-maker or role-playing model (2:06). In his description the exercise is to sell high and find buyers willing to buy higher (2:31), so as a market maker selling into the market he watches the stops that sit below an old low and takes the other side of them (10:53): if they are willing to buy those sell stops, his inference is that they are building a net long book (11:11), and he calls the resulting setup a low-risk, high-probability long scenario (11:19). That inference from stops to positioning is his interpretation of price, not something the recording measures.
The daily example: dollar-yen
The worked example opens at 4:45 on a daily chart of Japanese yen, rendered in the transcript as US dollar versus yen (4:49, 4:49). He says the sample was chosen as an ideal scenario rather than cherry-picked, and that traders can find the same conditions on their own charts (5:03).
What he points to first is price dropping below an old low (6:14), which he describes as where sell stops reside, or in his language a liquidity pool (6:18, 6:23, 6:38). He is explicit that these are traders exiting longs rather than opening shorts – the market is protecting long positions, and the stops are where the crowd puts its exits (7:08). He adds that an aggressive trader can drop to a lower time frame when that low is violated and look for the same pattern, because in his words price is fractal (7:14, 7:24).
Then he maps where a move could go (8:39): short-term highs, a large candle, and an old high, including the possibility of running relatively equal highs (8:59). At 9:20 he identifies the potential bullish order block, at 9:27 he says what rests above an old high is buy stops, and at 9:35 he marks the last down candle. Price reaches that area and pokes just below the old low one more time (9:43), which is the point at which he says he is anticipating that the low will be protected (9:52). He identifies a range above as a liquidity void and calls the pool above the old high buy-side liquidity (10:18, 10:26), adding that he will keep the classification simple rather than bring open float into a higher-time-frame discussion (10:47).
He is candid about the example: he says price did take off and fill the void, but that a reader may not have caught the trade as described because the walkthrough has the benefit of hindsight (11:40, 11:52). The only numeric level he names in the daily pass is the small buffer he adds to the order block level, which he puts at five pips in the lower-time-frame walkthrough (32:54). No trade result is claimed from the example.
Why the daily chart, and where the move began
He argues that the displacement itself is the evidence. What he looks for is higher-time-frame price displacement in price (12:03, 12:11), which he reads as clear evidence that a large entity entered the marketplace (12:13), reasoning that a daily chart will not move that way without sponsorship behind it (12:20, 12:20). His stated reason for working from the daily chart is that this is where the banks trade from (12:33).
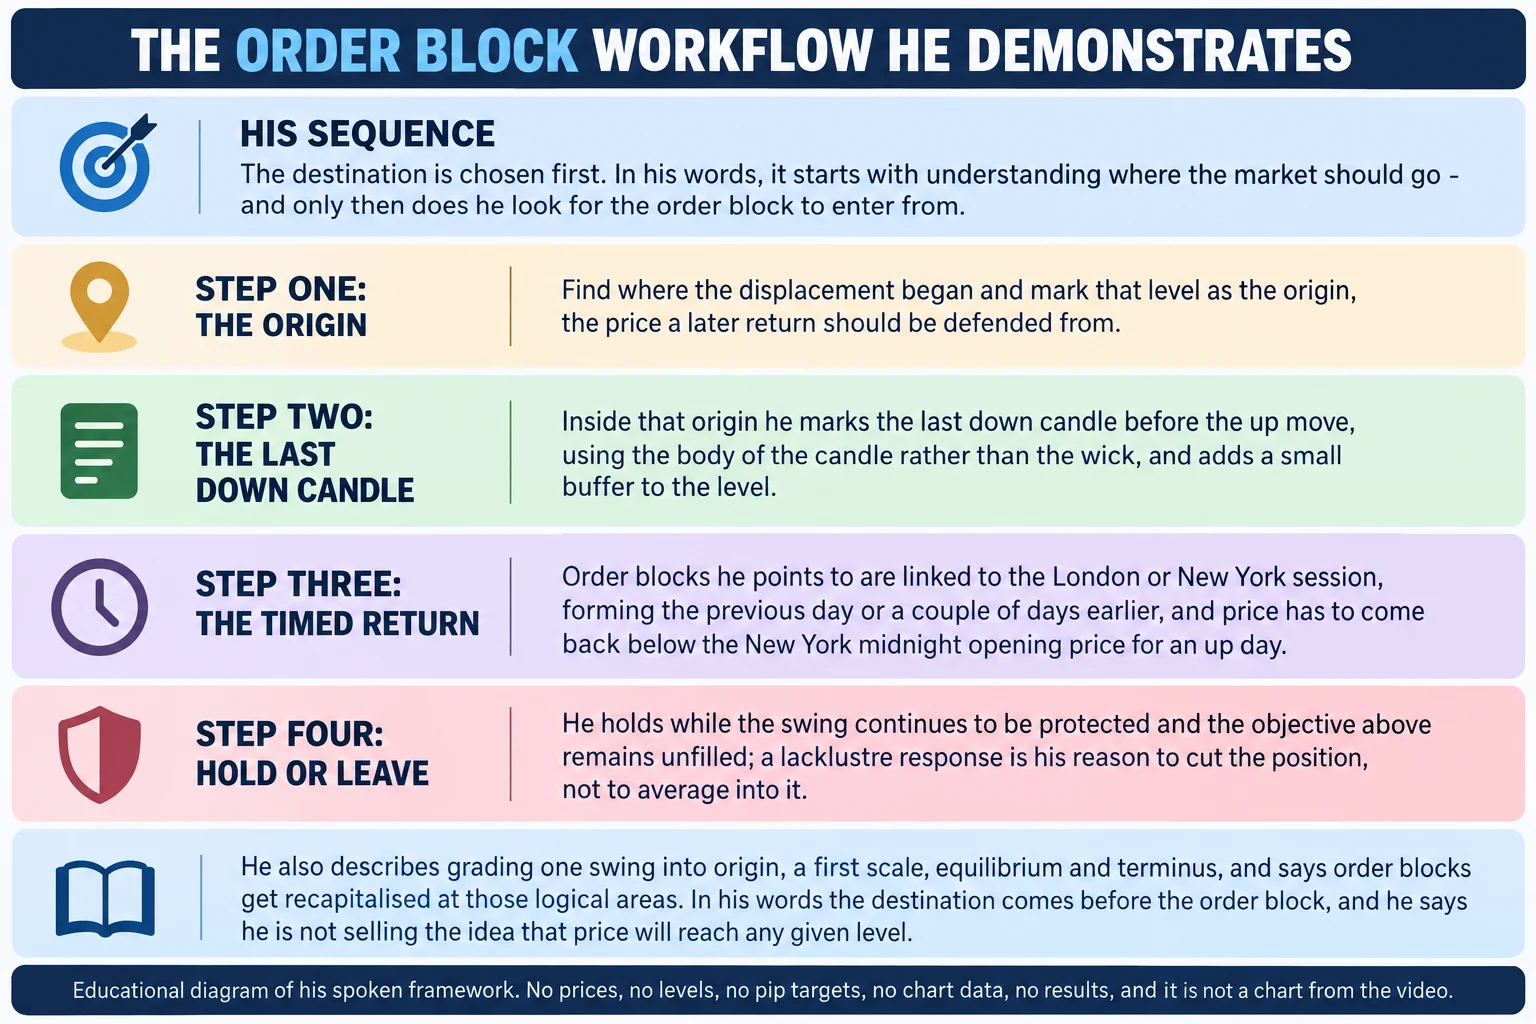
From there the method runs backwards to the origin (12:49): the displacement has to have a root price level he can classify as the sponsorship level (12:52, 12:59). The entry area is the bullish order block, which he takes from the last down candle using the body rather than the wick (13:12, 13:16). And the condition that matters when price returns there is the quality of the reaction (13:33): if it is lethargic, he reads that as no institutional orders in the area (13:37, 13:45), and his instruction is to reduce risk, cut the position in half or leave it, because the trade can be re-entered later (13:52). He sums the idea up with the child-pool analogy he says he gave on his tutorial page: a large body entering a small pool displaces the water over the brim, and price surging off the level is the same kind of evidence of size (16:17, 16:51, 16:58).
The four-hour and 60-minute views of the same swing
He then transposes the idea to lower time frames (24:15). On the four-hour chart the same fractal idea appears – price trading below an old low and rallying off it (24:20) – and he identifies what those down candles create: down price at an anticipated level of support is a bullish order block (24:46, 24:53). He says that each time the market takes out a level of buy-stop liquidity he does not collapse the trade or hunt reversal patterns and indicator divergences at the old high; he looks for the willingness to keep going for the longer-term stops (25:28, 25:40), and he describes price surging through the second level of buy-side liquidity without returning to the old high as what he calls classic price action (26:20).
On the 60-minute chart (28:59) he draws attention to reactions at what he calls the super-secret-sauce line segments (28:59, 29:06). He says those lines do two things: they indicate possible future direction and they give what he calls a prognostication for where setups may unfold later (29:37). What the lines actually mark, when he explains them, is the opening price at midnight in New York (31:11), and he stresses that he is marking old highs rather than giving out price numbers, so the reader focuses on price action and delivery (29:37).
The timing rule is stated plainly: if he suspects price is going to be bullish, price going below that midnight New York opening price is where he expects it to be accumulated (31:11, 31:38). He then walks day by day – each day opening, trading lower into an order block and rallying – and identifies where sponsorship steps in each time (32:24), with the first order block snapping to the level and a small buffer added to it (32:46, 32:54). He also notes a down candle at the opening price and says the signal is that the down candle gets violated to the upside, which is what makes it a bullish order block (34:54), adding that the down candle being used can come from the previous session or day (33:48).
Power of three and the daily bar
At 35:21 he names the concept he is applying: power of three, described as the idea of trading the daily open, high, low and close bar. If the aim is to capture the bulk of a daily range, he says the trade is to buy near or below the opening price on an up day and exit on the close (35:53), and he says his version of the concept is exactly that – buy near or below the opening price and let the range expand into a higher close (35:53). He also says the difficulty is not in understanding the idea but in executing it, which he puts at 99% of people not knowing how.
How he grades the swing, and why the low is defended
What he says he is watching above is the move being drawn up to the first old high (36:36), with stops above old highs being the fuel – sellers shorting what looks like resistance, their buy stops resting above it, and 36:54 the level being run through. He then grades the whole swing rather than a single level: origin, a midway point he calls equilibrium, another stage, and the terminus or objective (22:13, 22:36), and at 27:53 he notes where price had reached on the daily chart in that framework. The point he keeps returning to is unwillingness rather than a drawing: the read is that price is not being allowed lower (27:21), which he treats as the sponsorship itself.
He also states the consequence for a retracement: because the old high has been cleared, market structure on the daily chart has changed to bullish in his model (21:30), so he expects the original low to be protected (21:41) and any pullback to go back to logical areas rather than the origin (37:34, 38:19). He also notes that repeated down candles on a 15-minute time frame build a larger order block on a higher time frame (39:00), and that the blocks being recapitalised are ones from the previous day or a few sessions earlier (40:02).
The closing instruction
He closes by tying every order block in the lesson to a session: they are linked to a London or a New York session, formed the previous day or a couple of days earlier, and he says the idea is that they should be capitalised again because there is an underlying interest in seeing price higher (41:39, 41:51). His advice is to focus on those London and New York blocks and use the down candles in the previous sessions for new buying opportunities (42:27), and he says that if that is happening on the chart, the trader is seeing and identifying institutional sponsorship (42:41). He goes further and calls it the hallmark of every successful trade in his own experience (42:45), while also saying he does not want to sell the idea that price will reach any given level (43:14) and that if a trader is not seeing it, they are probably offside and should reduce risk or step aside (43:41). He signs off wishing the viewer good trading (43:51).
What the recording establishes and what it does not
What the recording contains is his framework, one worked daily example with the same swing then shown on four-hour and 60-minute charts, and his explanation of why he reads those reactions as sponsorship. It does not contain order fills, position sizes, account results or win rates, and it does not measure whether the pattern works. He does not name any price level for the daily example, and the one numeric figure he does give is the five-pip buffer he adds to an order block level; the charts in this recording were not viewed for this article, so every level, formation and reaction described above is reported from his narration of them. He also does not define how much displacement is enough, how far below an old low price must run, or how immediate a reaction has to be before he counts it as dynamic, and none of those tolerances are invented here.
There is a further limit on the argument itself. The step from an observed reaction to the conclusion that banks are defending a level is an inference about participants that a price chart cannot confirm, and he presents it as the market-maker perspective he teaches rather than as evidence. Nothing here should be read as verified profitability, as a recommendation to copy a trade, or as a claim that the pattern predicts price.
Date and identity note
He places the material by reference to the earlier content rather than by date: the September content is what he points the viewer back to when describing the bullet points to look for on a price chart (8:23), and he refers to the child-pool analogy as something he gave in a teaching on his tutorial page (15:31). The transcript does not state a calendar year or a month for this recording, and none is inferred here. The examples are worked on daily, four-hour, 60-minute and 15-minute charts of a yen pair without giving calendar dates for the bars. The watch page lists the upload as 2 September 2022, the date this recording was published to YouTube; it is not the date of the market activity shown in the charts.
A note on the transcription
The source for this article is the full original audio of the recording, transcribed locally with the whisper-large-v3-turbo automatic speech recognition model. It is automatic transcription, not human-verified captions: the cached source records a complete decode of the full audio, but automation still mishears words and it cannot see the charts. That is why his terms are explained where he explains them – the transcript renders one instance of turtle soup phonetically – and why no level, formation or result is asserted that the audio does not support. The recording is public and playable on YouTube; it is not embedded on this page because the video owner has disabled playback on other websites, which was tested directly – see the card below.
ICT Mentorship Core Content – Month 03 – Institutional Sponsorship
The Inner Circle Trader · watch page lists upload 2 September 2022 · 2635 seconds, about 43 minutes 55 seconds · public, not unlisted. The recording works a daily, four-hour and 60-minute example on a yen pair and refers back to the September content. This recording is the primary source for every timestamp link on this page.
The recording is not embedded here. An embedded player was tested directly on 15 September 2026 from a BestProps page origin at desktop and mobile widths: the frame loads and then reports “Playback on other websites has been disabled by the video owner”, with no playable stream and no duration reported in either case. The link above opens the recording on YouTube itself.
Resources
These are the sources checked while preparing this article. The ICE page is the exchange’s own contract overview for the U.S. Dollar Index futures market, and the two CFTC pages are the regulator’s advisories on forex fraud and on trading systems and hypothetical results. None of them evaluat