
Key takeaways
This is the second teaching of the third month of the ICT Mentorship, and his subject is institutional order flow — which he defines not as a volume indicator but as the market seeking the largest pool of institutional liquidity 0:33, 2:57.
Read the full summary
This is the second teaching of the third month of the ICT Mentorship, and his subject is institutional order flow — which he defines not as a volume indicator but as the market seeking the largest pool of institutional liquidity 0:33, 2:57. He frames the exercise as thinking like a market maker: ask where the maximum liquidity sits relative to where the market has traded from and where it is now 2:53, 3:07. His reading rule is to work from the bodies of the candles rather than the wicks, which he calls the interbank volume, and to treat the wicks as retail pricing and extreme delivery 6:12, 6:35. The workflow runs monthly, then weekly, then daily: he says the biggest moves are found on the higher time frames because that is where the large funds are, and that the daily chart will always seek that fund-level order flow 28:19, 28:09. He works through historical EUR/USD from roughly mid-2008 to mid-2012, and every level, number and market reaction in that walkthrough is his own reading of a chart he was displaying 12:25, 20:24. The lesson contains no trade log, no position sizes and no account results.
How we researched this article
BestProps used document-based research from primary firm sources, checked September 25, 2026. The complete source list, scope, limitations, and commercial-state record appear near the end of this article.
This page covers ICT Mentorship Core Content – Month 03 – Institutional Order Flow, a recording published by The Inner Circle Trader. He identifies it near the start as the second teaching of the third month of the mentorship, and says it builds on the lesson immediately before it using the same euro-dollar example 0:27, 0:41, 1:50.
One boundary matters before the detail. Everything in the walkthrough — the monthly, weekly and daily levels, the liquidity it is said to be reaching for, and the described reactions — is his narration of charts he is displaying in the recording, and the transcript behind this article is an automatic transcription of the audio rather than human-verified captions. No chart marking, level or market reaction has been independently verified for this page, and nothing in the lesson constitutes a test of the method.
What he means by institutional order flow
He sets the definition up as a way of thinking rather than an indicator. For his notes, he says, the idea is to adopt a market-efficiency paradigm and imagine yourself as the market maker; the question you are asking is where the maximum level of liquidity sits in relation to where the market has traded from and where it is presently 2:47, 2:53, 2:57, 3:07. He applies that to the monthly chart in front of him: because price has already traded higher and closed back inside an earlier range, he reads the market as having rebalanced, and from there he looks for where it will reach next 3:07, 3:17, 3:47.
The rest of the lesson is that single question applied repeatedly, and it is worth being clear about what it is and is not. He is describing a way of anticipating where price may travel based on where he believes resting orders sit; he is not showing order-book data, position records or any measurement of actual institutional activity. The location of the large liquidity pools is his inference from the chart, presented as his interpretation of price delivery.
Why he reads the candle bodies, not the wicks
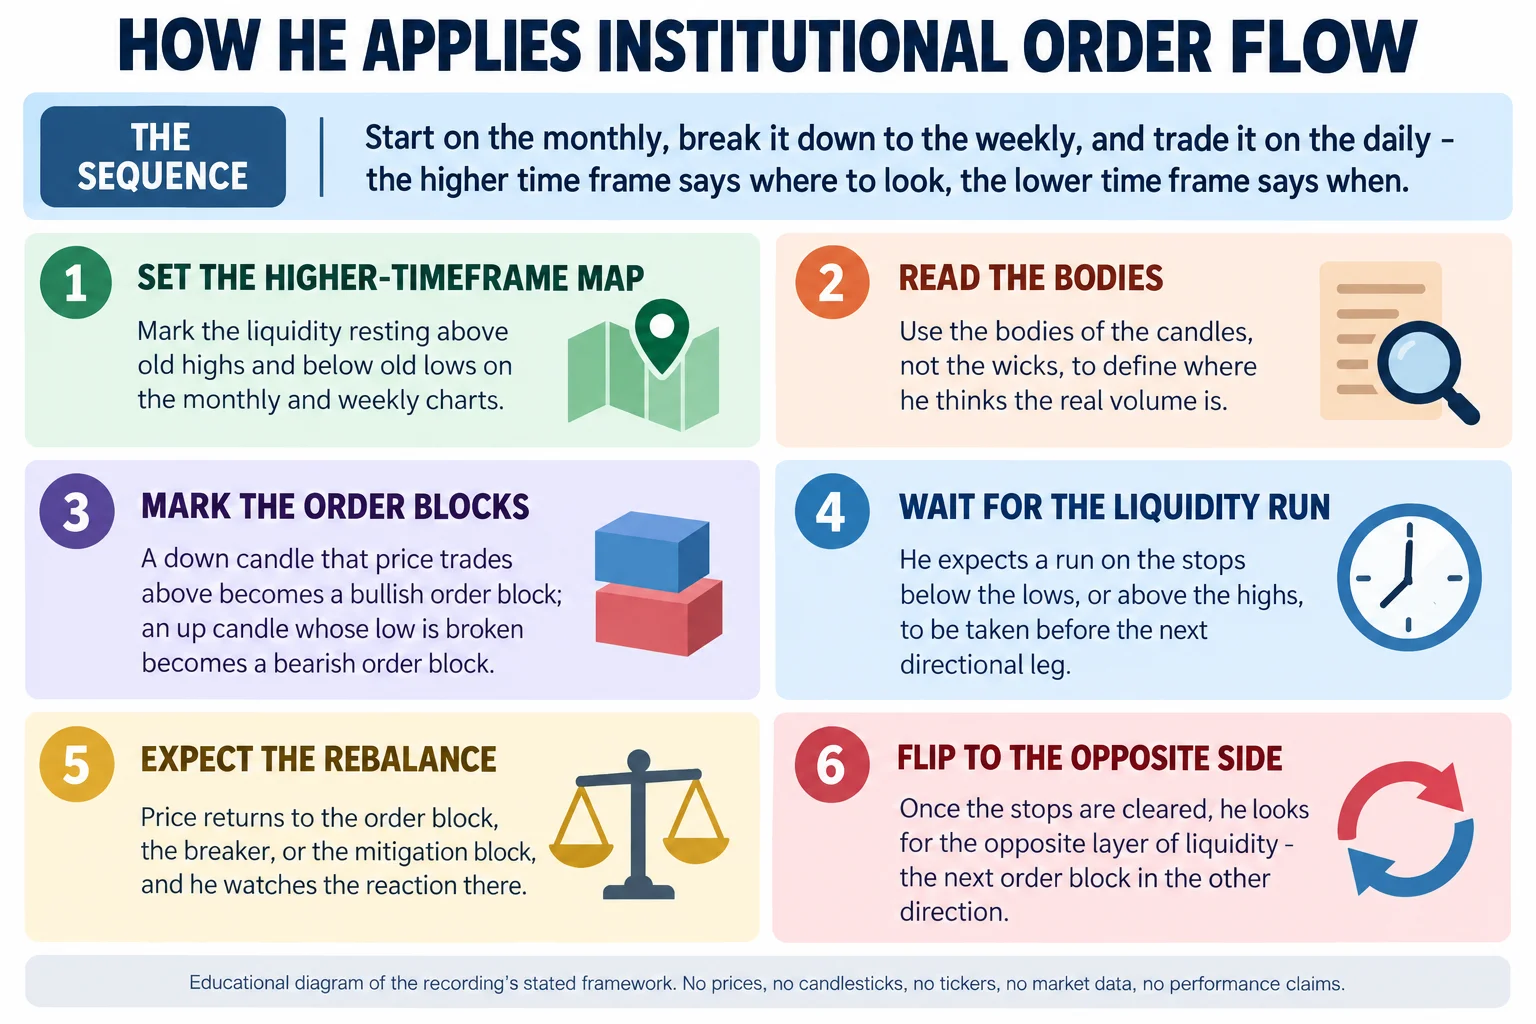
This is the most concrete instruction in the lesson. He contrasts it with what he calls classic technical analysis, which would say the wick is the low; what he teaches instead is that the bodies of the candles are where all the volume is 6:03, 6:12. In his framing the wick is directly related to retail order flow, including retail stops, because most viewers are looking at a retail platform, while the bulk of the bodies is closer to what he calls interbank prices 6:17, 6:22, 6:35. From that he concludes the wicks supply erroneous or extreme price delivery, and that most of the analysis should be done around the bodies 6:42, 6:50.
He makes the rule practical rather than absolute. What matters, he says, is that price reaches below the bodies of the candles — it does not have to trade through the wicks themselves 11:39, 11:41. He also allows for the broker: he says he has taught for six and a half years online that you have to accept price running further than you expect because brokers widen the spread 5:17, 5:33. His reference point for the refinement is the mean threshold, the middle of the relevant candle, which he says the bodies repeatedly respect 5:04, 5:07.
The claim that bodies carry institutional volume while wicks are retail pricing is his interpretation of what a candlestick represents. It is not demonstrated in the lesson with transaction-level data, and it is reported here as his stated reasoning rather than as an established market fact.
Monthly to weekly to daily: how he applies it
The workflow is deliberately narrow. While his read of institutional order flow is bearish, he says, all he does is internalise the marketplace, and having set it up on the monthly chart he simply breaks the market down into a weekly chart and then into a daily 11:44, 11:49, 11:55, 21:40. On the weekly he maps the alternation of selling and bullish and bearish market conditions across the period 12:02, 12:10. He says this is how he has mapped the whole euro-dollar stretch from mid-2008 through to mid-2012, purely from the monthly levels 12:25.
He states the purpose of the top-down order plainly: the higher time frame supplies the reference and the lower time frame is where it trades. His instruction is to find the levels on the monthly and weekly charts, keep them on the daily chart, and transpose them down 28:19, 28:54, 29:07. In the daily walkthrough he also names a timing condition: having reached a level where he expects buying, he says he still waits for price to break above a short-term high before treating buyers as active 22:51, 22:54, 23:00.
Order blocks, breakers and mitigation blocks
His vocabulary is specific, and he uses it consistently in the walkthrough. A down candle that has already been traded through and then returned into is a bullish order block; the mirror case, an up candle the market drives away from, is the bearish order block 15:35, 17:31. He traces the downside sequence in the euro-dollar chart from a bearish order block that price returns to and immediately sells off from, and from there asks what the order flow is reaching for: the stops below 15:44, 15:46, 15:48.
Two other terms appear and are worth keeping separate. He calls a retraced down candle a breaker, and explains it as breaking the highs where the initial sellers would have their buy stops resting before price continues lower 14:40, 14:44. Later he describes a wick down to the body of a candle as a mitigation block, and explains the purpose as letting existing short positions be taken off 19:07, 19:12, 19:35.
The euro-dollar walkthrough, 2008 to 2012
He opens with the monthly levels from the example in the previous lesson, reading the open as 151.97 and the low as 51.45 and then correcting himself on the high, which he gives as 51.51 and 51.43 before calling the area very sensitive 0:59, 1:10. From there he describes a large pocket of sell stops resting below the lows, and treats the wicks as no significant barrier to what he expects 2:24, 8:48, 8:53.
The walkthrough then repeats one pattern for several swings: the market runs the stops on one side, returns into the relevant order block, and reaches for liquidity on the opposite side, with the directional label swinging as it goes 9:58, 10:09, 10:15, 10:35, 17:17. In one daily passage he reports a candle low at 21.51 sitting inside a down candle, with two candles wicking into it, and reads it as price being bought 17:56, 18:04, 18:16. He gives further daily readings with a high at 28.02 against a low of 27.95, and a high of 34.36 against a low of 34.23 22:18, 23:34, 23:37. Near the end of the sequence he describes price trading below 46.26 into another order block 24:49.
Every one of those numbers is as spoken in an automatic transcription of the audio and reported here the same way. They are not verified chart values: he is reading them off a chart that this review did not view, and a speech-recognition transcript can mishear digits. They are reproduced because they are how he describes the sequence, not because they have been checked.
His explanation of why the pattern repeats is the part that reaches furthest. He says the selling is undoing the buys that were placed earlier, that this is unwinding the longs, that everything at the bank level is a hedge, and that the bank can hold a net bearish book and still be buying while price falls, which is why the earlier long orders have to be taken off 15:54, 16:02, 16:05, 16:28. He names the resulting structure a micro maker sell profile and lists its stages as consolidation, return to consolidation, accumulation, reaccumulation, a smart money reversal, a low-risk short and redistribution 16:53, 16:59, 17:06. He also explains the purpose of the stop run in the same terms: the up candle was used to get sellers positioned below the market with sell stops, because those sell stops become market orders that someone has to be the buyer counterparty to 18:44, 18:49, 18:53.
That account of hedging, bookmaking and counterparty behaviour is his explanation of the chart. The lesson supplies no bank position data, no order flow records and no evidence about who traded what, so it is reported here as the model he applies rather than as verified institutional behaviour.
Why he says the higher time frames matter
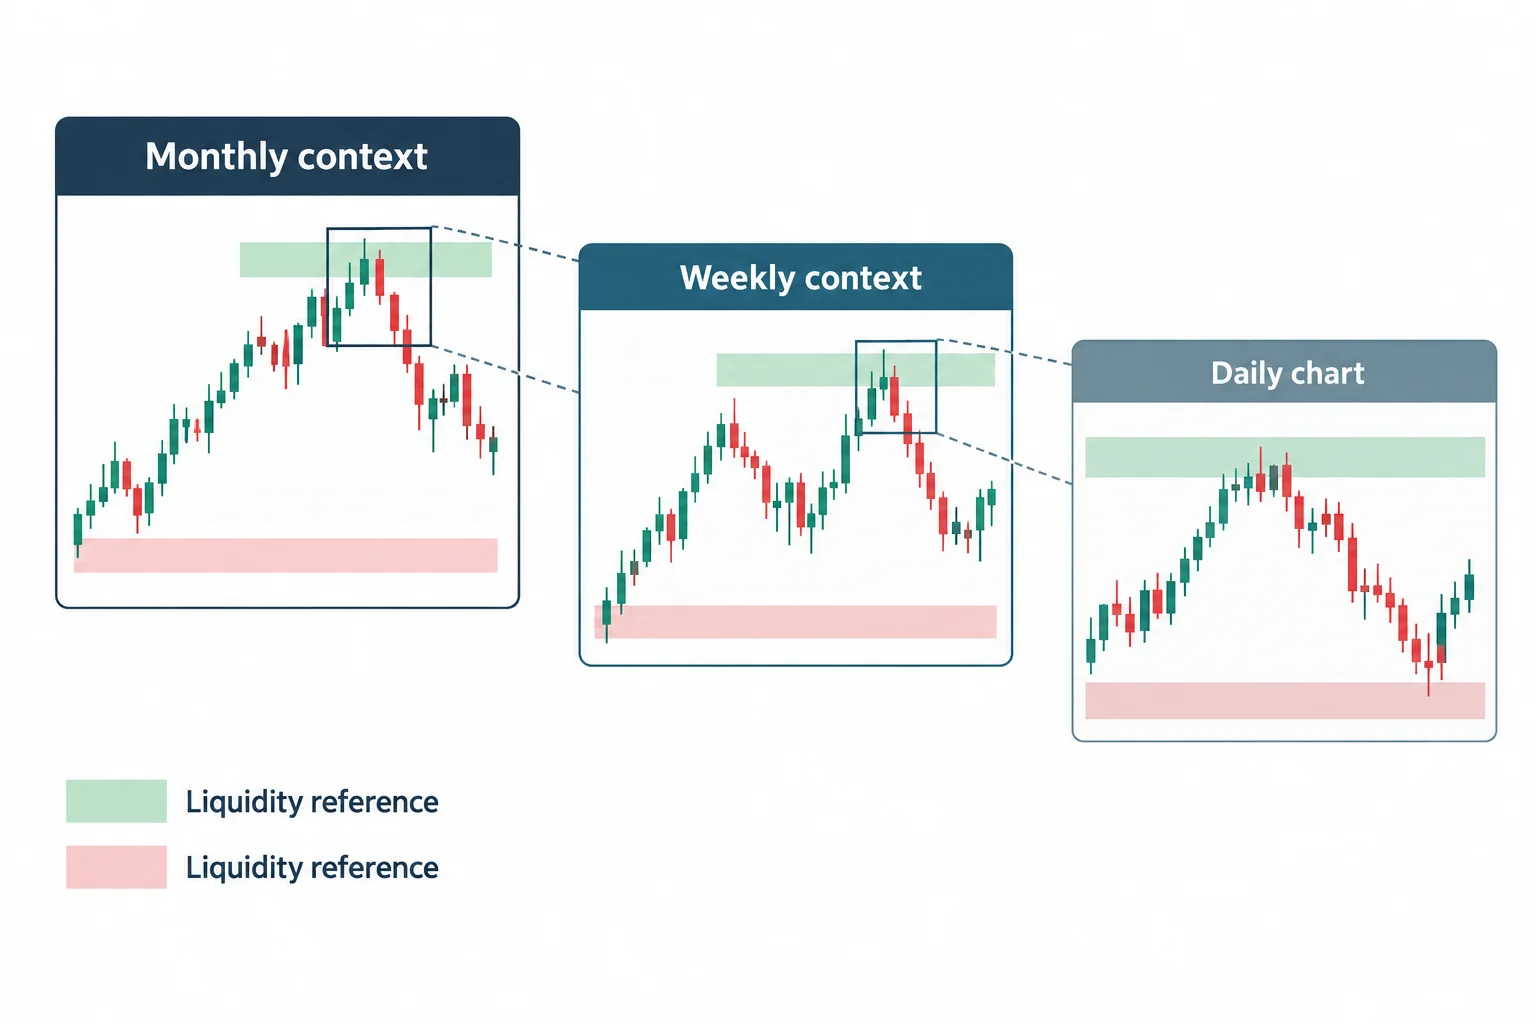
He closes by restating the concept and the reason behind it. Institutional order flow, he says, is the seeking of large institutional liquidity, it is found on the monthly and weekly charts, and it is traded into on the daily — the daily chart, he says, will always seek the fund-level order flow 27:53, 27:58, 28:09. The signals with the greatest magnitude and the biggest moves, in his account, are found on the monthly and weekly basis because that is where what he calls the whales are, and he is explicit that by whales he means big funds 28:19, 28:21, 28:26, 28:30. His reason for the higher time frames is scale: the banks cannot counterparty with an individual trader, he says, because the size is not there, whereas the funds control billions 28:40, 28:45.
He ends on what the approach is for. If you keep the monthly and weekly levels on your daily chart, he says, you will see the major price shifts coming by transposing them down rather than recognising them after the fact 28:54, 29:07. Knowing where the liquidity sits above and below the market, in his description, tells you what price should be reaching for whether you expect a bullish or a bearish scenario 29:24, 29:38. His final point is about whose orders are involved: it is not retail liquidity or retail stops the market is looking for, and the market goes to those levels to take participants out of the marketplace or draw them in as counterparties, either as a buyer counterparty to sell stops or a seller counterparty to buy stops 29:54, 30:06, 30:11, 30:22.
What this lesson does and does not establish
What it establishes is a fully specified chart-reading routine that can be written down and applied without any proprietary tool. There is a defined starting point on the higher time frame, an explicit reading rule for bodies versus wicks, a named catalogue of structures — bullish and bearish order blocks, breakers, mitigation blocks and the mean threshold — a stated order of time frames from monthly to weekly to daily, and at least one timing condition in the form of waiting for a short-term high to break 6:03, 11:41, 14:40, 19:12, 22:54. For a viewer who wants a structured way to organise higher-time-frame levels before a session, that structure is the deliverable.
What it does not establish is that the levels work or that the institutional story behind them is true. The lesson contains no trade log, no position sizes, no account results and no sample of outcomes. The euro-dollar levels and reactions are his own narration of a historical chart displayed in a recording published in September 2022, and the review behind this article read the transcript without viewing the recording, so none of them have been independently checked. The claims that candle bodies carry interbank volume while wicks are retail pricing, that the daily will always seek fund-level order flow, that the market goes to these levels specifically to reach large-fund orders, and that participants are drawn in as counterparties are all his interpretation of price delivery; the lesson offers no order-book, position or fund-flow data in support, and they are reported here as his view. Two features of the phrasing are worth flagging rather than smoothing over: he describes the method as the recipe and says this is the secret, while also saying the same element simply repeats itself, and he is explicit that the higher time frames matter because of the size of the participants he believes are there 12:50. Both are his framing of the method’s value rather than demonstrated results. Third-party ICT material found anywhere other than the publishing channel’s own pages — indicator scripts, note packs, re-uploads, transcript packs — is unofficial, has not been tested for this article, and no claim is made about its accuracy or whether it repaints.
ICT Mentorship Core Content – Month 03 – Institutional Order Flow
The Inner Circle Trader · watch page lists upload 1 September 2022 · 1832 seconds, about 30 minutes 32 seconds. The lesson identifies itself as the second teaching of the third month of the mentorship, and it is the primary source for every timestamp link on this page.
The recording is not embedded here. An embedded player was tested directly on 15 September 2026 from a BestProps page origin at desktop and mobile widths: the frame loads but then reports “Playback on other websites has been disabled by the video owner”, with no duration and no playback progress, while the video itself is publicly playable on YouTube. No half-working player is left on this page.
Watch the original recording
The chart work is the part worth watching rather than reading about, because the method depends on seeing which candles he selects and where he places the bodies of the range. Every timestamp link above opens the recording at the moment referenced, so the narration can be checked against the spoken source directly.
Resources
These are the sources checked while preparing this article. The two regulator pages are general material about how technical-analysis claims and short-horizon trading are described by public authorities; neither evaluates this speaker, tests the routine in the recording, or endorses anything in it.
- [1] ICT Mentorship Core Content – Month 03 – Institutional Order Flow — The Inner Circle Trader (primary source; watch page read 15 September 2026, listed duration 1832 seconds, publicly playable).
- [2] The Inner Circle Trader — official YouTube channel (read 15 September 2026) — the publishing channel for the mentorship series this recording belongs to.
- [3] CFTC — Fraud Advisory: Commodity Trading Systems Sold on the Internet (read 15 September 2026) — states that technical analysis attempts to predict future price movements based on historical prices, price relationships and price trends, and warns that hypothetical trading results are typically simulations over historical data rather than executed trades.
- [4] Investor.gov (U.S. SEC) — Day Trading (read 15 September 2026) — describes day traders as rapidly buying, selling and short-selling throughout the day over very short holding periods and states that day trading is extremely risky and can result in substantial financial losses in a very short period of time; relevant to the discretionary, level-based trading described here.
A note on the transcription
The narrative above was written from an automatic speech-recognition transcript of the full original audio, not from human-verified captions, and the review did not watch the recording. That distinction matters most for the numerical levels, because this is a lesson built on a presenter pointing at specific candles while he speaks. The transcript is internally consistent and the recognition produced no low-confidence segments, which is why the levels are reported at all, but they remain the transcript’s rendering of spoken words rather than verified chart values. A few passages are unclear as transcribed and are handled deliberately rather than smoothed over. Early on he states the monthly open as 151.97 and the low as 51.45, then corrects himself mid-sentence on the high, giving 51.51 and then 51.43, so neither reading is presented here as the definitive level 0:59, 1:10. In the daily work he reports two candles wicking down into a down candle and gives that candle’s low as 21.51 while remarking that it is hard to see 17:56, 18:04. The terms he uses for recognised structures also arrive in forms a listener has to normalise: he describes a wick down to the body as a mitigation block and names the pattern a micro maker sell profile, and the transcript renders some of the surrounding explanation loosely, so those renderings are flagged here rather than presented as exact quotations 16:59, 19:12. Nothing in the chart discussions has been verified against the recording, because the charts themselves were not viewed.
Source: ICT, ICT Mentorship Core Content – Month 03 – Institutional Order Flow, The Inner Circle Trader, watch page upload date 1 September 2022; the lesson presents itself as the second teaching of the third month of the mentorship. Local automatic s