
Key takeaways
ICT Mentorship Core Content Month 03 Institutional Market Structure presents a November 2016 forex framework comparing every Dollar Index swing with an inversely moving foreign currency pair.
Read the full summary
ICT Mentorship Core Content Month 03 Institutional Market Structure presents a November 2016 forex framework comparing every Dollar Index swing with an inversely moving foreign currency pair. Symmetry means a USDX lower low against a pair higher high, or a USDX higher high against a pair lower low, which ICT treats as trend confirmation and a reason to avoid reversals. USDX SMT divergence, expanded as smart money tool or smart money technique, occurs when either market fails to form the expected opposite extreme and is treated as a high probability reversal condition. Two 2016 GBP/USD cable examples show pair higher highs without corresponding USDX lower lows, interpreted as dollar accumulation and cable distribution, with reported coordinates of 47.60, almost 50.65, and a potential USDX bullish order block around 93.80 to 94. The lesson demonstrates a custom Dollar Index line overlay on MT4 and applies daily-chart bias through 60-minute or four-hour bearish order blocks or shorts above the New York midnight opening price. The public YouTube recording runs about 20 minutes 36 seconds and was uploaded 3 September 2022, but it provides no fills, position sizes, results, win rates, divergence measurements, or objective swing-selection rules, so its smart money and profitability claims remain unverified interpretations.
How we researched this article
BestProps used document-based research from primary firm sources, checked September 24, 2026. The complete source list, scope, limitations, and commercial-state record appear near the end of this article.
In ICT Mentorship Core Content – Month 03 – Institutional Market Structure, he sets out a comparative method for currencies built on the Dollar Index (USDX) and a foreign-currency pair. His central claim is that related markets should generally produce corresponding swings, and that when they do not, the disagreement itself is the information: he reads it as relative strength or weakness and turns it into a directional narrative.
The lesson is presented as his interpretation of intermarket price action. Terms such as smart money, accumulation, distribution and manipulation describe his model. The transcript does not independently establish institutional activity, does not demonstrate that the method is profitable, and does not supply fills or results, and this article repeats none of that as fact.
What ICT Institutional Market Structure Means
At 0:43 he defines it as the analysis of correlated assets with a relationship to inversely correlated assets, and at 0:49 he gives the purpose: to determine what the smart money is accumulating or distributing. He says currencies are the easiest market to analyze this way and that the tool he uses is the Dollar Index (1:01).
The mechanics are at 1:24: every price swing in the index is compared with the foreign currency being traded, and at 1:12 he says every swing should be studied to see whether market symmetry confirms it. For a pair quoted against the dollar, the relationship he states is:
- As the Dollar Index trades higher, he reasonably expects a lower price swing in the foreign currency pair (1:33).
- As the Dollar Index trades lower, he reasonably expects a higher price swing in the pair (1:50).
- If the index or the pair fails to move symmetrically, he says the smart money is actively trading (1:41).
How Market Symmetry Shapes ICT Structure
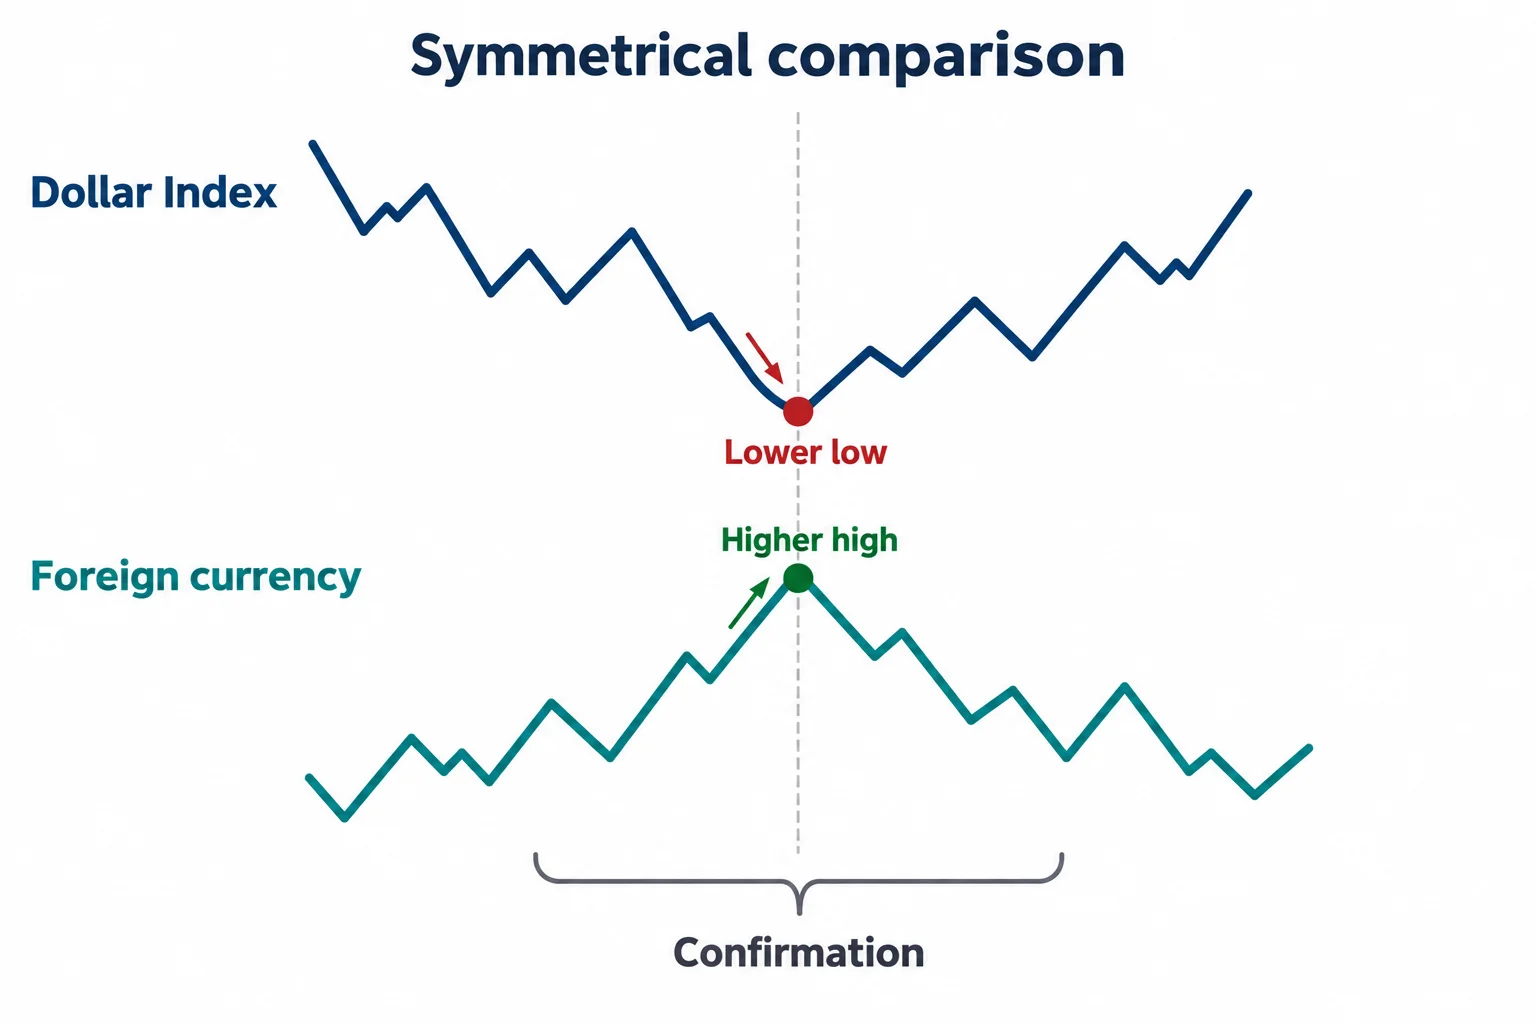
At 2:10 he moves into the detail and introduces the label he uses for the failure case: US Dollar Index SMT divergence, expanding SMT at 2:14 as smart money tool or smart money technique. The divergence is looked for between closely correlated or inversely correlated assets.
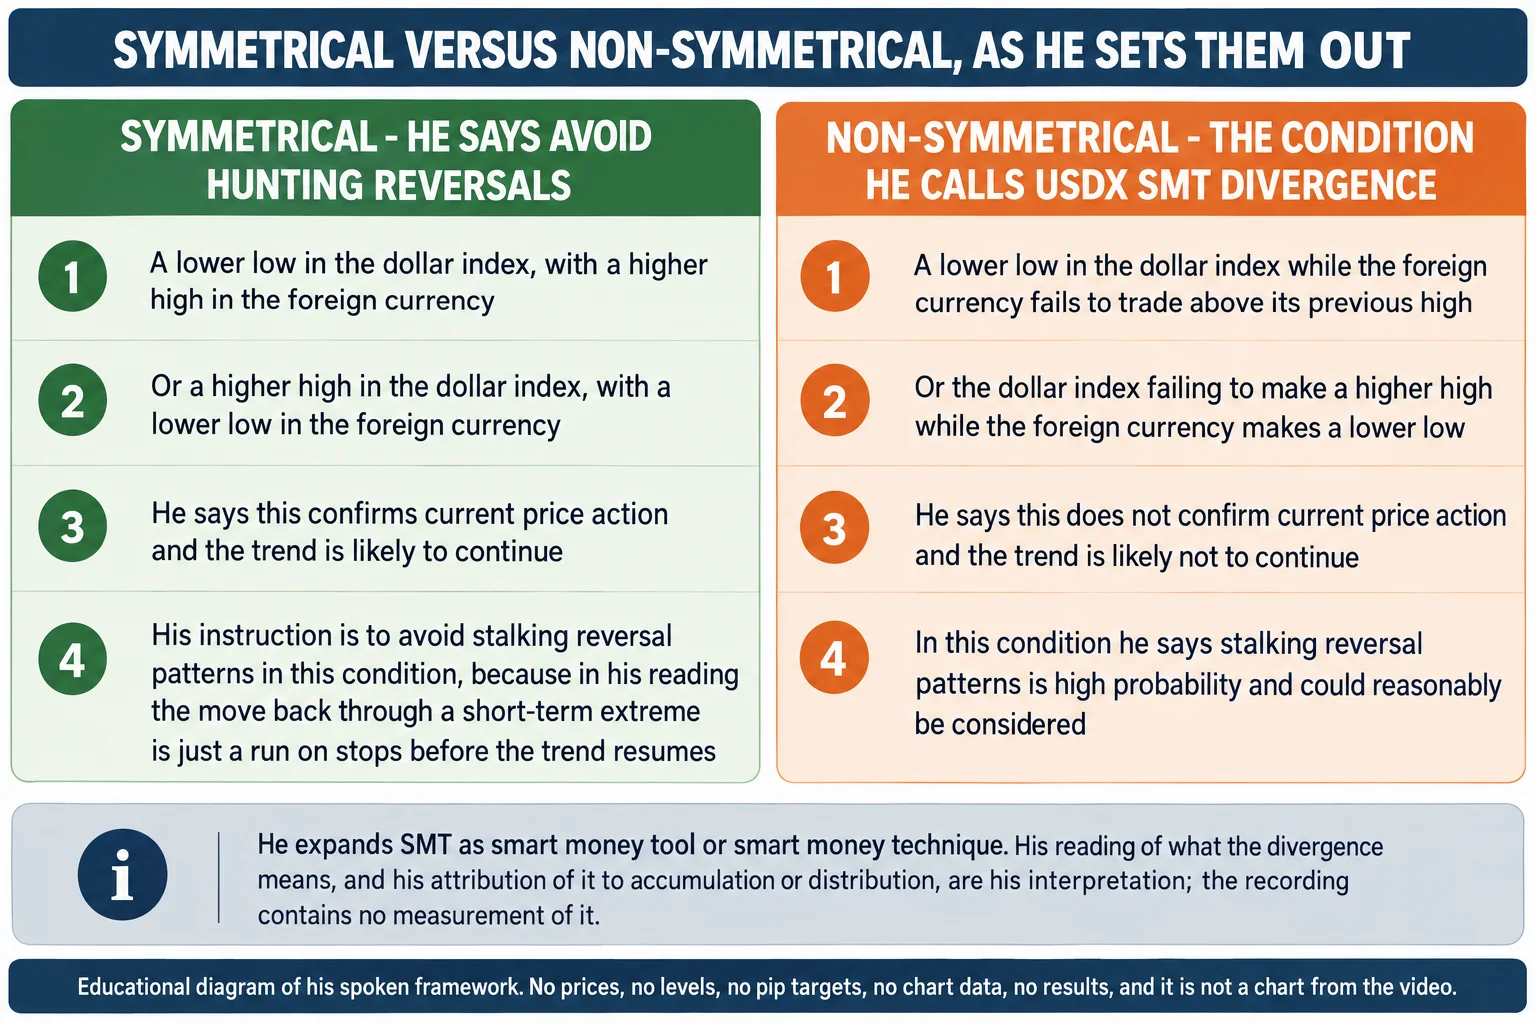
In the symmetrical case the two markets confirm one another (2:38): a lower low in the index with a higher high in the foreign currency, or a higher high in the index with a lower low in the pair. In his words that confirms current price action and the trend is likely to continue (2:55). His instruction for that condition is blunt: reversal hunting is not highly probable there and he says to avoid it altogether (3:00, 3:05), because in his reading a move back through a short-term high is just a run on buy stops before the index resumes lower (3:30). He describes that as anticipating a turtle soup before it happens (3:44), and the mirror case for a higher high in the index against a lower low in the pair (4:13) with stop-gathering below a short-term low where he says new longs get paired (4:07).
How Dollar Index Divergence Signals ICT Reversals
The reversal case starts at 5:17. When the index makes a lower low and the foreign currency fails to trade higher than a previous high, he calls it USDX SMT, and says it does not confirm current price action so the trend is likely not to continue (5:26). In that condition he says stalking reversal patterns is high probability and could reasonably be considered (5:42). His reasoning is that the foreign currency’s lower high is already showing weakness (6:05), and his sequence is that sell stops below the previous low get wiped out, new buying is accumulated and the dollar rallies.
He then states the same idea in the mirrored context, where the index fails to make a higher high while the foreign currency makes a lower low (6:17), and repeats the conclusion that stalking reversals is high probability there (7:08).
ICT Forex Market Structure in the 2016 Cable Case Study
He opens the first example at 7:25 on a daily chart of British pound dollar, which he calls the cable (7:30). He points out a higher high formed in the pair from the end of April into mid-June 2016 (7:43), and says the Dollar Index made its low over the same stretch but did not make the lower low that the relationship would call for (8:31). He labels that a bullish USDX SMT divergence: underlying strength in the index even though the pair looked bullish in isolation, which is why he says it simply took the buy stops above the level he renders as 47.60 and then the market tanked (8:44, 8:49).
He then names a level on the index as a place to watch, the 93.80 to 94 figure with a specific down candle, which he says may become a future bullish order block (9:01), and describes the run above the old high as a run on stops above 47.60 with the move reaching almost 50.65 (9:24, 9:36). He contrasts how retail traders read that rally as a bullish breakout (9:50) with his own reading that the index was being accumulated (10:20), and calls the divergence on his chart a manipulation rather than an accident (10:38). His conclusion for that period is that the focus should have been on buying dollars and selling foreign currencies (11:02).
ICT Forex Divergence in the Second 2016 Case Study
He builds a second daily example at 11:26, turning to the latter part of August 2016 through the first week of September (11:43). The pattern repeats: cable made a higher high while the index did not make the lower low it should have seen (12:27). He reads that as the index being accumulated on the long side while the cable is being distributed (12:39), and he frames the area above the old highs as another place for a turtle soup or a false break to run the buy stops sitting there (12:55, 13:05).
This is where his language is most interpretive, and the distinction matters: the accumulation is asserted to be visible in the strength itself, because the index would not go lower (13:31). His practical instruction is the check that carries across both examples – when a foreign currency looks like it is breaking out, always double-check it against the Dollar Index (14:00) – and his description of the alternative is that the false breakout is a sucker play (14:09). After accumulation, his expectation is that every retracement in the higher move gets another expansion (15:06).
Aligning Dollar Index and Forex Market Swings
From 15:19 he switches to chart mechanics on MT4. He describes an indicator of his own posted in the November 2016 membership forum thread, and walks through installing a line-chart overlay the way the platform then required – the download and editor step, saving it, and restarting the platform afterwards (15:54, 16:10, 16:52) – then adding it as a custom indicator from the insert menu (17:02).
The purpose of the overlay is alignment: place the Dollar Index on the pair’s chart so that a higher high in one can be compared directly with the expected lower low in the other. Back on the overlaid chart he repeats the reading, that price was making the higher high while the index was failing to make the lower low (18:11), and he demonstrates tidying the grid lines so the comparison is clear (18:35). Platform menus, indicator installation steps and any downloadable file change over time; only what the recording shows is described here, and no claim is made that the indicator is still available or behaves the same way.
Using ICT Market Structure in Forex Trading
At 19:19 he describes the exercise as assessing the underlying strength of buying and selling at respective highs and lows in the index against foreign currencies. Working from a daily chart, he says the same read can then be expressed on lower time frames – selling short at 60-minute or four-hour bearish order blocks, or, as a day trader, selling above the opening price above the midnight candle in New York (19:43).
His stated benefit is context rather than precision: a framework with no ambiguity about which side to favour (20:06), and in that example a bias toward lower prices on cable with the dollar strong (20:18). He closes by wishing the viewer good trading (20:31).
What ICT Market Structure Does and Does Not Show
What the recording contains is his framework plus his reading of his own daily charts in two 2016 windows, and a walkthrough of a chart overlay on MT4. It does not contain fills, position sizes, account results or win rates; it does not measure the divergence; and it does not define how comparable two swings must be in time or magnitude before a disagreement counts. The level figures he speaks – 47.60, 50.65 and the 93.80 to 94 area, rendered as the automated transcript renders them – are reported here as his coordinates rather than confirmed prices, and the charts themselves were not viewed for this article.
There are broader limits on any reading of this kind. Correlations between the Dollar Index and a particular pair are not fixed, swing selection is judgement rather than measurement, and the index is a weighted basket rather than a direct representation of any single pair. Nothing here should be read as verified profitability, as a recommendation to copy a trade, or as evidence that the pattern works.
ICT Market Structure Lesson Date and Identity
He places the material in the November 2016 ICT membership teachings (0:30), and the two chart examples are dated to April into mid-June 2016 and to the latter part of August into the first week of September 2016. The watch page lists the upload as 3 September 2022, which is when the recording was published to YouTube; it is not the date of the market activity shown in the charts, and the two should not be conflated.
ICT Market Structure Transcription Notes
The source for this article is the full original audio of the recording, transcribed locally with the whisper-large-v3-turbo automatic speech recognition model. It is automatic transcription, not human-verified captions: the cached source records a complete decode of the full audio, but automation still mishears words and digits, and it cannot see the charts. That is why the spoken figures are presented as his reported coordinates and why several of the phrases he uses, such as USDX SMT and turtle soup, are explained by him in the recording rather than inferred here. The recording is public and playable on YouTube; it is not embedded on this page because the video owner has disabled playback on other websites, which was tested directly – see the card below.
ICT Mentorship Core Content – Month 03 – Institutional Market Structure
The Inner Circle Trader · watch page lists upload 3 September 2022 · 1236 seconds, about 20 minutes 36 seconds · public, not unlisted. The recording identifies itself as part of the November 2016 ICT membership teachings and works through two 2016 cable examples. This recording is the primary source for every timestamp link on this page.
The recording is not embedded here. An embedded player was tested directly on 15 September 2026 from a BestProps page origin at desktop and mobile widths: the frame loads and then reports “Playback on other websites has been disabled by the video owner”, with no playable stream and no duration reported in either case. The link above opens the recording on YouTube itself.
ICT Market Structure Resources
These are the sources checked while preparing this article. The ICE page is the exchange’s own contract overview for the U.S. Dollar Index futures market the analysis is built on, and the two CFTC pages are the regulator’s advisories on forex fraud and on trading systems and hypothetical results. None of them evaluates this speaker, tests whether an SMT divergence provides an edge, verifies the levels quoted in the recording or endorses anything said in it. The MT4 overlay indicator he distributes through his own forum is not linked here and no claim is made about its availability, accuracy or behaviour; any other ICT, smart-money or third-party indicator, script, note set, chart annotation, transcript pack or re-upload circulating outside the publishing channel’s own page is unofficial and untested here.
- [1] ICT Mentorship Core Content – Month 03 – Institutional Market Structure The Inner Circle Trader (primary source; watch page read 15 September 2026, published 3 September 2022, listed at 1236 seconds).
- [2] The Inner Circle Trader (official YouTube channel) The publishing channel for the Core Content mentorship series this module belongs to (read 15 September 2026).
- [3] ICE (U.S.) Dollar Index (USDX) Futures, product overview The exchange's own contract page for the index used in the comparison, describing it as a benchmark for the international value of the US dollar against a basket of world currencies (read 15 September 2026). Contract reference only; it contains none of the lesson's rules or figures.
- [4] U.S. Commodity Futures Trading Commission (Foreign Currency (Forex) Fraud) The regulator's advisory on retail forex fraud and on claims made for forex trading systems (read 15 September 2026).
- [5] U.S. Commodity Futures Trading Commission (Fraud Advisory: Commodity Trading Systems Sold on the Internet) Notes that technical analysis attempts to predict future price movements from historical prices, price relationships and price trends, and that hypothetical trading results are typically simulations over historical data rather than real fills (read 15 September 2026).