
Key takeaways
This is the sixth teaching of the second month of the ICT Mentorship, and he is explicit that it is not about trade signals, patterns, stop placement or trade management 4:04.
Read the full summary
This is the sixth teaching of the second month of the ICT Mentorship, and he is explicit that it is not about trade signals, patterns, stop placement or trade management 4:04. What he sets out instead is a decision framework: a high reward setup, in his terms, is seven points of agreement across three perspectives — big picture, intermediate term and short term 53:12. The big picture needs at least two of four areas of study to agree; the intermediate layer needs at least two of three; and the short term needs one indication from each of its three areas 22:37, 29:43, 53:39. He states plainly that this is not execution and not an entry and that an entry signal must still be waited for, and he acknowledges it does not mean you will have no losses 54:22, 45:18. The lesson contains no order-book data, no verified fills, no forward-test results and no measured probability, and the whole framework is his own stated process.
How we researched this article
BestProps used document-based research from primary firm sources, checked September 25, 2026. The complete source list, scope, limitations, and commercial-state record appear near the end of this article.
This page covers ICT Mentorship Core Content – Month 02 – The Secrets To Selecting High Reward Setups, a recording published by The Inner Circle Trader. He identifies it at the top as the sixth teaching of the second month of the mentorship, and places it after his trading-plan development series as the last primer before the mentorship moves into breaking down individual decisions 0:42, 0:49.
One boundary matters before the detail. Everything below is his stated framework, reported here as he presents it: the three perspectives, the areas of study inside each, the agreement counts and the seven-point total are his own construction of how he says he reads a market. The transcript behind this article is an automatic transcription of the audio, not human-verified captions. Nothing in the lesson has been independently tested for this page, and no part of it is a recommendation to take a position.
Why he starts with process instead of setups
He spends the opening third of the lesson refusing to give what his audience usually asks for. He says he does not want anyone thinking this is trade signals, then rules out trading patterns, stop-loss placement and trade management in turn 4:04, 4:09. His reason is that the more exciting material — order blocks, order flow and the rest of the terminology — only becomes usable on top of a decision process, and he describes that process as the dry information that has to come first 4:59.
The method he describes for that process is deliberately mechanical. He says the parameters have to be specific and highly refined, so that the whole thing works like a flow chart, moving from one step to the next 9:54, 9:57. Without it, he says, you are left being emotional and influenced by price action and by media, forums and other people’s opinions, which he calls detrimental to trader performance 10:01, 10:19.
He also says the framework has to be your own. He tells the viewer he cannot force them to become a day trader, a short-term trader or a swing trader, and that the plan has to be defined and refined by the individual rather than handed over 10:49, 10:49. The practical step he does give is experience: he says the understanding of why a trade should pan out comes largely from taking action in a demo account, and that the experience should be logged and kept for reference rather than judged trade by trade 11:26, 11:31.
The three perspectives he says a setup must come from
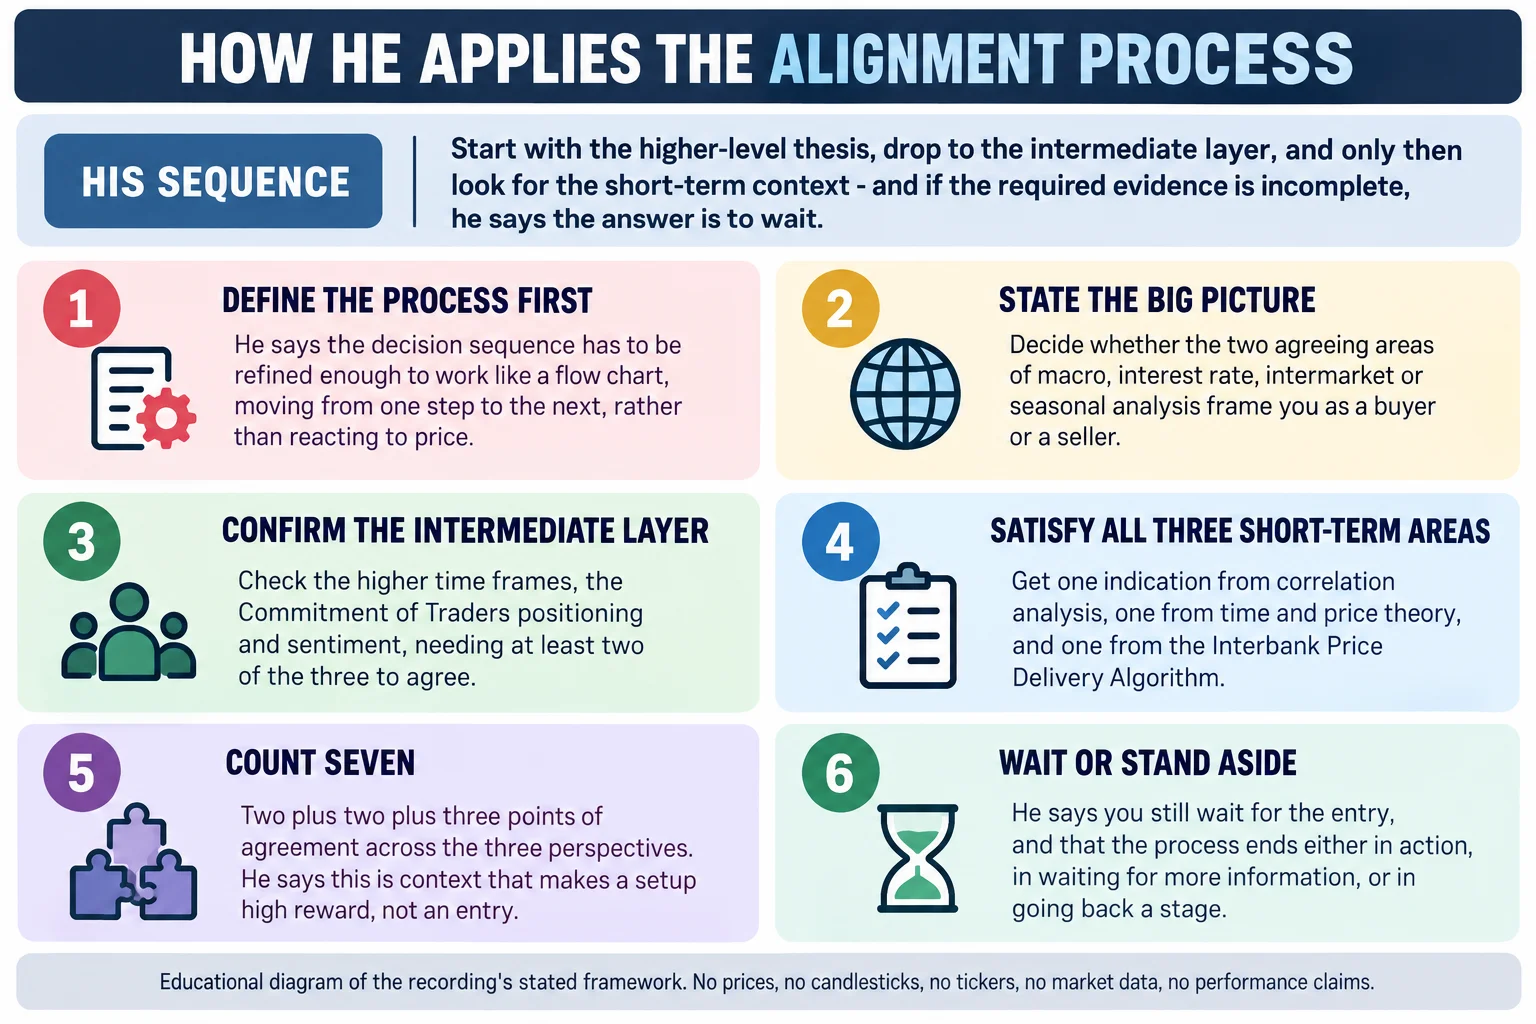
Before any setup discussion he divides the market into three views, and the division is the spine of the lesson. The big picture perspective, he says, is primarily four areas of reference: macro market analysis, interest rate analysis, intermarket analysis and seasonal influences 21:28, 21:34. The intermediate perspective is three: top-down analysis, COT or Commitment of Traders data, and market sentiment 29:40. The short-term perspective is also three: correlation analysis, time and price theory, and IPTA, which he expands as the Interbank Price Delivery Algorithm 22:08.
The big picture: two of four
He is explicit about the arithmetic of agreement. Four areas of study, but the big picture perspective is defined by at least two of them coming into agreement, and he says it does not matter which two you elect to subscribe to — they simply have to agree 22:37, 23:06.
He then walks each of the four. Macro market analysis he reduces to a single question: whether conditions are inflationary or deflationary, which he says has a direct relationship to a currency, to equities, and later in the mentorship to commodities and stock prices 23:49, 23:56. Interest rate analysis is about direction and surprise: are rates trending higher or lower, and has there been an unexpected change such as an FOMC intervention, a hike or a cut 24:43, 24:51. He adds a component he notes is not on the slide, the differential between two interest rate markets, and says a high-rate currency against a low-rate one can create what he calls a carrying charge market 25:17, 25:28.
The intermarket component is the one passage in the lesson that does not hold together, and it is worth stating plainly rather than tidying up. He says intermarket analysis comes by way of the CRB index with the focus primarily on the commodity market, looking at the relationship between commodities and the US dollar index, and he says the two are frequently inversely related — if the dollar index is going up, commodity prices are usually going down 26:13, 26:30, 26:31. In the very next passage, listing the same relationship again, he says that when commodity prices are going up the dollar is usually going higher as well, which contradicts the inverse relationship he has just described 26:36. Both readings are reproduced here rather than reconciled, because the recording leaves them standing side by side; the fourth component, seasonal influences, is described straightforwardly as whether an asset is in a bullish or bearish seasonal tendency 27:57.
The intermediate layer: two of three
The intermediate perspective narrows to three areas, and again the requirement is at least two in agreement 29:43. Top-down analysis he describes as looking at higher time frames down to a lower one, and on the monthly he says he is watching key levels, intermediate and long-term highs and lows, specific order blocks and levels that clearly repel price 29:50, 32:24.
COT data he draws from the CFTC report published every week, covering the positioning of large commercial traders, large speculators and small speculators; he says small specs matter least to him because they trade at unreportable levels 30:04, 30:23. Sentiment he describes as an opinion measure, naming Market Vane among other sources and saying he does his own sentiment research on Saturdays 30:38, 31:24.
He also gives a worked combination: a bullish weekly chart together with commercial positioning on the bullish side would be enough to establish an intermediate bullish perspective, after which he would wait for the short-term layer to support the same direction 38:14. He raises the conflict case himself — what if the monthly says bullish and the weekly and daily both say bearish — and does not resolve it here, saying the way to arrive at a conclusion belongs to later mentorship material 37:21, 37:37. The transcript therefore supplies the requirement but not a method for weighting disagreeing areas, and that gap is his, not an omission in this article.
The short term: one from each of three
This layer is the strictest, and he points out that the strictness is deliberate: three areas, one indication required from each 39:17, 53:39. Correlation analysis is where he introduces the dollar index and correlated-pair work, which he calls SMT. He describes the dollar index version as watching the relationship when the dollar makes higher highs while a currency pair such as the British pound fails to make lower lows 39:30, 40:00. The correlated-pair version compares closely correlated pairs such as the euro-dollar and the British pound-dollar, which usually move in the same direction, and he says a failure to move in tandem signals the absence of a symmetrical market and calls for selectivity 40:14, 40:51.
Time and price theory is described through the quarterly effect: a new price shift in the higher time frames roughly every three months, so a market that has been going higher is probably due for consolidation or reversal over the next three months, a range he allows to overlap by calendar month and does not treat as a precise cut 41:07, 41:47. He then adds the monthly effect, looking at monthly ranges and specific points of reference on the monthly chart 42:09. He anticipates the obvious objection about calling these short term, and answers it directly: short-term here means the perspective on which you execute, not a five-minute or fifteen-minute setup 44:31, 44:42.
The third area is IPTA, the Interbank Price Delivery Algorithm, which he says is where institutional order flow gets nailed down, along with liquidity — how the market seeks it — and the market efficiency paradigm 43:22, 43:34. These are his own terms rather than universally defined analytical tools, and the lesson outlines them without testing them; the definitions themselves belong to the surrounding mentorship material rather than to this recording.
The seven points, and what he says they are not
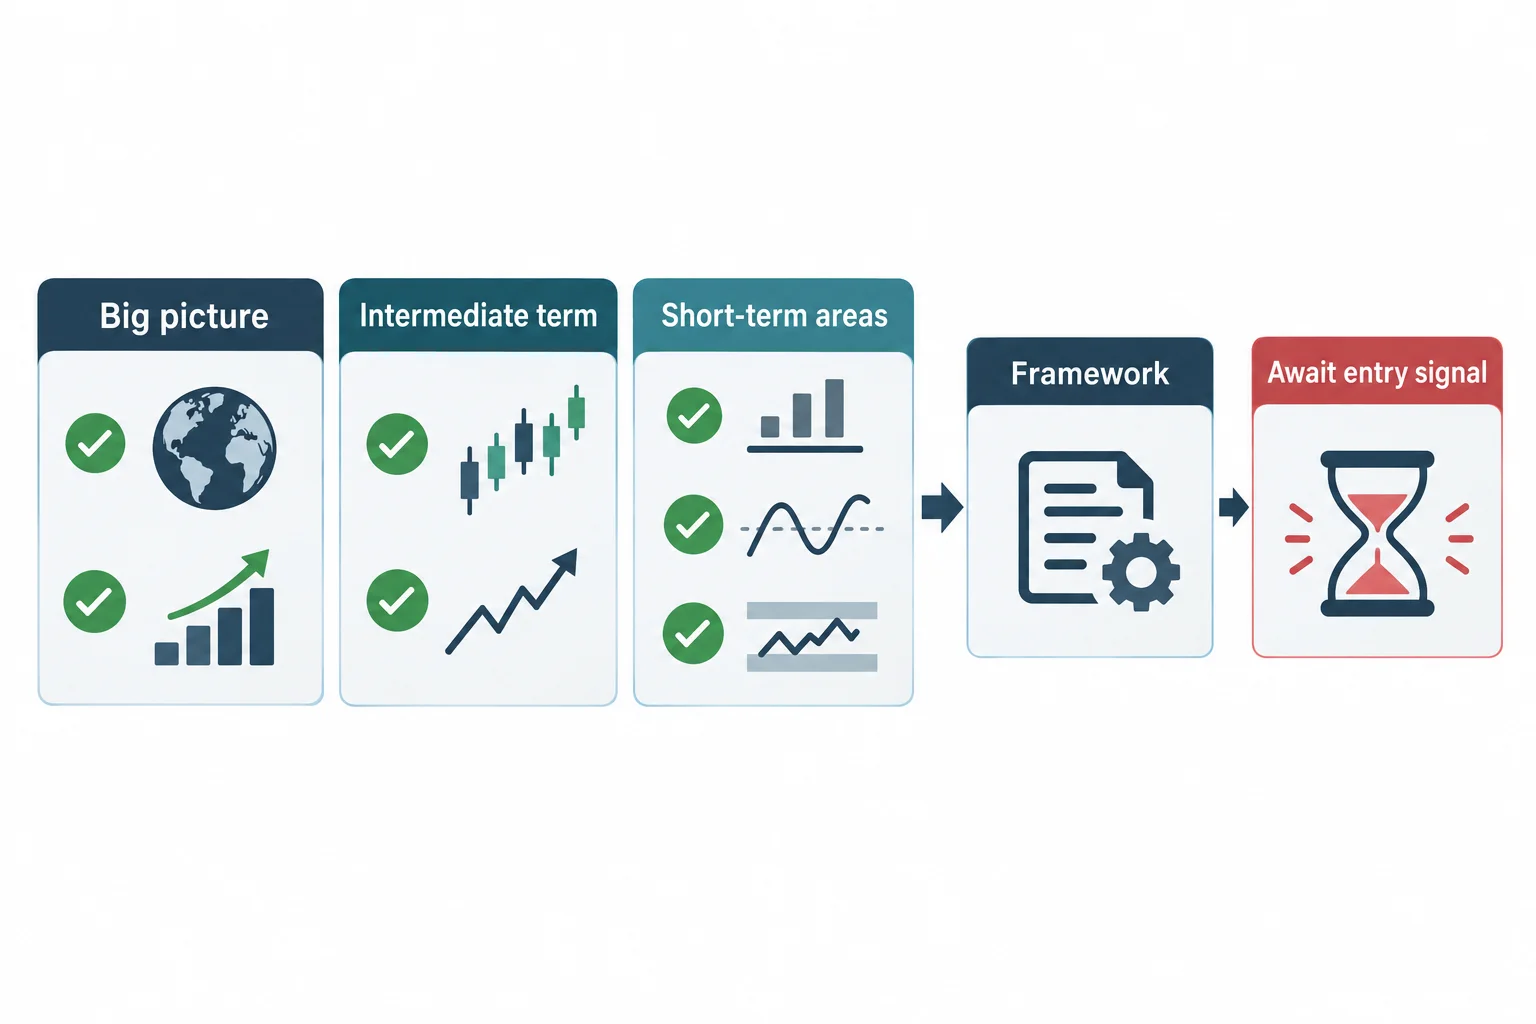
The count is the summary he builds to. He states it as seven things in agreement to make a high reward trade scenario, broken down as two from the big picture, two from the intermediate term and one from each of the three short-term areas 53:12, 53:26, 53:31. In his words, the alignment produces clarity about what you should be expecting to see in the market and why 53:49.
What matters as much as the count is his own qualification of it. He says directly that this is not execution and not entry, that it only gives the framework, and that an entry signal still has to be waited for and is the least of your concern at this stage 54:22, 54:28, 54:35. He also says alignment does not mean no losses and does not mean all winners, but that it provides the context in which he frames trade ideas 45:18, 45:22. That distinction — context rather than outcome — is his framing, and it is the reason the article does not treat “high reward” or “high probability” as a measured probability. The recording supplies no statistics for it.
How he says the whole thing fits together
He closes by describing the end state the later mentorship months are meant to produce. Once each perspective and each component is understood, he says, you have the building blocks for the flow chart of any model — day trading, scalping, swing trading or position trading — and the flow chart then yields a binary decision: take action, or stand and wait for more information, or go back a stage and wait there 58:50, 59:40, 59:44.
His framing throughout is that this is the unglamorous material. He says there is no secret sauce and nothing outside what has been shown, and that the reason it does not sound appealing is that it does not make a good course or a good video — while calling it the framework or backbone of how he trades, and saying it is what lets him describe where markets will go beforehand 58:23, 63:03, 63:08. That last point is where the lesson overreaches its own evidence, and it is worth separating from the rest. He goes on to mention a monthly result on an account he refers to as an IFX book for October, a figure of fifty-nine percent, as evidence that the framework works 63:08 63:12. That is an unverified, self-reported monthly figure with no statement of the denominator, no account statement and no forward test in the recording, and it is reported here as his claim rather than as evidence for the method. The name of the account is rendered in the transcript as “IFX book”, which may be a speech-recognition rendering of an FX book, so the term is reproduced as transcribed rather than normalised. It is not a basis for expecting a similar result, and nothing in the lesson establishes that the seven conditions caused it.
What this lesson does and does not establish
What it establishes is a fully described, writable-down checklist with a defined structure: three perspectives, four areas of study in the big picture needing two in agreement, three in the intermediate needing two, three in the short term requiring one each, for a total of seven conditions, plus an explicit statement that an entry signal is a separate and later step 22:37, 29:43, 53:39, 53:12. For a viewer who wants to convert discretionary analysis into a repeatable set of questions before considering execution, that structure is the deliverable, and it needs no proprietary tool.
What it does not establish is that the framework works, or that “high reward” has any probabilistic content. The lesson contains no trade log, no position sizes, no account results beyond the self-reported monthly figure discussed above, no sample of outcomes and no test. Several named components — SMT, IPTA, the market efficiency paradigm and the quarterly effect — are his own vocabulary for reading price, presented without evidence that the market behaves that way. The intermarket passage contradicts itself as described above, and the conflicting-areas case is deliberately deferred to later material rather than answered. Above all, the alignment is defined by him as context rather than as a signal, so a reader should not treat seven boxes ticked as a reason to take a position; his own wording is that the entry still has to be waited for and that losses remain possible. Third-party ICT material found anywhere other than the publishing channel’s own pages — indicator scripts, note packs, re-uploads, transcript packs — is unofficial, has not been tested for this article, and no claim is made about its accuracy or whether it repaints.
ICT Mentorship Core Content – Month 02 – The Secrets To Selecting High Reward Setups
The Inner Circle Trader · watch page lists upload 29 August 2022 · 3836 seconds, about 1 hour 3 minutes 56 seconds. The lesson identifies itself as the sixth teaching of the second month of the mentorship, and it is the primary source for every timestamp link on this page.
The recording is not embedded here. An embedded player was tested directly on 15 September 2026 from a BestProps page origin at desktop and mobile widths: the frame loads but then reports “Playback on other websites has been disabled by the video owner”, with no duration and no playback progress, while the video itself is publicly playable on YouTube. No half-working player is left on this page.
Watch the original recording
The lesson is mostly him talking through his own decision sequence rather than marking up charts, so reading it is a reasonable substitute for listening — but the emphasis is worth hearing. Every timestamp link above opens the recording at the moment referenced, so the framing can be checked against the spoken source directly.
Resources
These are the sources checked while preparing this article. The two regulator pages are general material about how technical-analysis claims and short-horizon trading are described by public authorities; neither evaluates this speaker, tests the framework in the recording, or endorses anything in it.
- [1] ICT Mentorship Core Content – Month 02 – The Secrets To Selecting High Reward Setups — The Inner Circle Trader (primary source; watch page read 15 September 2026, listed duration 3836 seconds, publicly playable).
- [2] The Inner Circle Trader — official YouTube channel (read 15 September 2026) — the publishing channel for the mentorship series this recording belongs to.
- [3] CFTC — Fraud Advisory: Commodity Trading Systems Sold on the Internet (read 15 September 2026) — states that technical analysis attempts to predict future price movements based on historical prices, price relationships and price trends, and warns that hypothetical trading results are typically simulations over historical data rather than executed trades. Relevant because the only performance figure in the recording is a self-reported monthly number.
- [4] Investor.gov (U.S. SEC) — Day Trading (read 15 September 2026) — describes day traders as rapidly buying, selling and short-selling throughout the day over very short holding periods and states that day trading is extremely risky and can result in substantial financial losses in a very short period of time; relevant to the discretionary, level-based trading described here.
A note on the transcription
The narrative above was written from an automatic speech-recognition transcript of the full original audio, not from human-verified captions, and the review did not watch the recording. That distinction matters less here than in a chart-heavy lesson, because this recording is almost entirely spoken reasoning rather than a presenter pointing at candles; the transcript is internally consistent and produced no low-confidence segments. Two passages are unclear as transcribed and are handled deliberately rather than smoothed over. The intermarket component contains the self-contradiction described above — commodities and the dolla