
Key takeaways
ICT Mentorship Core Content – Month 02 – No Fear Of Losing is a recording in which the speaker argues that losing trades do not by themselves prevent profitability, and that fearing a loss pushes traders into fear-based decisions and eventual hesitation 0:39, 1:18.
Read the full summary
ICT Mentorship Core Content – Month 02 – No Fear Of Losing is a recording in which the speaker argues that losing trades do not by themselves prevent profitability, and that fearing a loss pushes traders into fear-based decisions and eventual hesitation 0:39, 1:18. The bulk of the lesson is arithmetic on hypothetical samples, not results: on an assumed $5,000 account he holds the sample of ten trades and the average loss fixed while changing the reward-to-risk multiple, the accuracy rate and the percentage risked per trade 4:42, 5:35. Three winners against seven losers at 3-to-1 and 1% risk leaves a small positive net 6:33; the same low accuracy at 5-to-1 pays far more 8:16. In the sample where he raises risk to 2%, the net figure he reads out does not follow from the winners and losers he lists in the same passage: the subtotals he gives imply $800 or 16%, not the $750 or 15% he states 9:58, 10:05. He closes by calling losses inevitable and repeated, a cost of doing business, and says the losing column of a long career will be very long without removing the profitability available to a trader who keeps risk defined 18:01, 18:44. Nothing in the recording is a verified execution or a performance record.
How we researched this article
BestProps used document-based research from primary firm sources, checked September 25, 2026. The complete source list, scope, limitations, and commercial-state record appear near the end of this article.
In ICT Mentorship Core Content – Month 02 – No Fear Of Losing, the speaker opens by positioning the session as the fourth installment of the second month of the mentorship and saying he will talk about why losing on trades will not affect profitability 0:33, 0:39.
The lesson falls into two halves. The first is a short worked framing of a hypothetical long trade using the speaker’s own terminology. The second is a set of five arithmetic samples on a fixed hypothetical account, in which he changes one input at a time and reads out the net result. The percentages he produces are illustrations of his risk-framing argument. They are not expected returns, and the recording does not document live executions, fills or subsequent account performance.
What He Says Fear of a Loss Does to a Trader
The speaker states the problem directly at the start: staying concerned about taking a loss promotes fear-based decision making 0:54. He gives three consequences in sequence. Equity managed by traders who cannot take a loss cannot profit long term 1:00. Losing is inevitable, so fear-based decision making keeps attention fixed on the adverse outcome 1:09. And it fosters what he calls trade paralysis, or an inability to execute efficiently 1:18.
His stated alternative is the position of a professional equity manager, who he says understands that losses are a cost of doing business, and who uses sound equity management together with the setups he considers high probability to produce a percentage return 1:36, 1:43. He names the two framing targets he uses for the rest of the session: trade scenarios that encourage a 3-to-1 reward ratio, and setups framed at 5-to-1 reward-to-risk or better 1:50, 1:59.
The psychological claim and the arithmetic claim are separable here. Treating a defined loss as a cost is a statement about behaviour and staying with a plan. Whether a strategy actually produces the rewards in his samples is a different question, and the recording answers it only with the samples themselves.
The Trade Framing He Uses Before the Numbers
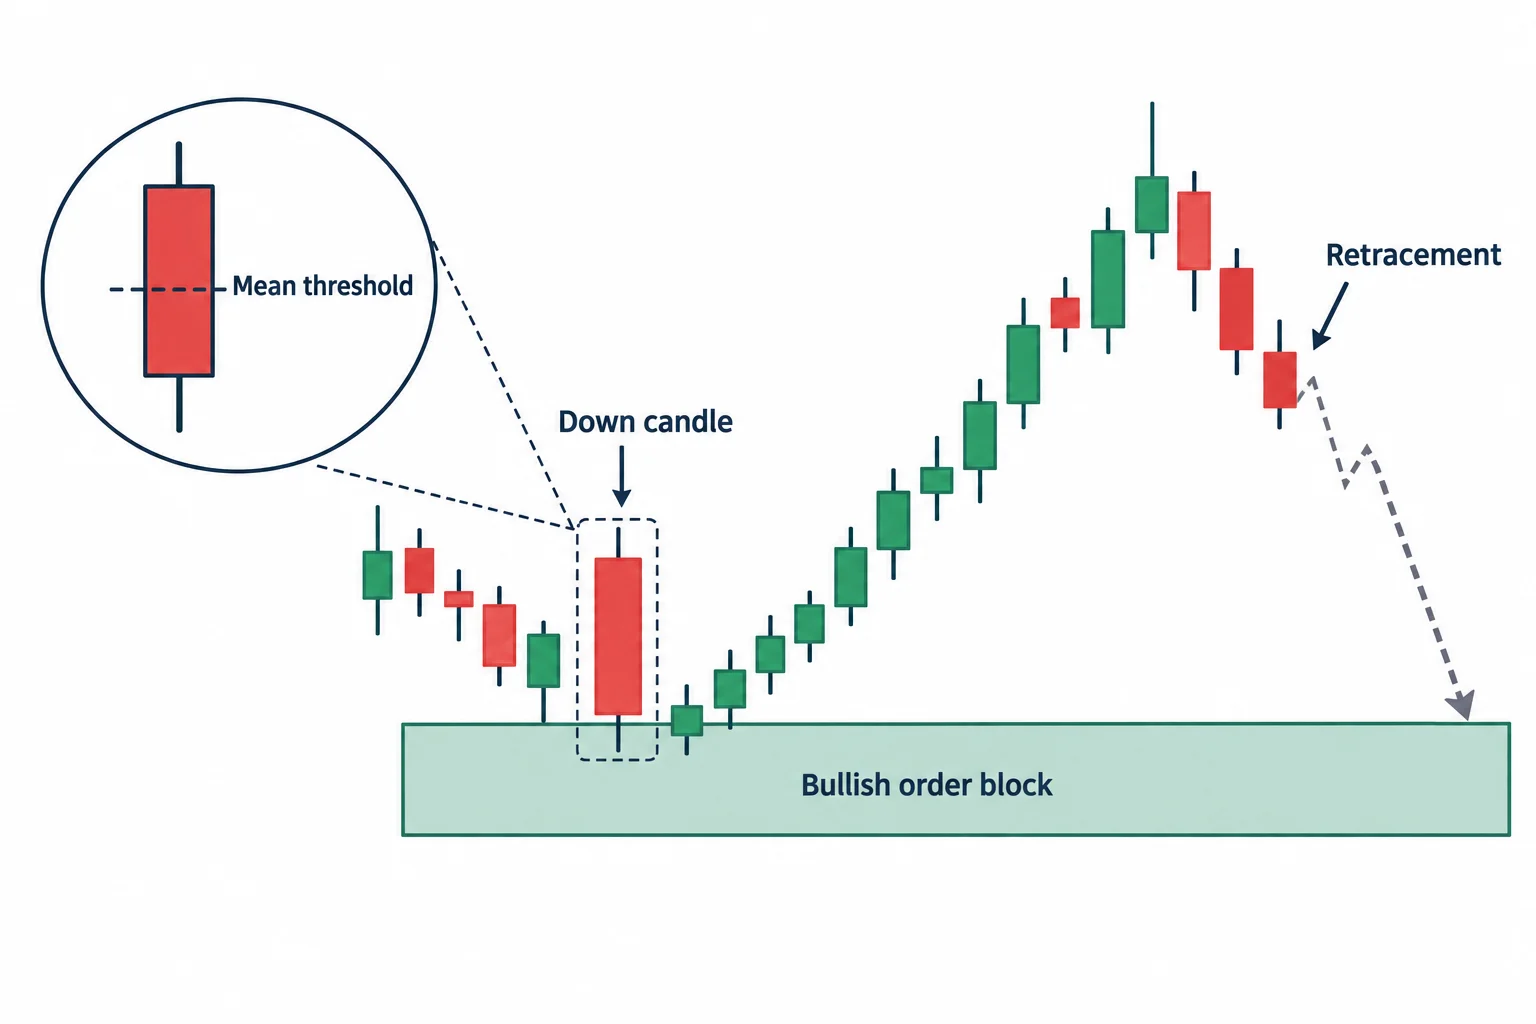
Before the arithmetic, the speaker gives a brief overview of how he frames a trade, explicitly for the context of the discussion 2:15. He says he will use a standard from his repertoire, the bullish order block, and describes price returning to a previous institutional area of buying marked by the down candle before the prior rally higher 2:39, 2:45. He says the high-to-open price of that down candle defines the fair value gap, or most probable support 2:57.
Inside the retracement into that area he points to the mean threshold and a hypothetical long entry on a secondary bullish order block 3:14, 3:21. He identifies the mean threshold as the middle of the down candle and says he does not want to see it violated on a closing basis 3:26, 3:33. He then says that using 20 pips as the stop loss frames reward multiples of 3-to-1 and 5-to-1, or even higher, and refers to an objective some 20 pips above an old high 3:41, 3:54.
This passage is spoken description of a chart, not a specification. The transcript is an automatic speech-recognition pass over the audio and this review did not view the chart, so no entry, stop or target level is asserted here beyond the 20-pip stop figure he states aloud. Order block, fair value gap and mean threshold are terms defined inside his own framework rather than standard measures with agreed calculations.
The Inputs He Holds Fixed in Every Sample
He then sets up the arithmetic. The account is hypothetical and fixed at $5,000 4:42. He deliberately starts at a low accuracy rate of 30%, meaning 70% of trades lose, and uses a sample of ten trades so that 30% is three winners and seven losers 4:48, 5:35, 5:50. Risk is 1% of the account, or $50, and at a 3-to-1 multiple the average win is $150 against that $50 average loss 5:06, 5:17. He later states that the average loss and average profit would rise or fall as equity changes, but that these examples hold the sample of ten trades fixed 9:38.
Sample One: 3-to-1 at 1% Risk, 30% Accuracy
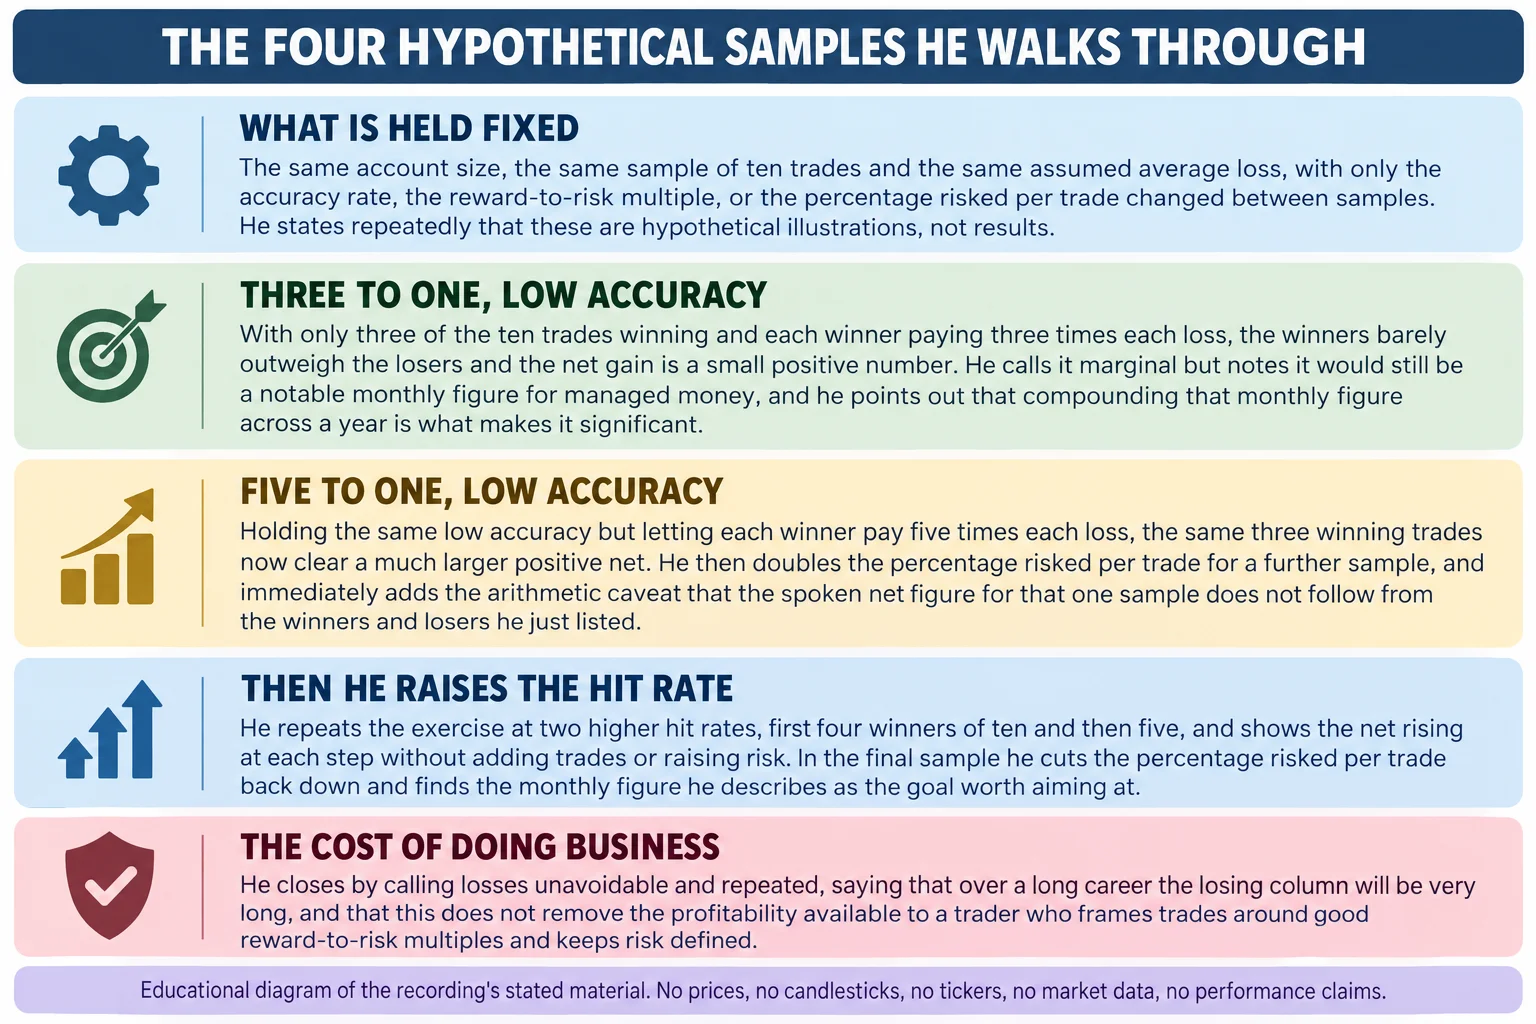
Three winners at a $150 average produce a $450 subtotal, and seven losers at a $50 average produce $350 6:12, 6:18, 6:25. His point is that even at this low accuracy the 3-to-1 multiple still ekes out a marginal net positive 6:33. He calls the result unexciting on its own, then reframes it: ten trades over a month producing that percentage would be an excellent return for managed funds, and compounding a monthly figure of that size across a calendar year is what makes it notable 6:52, 7:11.
Sample Two: 5-to-1 at 1% Risk, Same Low Accuracy
He holds the account, the sample of ten trades and the 30% accuracy and changes only the multiple to 5-to-1 7:29, 7:43. The average win becomes $250, so three winners produce $750, while the seven losers still cost $350 at $50 each 7:54, 8:00, 8:11. He states the net as $400, or 8%, and calls that a wonderful monthly rate for a very low accuracy rate 8:16, 8:30. The arithmetic in this sample is internally consistent with the figures he lists.
Sample Three: 5-to-1 at 2% Risk, and the Number He Reads Out
He then keeps the low accuracy and the 5-to-1 multiple but raises risk to 2% of the account, which pushes the average win to $500 and the average loss to $100 8:47, 8:53. Three winners at $500 produce a $1,500 subtotal, and seven losers at $100 produce a subtotal of $700 9:22, 9:34. He then reads the result as a net gain of $750, or a 15% return 10:05.
Those two statements do not agree. $1,500 in wins less $700 in losses is $800, which on a $5,000 account is 16%, not $750 or 15%. The discrepancy is in the narration itself, not in the earlier samples, and it does not change the direction of his argument, but the stated figure should not be repeated as if it followed from the subtotals he gives in the same passage 9:58, 10:05. He then says he is using only 2% maximum risk per trade, and notes that beginners typically want 90%, 98% or 100% accuracy, whereas his argument is that the framing of the reward multiple in your favour is what matters rather than the accuracy rate 10:17, 10:30, 10:39.
Raising Accuracy to 40%, Then to 50-50
Sample four lifts accuracy to 40% with nothing else changed, giving four winners at a $500 average for a $2,000 subtotal and six losers at $100 for $600, which he reads as a 28% return on the same $5,000 10:46, 11:02, 11:21. Sample five goes to a 50-50 hit rate, still at $500 average win and $100 average loss: five winners produce $2,500, five losers cost $500, and he states the net as $2,000 or 40% 12:04, 12:16, 12:32. Both samples reconcile with the figures he lists.
He explains the accuracy increase as a consequence of experience rather than a requirement: knowing the model more intimately, knowing what is being traded, having learned patience and how to reduce risk while in a trade, so that accuracy rises by default 11:40, 11:57.
Sample Six: 5-to-1 at 1% Risk With a 50-50 Hit Rate
The final sample returns risk to 1% per trade while keeping the 5-to-1 multiple and the 50-50 hit rate, which brings the average win back to $250 and the average loss back to $50 13:14, 13:24. Five winners at $250 give $1,250 and five losers at $50 give $250, which he states as a $1,000 net 13:37, 13:56, 14:06. The figures reconcile.
What He Calls the Optimal Goal
From this last sample he builds his recommendation: you only have to be right half the time, on trades framed at 5-to-1, risking 1% of the account 14:12, 14:21. He contrasts that with the feeling, early on, that a trader has to put big risk on, and says 1% is what makes millionaires 14:31, 14:36. He describes the resulting monthly rate as the trading goal worth aspiring to, and calls it optimal precisely because nothing is being pushed: not the number of trades, not the required accuracy and not the risk per trade, which he notes is half of the 2% maximum he says is the usual industry standard 15:18, 15:29, 15:34. He asks whether half a percent risk would be acceptable for a correspondingly smaller monthly return, and answers his own question by asking why it would not be 15:40, 15:46.
He also ties the first sample back to institutional expectations, saying large funds look for 1% to 2% a month and that compounding that over a year gives their investors a return in the mid-to-high twenties, and that there are large sums of money that would want that done for them 15:59, 16:09, 16:21, 16:27. He adds that you do not have to trade every month, that this framing leaves room to sit out roughly half the year, and explicitly hedges that he is not saying everyone will get these returns every month, only that it is a good goal to frame trades around 17:07, 17:19, 17:31. He says the point of the low-risk, equal-odds framing is that it does not force performance and lets the trader relax and enjoy the process 17:48.
What He Says About Losses at the End
He closes on the psychological theme. There is no fear that is justified in taking losses, because they are part of the business, part of the job as an equity manager, and a cost of doing business 18:01, 18:08, 18:21. He says that if you traded for a long time and kept a column of wins next to a column of losses, the losing column would be very long, but that this does not remove the profitability available to traders who frame trades with good reward-to-risk multiples and keep risk managed and defined 18:26, 18:36, 18:44. He returns to the 20-pip stop and works an example of position sizing: 1% of $5,000 is $50, so dividing a 20-pip stop by that $50 gives the dollar-per-pip figure to use for the trade, which is what he says produces the numbers in his tables 18:56, 19:01, 19:10. He repeats that he can only speak in hypothetical terms 19:20.
His last substantive point is about accuracy ceilings. He notes that he did not show 60%, 70%, 80% or 90% accuracy, that none of it is necessary, and that as proficiency and understanding of price action grow the accuracy rate will rise by default, but that he would never demand or need it to be higher than 50-50 19:33, 19:46, 19:53.
How to Read This Lesson Without Overreading It
- The tables are hypothetical, and he says so. Every sample uses a stated hypothetical account and an assumed accuracy rate, and he says outright that he can only speak in terms of hypothetical 19:20. Nothing here is a verified execution, a fill or a track record.
- One spoken net figure does not match its own subtotals. The 2%-risk sample states $750 and 15% where the wins and losses he lists imply $800 and 16% 10:05. That is a narration discrepancy, and it is not evidence about any real strategy either way.
- Planned multiples are not realised averages. The samples assume every winner reaches the full target and every loss stays capped. Fees, slippage, partial exits, variable sizing, trades that never reach the planned multiple, and the possibility that a more distant target is harder to reach are all outside the arithmetic.
- His terminology is proprietary. Order block, fair value gap, mean threshold and institutional area of buying are defined inside his own framework, not standard terms with agreed measurements, and no chart from the recording was inspected for this article.
- The industry-comparison claims are his. The 2% maximum he attributes to industry practice, the institutional monthly targets and the compounded annual figures are all assertions he makes in the recording rather than measurements published anywhere.
- This is not instruction to trade. The material is an educational explanation of one trader’s risk framing. Nothing here is investment advice or a claim of profitability.
Watch the Original Recording
ICT Mentorship Core Content – Month 02 – No Fear Of Losing
The Inner Circle Trader · watch page lists upload 29 August 2022 · 1,204 seconds, about 20 minutes 4 seconds. The recording identifies itself as the fourth installment of the second month of the mentorship, and it is the primary source for every timestamp link on this page.
The recording is not embedded here. An embedded player was tested directly on 15 September 2026 from a BestProps page origin at desktop and mobile widths: the frame loads and the player reports “Playback on other websites has been disabled by the video owner”, with no duration and no playback progress, while the video itself is publicly playable on YouTube. The oEmbed endpoint answers 401 Unauthorized for this video for the same reason. No half-working player is left on this page.
The watch page was read on 15 September 2026 and is publicly listed as ICT Mentorship Core Content – Month 02 – No Fear Of Losing by The Inner Circle Trader, not private and not unlisted, with an upload timestamp of 29 August 2022 and a listed duration of 1,204 seconds. The recording says it is the fourth installment of the second month of the mentorship, which is a different calendar date from the upload; both are reported as they are, and neither is treated as a contradiction.
A Note on the Transcription
The transcript behind this article is an automatic speech-recognition pass over the full original audio of this recording, not human-verified captions and not a caption track, and this review did not view the charts. Its cached quality record reports the audio complete at a maximum level of −9.0 dB, with no low-confidence characters and none of its 178 segments flagged low confidence. The account sizes, averages, percentages and the 20-pip stop are rendered clearly enough to check against one another, which is how the single arithmetic discrepancy above was found. Nothing on this page comes from anywhere other than the spoken content of this recording, and no fill, spread, order result or performance figure has been inferred from it.
Resources
These are the sources checked while preparing this article. The CFTC and Investor.gov pages are general regulator material about how trading-system and technical-analysis claims should be assessed and what risk means; neither evaluates this speaker, tests whether the samples in the recording are reachable in practice, or endorses anything said in it. Any ICT, smart-money or third-party indicator, script, note set, chart annotation, transcript pack or re-upload circulating outside the publishing channel’s own page is unofficial, has not been tested here, and no claims are made about its accuracy or repainting behaviour.
- [1] ICT Mentorship Core Content – Month 02 – No Fear Of Losing — The Inner Circle Trader (primary source; watch page read 15 September 2026, listed duration 1,204 seconds, about 20 minutes 4 seconds).
- [2] The Inner Circle Trader — official YouTube channel (read 15 September 2026) — the publishing channel for the mentorship series used here.
- [3] CFTC — Fraud Advisory: Commodity Trading Systems Sold on the Internet (read 15 September 2026) — states that technical analysis attempts to predict future price movements based on historical prices, price relationships and price trends, and warns that hypothetical trading results are typically based on simulations using historical price data.
- [4] Investor.gov (U.S. SEC) — Glossary: Risk (read 15 September 2026) — defines risk as the degree of uncertainty about the rate of return on an asset and the potential harm when financial returns are not what the investor expected, and notes that as investment risks rise investors generally seek higher returns to compensate.
Source: ICT, ICT Mentorship Core Content – Month 02 – No Fear Of Losing, The Inner Circle Trader, watch page upload date 29 August 2022; the recording presents itself as the fourth installment of the second month of the mentorship. Local automatic speech recognition of the full original audio was the transcript used for this article, and it is not human-verified captions. This commentary is educational and is not investment advice.