
Key takeaways
ICT Mentorship Core Content Month 02 lesson seven of eight explains false flags as bull or bear continuation shapes that can trap pattern traders when a trend is mature or price reaches higher-timeframe distribution, accumulation, premium or discount zones.
Read the full summary
ICT Mentorship Core Content Month 02 lesson seven of eight explains false flags as bull or bear continuation shapes that can trap pattern traders when a trend is mature or price reaches higher-timeframe distribution, accumulation, premium or discount zones. ICT argues patterns do not move price and instead uses them to anticipate retail behavior, applying top-down analysis across monthly, weekly, daily, four-hour, one-hour, fifteen-minute and five-minute charts. In the bull flag example, price enters a daily bearish order block and premium range, marginally breaks an old high, rolls over and returns to a bearish order block for a proposed short at 76.97, with the stop above the flag wick and the liquidity void as the first objective. In the Aussie bear flag example, the measured move fails, a swing high is violated and the last down-close candle becomes the focus. Both examples feature a small liquidity break followed by reversal, described as the basis of a turtle soup entry. Only the rollover scenario is explained despite a claim that two scenarios exist, and the recording provides no statistics, account statement or verified performance.
How we researched this article
BestProps used document-based research from primary firm sources, checked September 25, 2026. The complete source list, scope, limitations, and commercial-state record appear near the end of this article.
In ICT Mentorship Core Content – Month 02 – Market Maker Trap False Flag, he opens by welcoming viewers back and identifying the recording as lesson seven of eight of the second month of the mentorship, and says the subject is specifically the market maker trap of false flags 0:31, 0:39. The watch page lists an upload of 30 August 2022 with a duration of 1,792 seconds, against a transcribed audio duration of 1,791.6 seconds.
What the ICT False Flag Means
He defines a false flag as a pattern that classic chartists and pure chart-pattern traders fall victim to a lot 0:47. He says he fell victim to it a lot early in his own career, and that his introduction came through a trading manual he names, which the automatic transcript renders with an author name and a title that do not look reliable; he describes that material as introducing him to technical analysis and to continuation patterns, which he calls one of the simplest things to see in price 1:01, 1:16, 1:34.
His central warning is a limit on the pattern rather than a rejection of it. He says not all sudden price rallies that move into a short-term consolidation are bull flags, and not all sudden declines that move into a short-term consolidation are bear flags 1:41, 3:37. In a mature bull trend or at higher-timeframe distribution levels, he says price will post what he calls a false bull flag, and retail traders read it as a classic continuation buy pattern when it many times results in a reversal 1:52, 1:59, 2:10, 2:17. He says the same in reverse: in mature bear trends or at higher-timeframe accumulation levels price posts false bear flags, retail sees a classic continuation sell pattern, and it many times reverses 3:46, 3:55, 4:00.
What he says helped him was higher timeframe context. He describes discerning that understanding higher timeframe charts and what he now calls a premium market assisted him in identifying potentially bearish bull flags, and that understanding discount markets assists in identifying potentially false bear flags, or when not to expect another leg lower but in fact a buy 2:25, 2:30, 4:04, 4:07.
He also states the mechanism he is sceptical of. Price does not move based on any kind of pattern, he says, whether that is an order block, a mitigation block, a breaker or a classic chart pattern such as a head and shoulders or a bull flag 2:57, 3:02, 3:07. And he is blunt about his own history with it: he says he fell victim simply because he was looking for patterns for the sake of patterns 2:51.
How the ICT False Flag Forms
Before the examples he walks through the textbook version using images he says he simply pulled from a search, stressing that these are not his charts and that viewers can find their own examples the same way 4:25, 4:30, 7:23. In the bullish version price makes a leg up, then a small consolidation that can run sideways or slant slightly lower, then another impulse swing higher roughly equal to the first, giving a measured move 4:44, 4:48, 4:54. The first leg up is called the flagpole, the consolidation is the flag, and the measurement is the flagpole projected from the move out of the consolidation 5:04, 5:18. The bearish version is the same construction inverted: a decline, a consolidation that can slope upward, and a projected low obtained by subtracting the first leg from the breakout of the consolidation 6:03, 6:05, 6:19.
He admits to having traded it. He says that when he started, some of his grain trades and some of his live cattle and live hog trades came by way of trading this simple pattern, and that it happened when he had one-hour stochastics divergence in agreement 5:29, 5:38, 5:43. The problem, he says, is that he never really considered the higher timeframe charts or what he now understands as a premium or discount market 5:50, 5:52.
On the bearish side he adds that when markets are in a strong trend and are not mature and still have more legs to go lower, he finds the pattern pretty consistent, and that the problem is not knowing when the trend is mature or when the market is in areas of accumulation where smart money is buying aggressively 6:32, 6:37, 6:44, 6:47, 6:50. He says these patterns materialise near the low, that a lot of people see them as continuation and post about an expected new leg lower on social media, and that many times price will not go down, or will go down only a little before reversing abruptly higher 6:52, 6:55, 7:00, 7:10.
ICT Bull Flag Trap That Fails
The first example begins at 8:07: price has moved up aggressively and then formed a small low consolidation after the rally, which he says any chart pattern reader would immediately call a bull flag, measure the flagpole from it, and project a higher high 8:18, 8:22, 8:26, 8:36, 8:40. He says that looking for higher prices on that basis would have been the pattern-only conclusion, and that the problem is looking at one timeframe only 8:44, 8:49, 8:54.
What he prescribes instead is what he calls a certain measure of top-down analysis, using monthly, weekly and daily charts and at least a four-hour chart, preferably the daily, to see that there is more information to consider 8:54, 8:57, 9:03. He is candid about his own starting point: he says if someone had handed him that chart in his first six to eight months of trading he would clearly have expected the market to go higher on the pattern alone 9:18, 9:22, 9:27. He also says that in his first year everything was in a bull market, that he understood only buying low and selling high, and that he could not grasp selling short at all 9:33, 9:37, 9:43, 9:49.
The failure, as he narrates it, is modest rather than dramatic. He says the market gave no advancement higher, and that the only thing it did was breach above a previous area of consolidation 10:03, 10:10, 10:18. He repeats that when price broke out, everyone who trades bull flags would have been excited, and that the only thing price did was trade just above an old high 11:17, 11:21, 11:26.
How ICT Reads a False Flag Top Down
His first step is to discount the wicks and read the bodies. He says he is going to focus primarily on the bodies of the candles and to forget the wick for a second 10:55, 11:03. He then traces the sequence: price dropped lower, rallied up, tried to go a little lower again, and finally ran through 11:09.
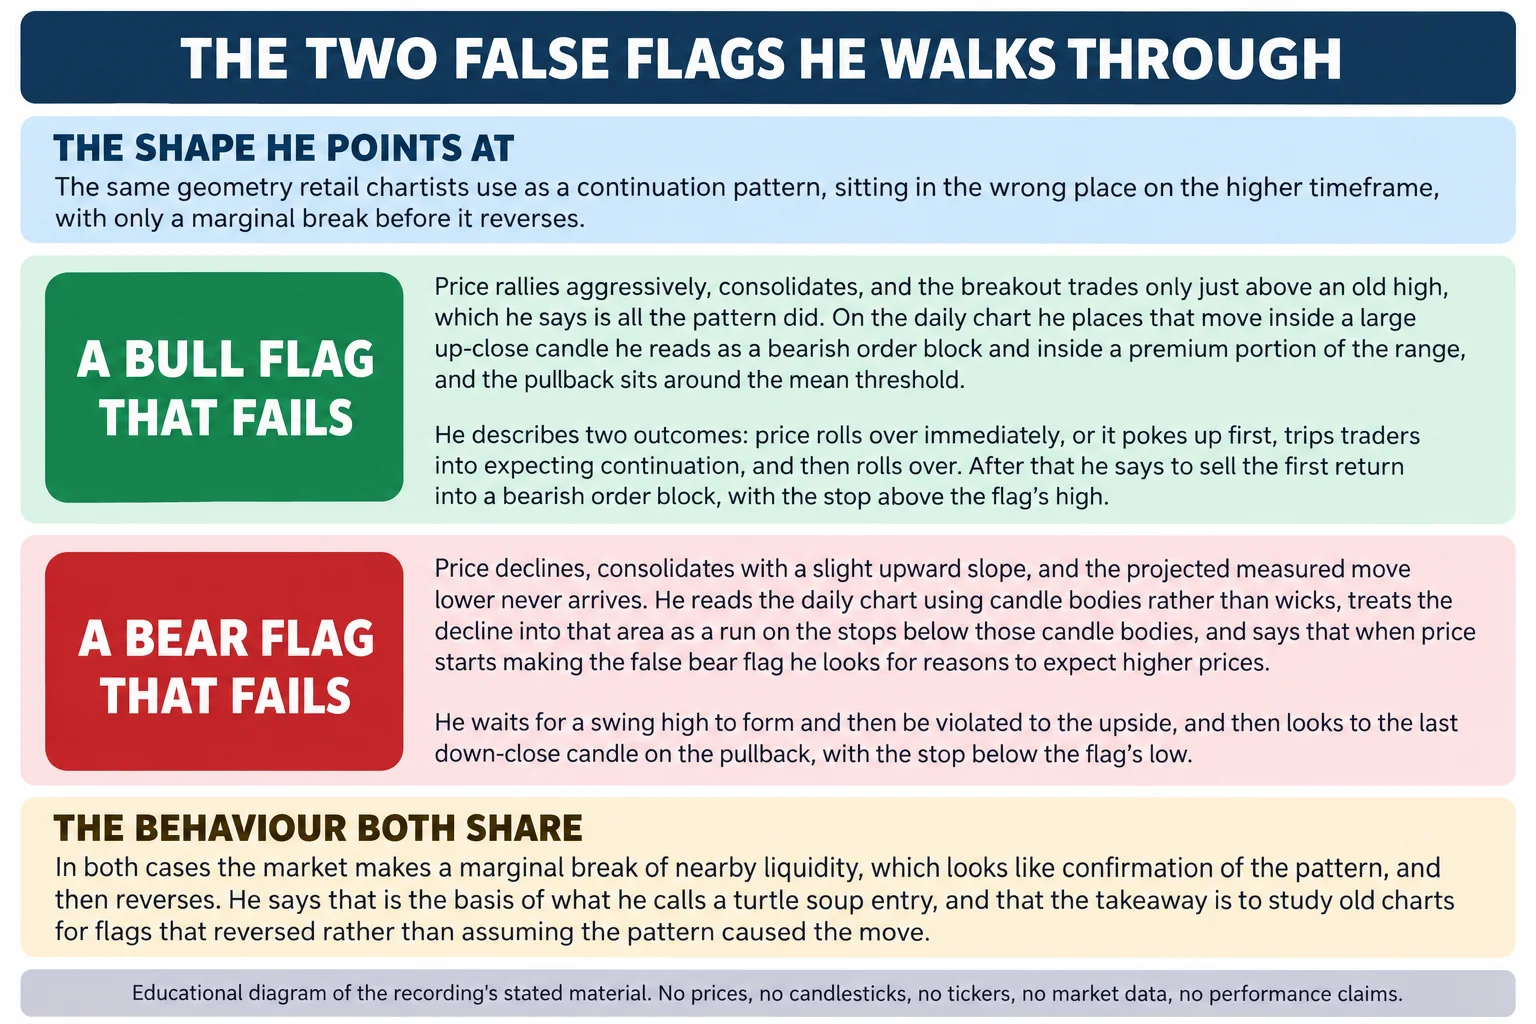
He then moves up to the daily chart. He marks a price swing from a high down and a retracement up, and says the fifteen-minute area he shaded sits inside a big up candle that he identifies as a bearish order block 11:37, 11:42, 11:48, 11:53. Drawing a Fibonacci retracement from that high down to the low just before the swing up, he says the area is clearly an area of distribution, which he translates as being in an area of premium 12:01, 12:11, 12:18, 12:32. He adds that the whole span he is looking at is a range, with an old high and an old low 12:50, 12:51.
Dropping to the four-hour chart, he marks a rally up that creates a liquidity void and another liquidity void on the way down, and says that midway through it is the equivalent of what would be viewed as a bearish order block 12:53, 13:04, 13:14, 13:18, 13:25. Because he has already placed the market in a premium where he expects distribution, he treats the whole range as falling inside the scope of that bearish order block and says he will be looking at things such as the mean threshold 13:34, 13:41, 13:48.
On the one-hour chart he says he will look at a bit more detail, then drops to the fifteen-minute chart, where he focuses on the gap between the opening of one candle and the close of another 13:48, 13:56, 14:03, 14:07. Zooming into the five-minute chart he points out the up candles immediately before the move lower and says that up move only trades back into what he calls the institutional order flow of the lows he has marked 14:20, 14:27, 14:36, 14:45.
The prices he quotes in that passage are not usable. The transcript renders him saying that the low in one candle comes in at 77.14 and the high comes in at 77.14, the same figure twice, so no price is stated from that sentence here 14:45, 14:55. What he describes is that price closed in the liquidity void, and that relative to what had been offered, the market posted bullish prices for the buy side and then offered it one more time to be sold, filling in that range 15:01, 15:06, 15:12, 15:19.
He then derives the level he cares about from the candle bodies: taking the two up candles and measuring from the body low to the body high gives equilibrium, which he says is the level he has highlighted and is also the bottom of the last up candle on the five-minute chart 15:22, 15:29, 15:34. With that level and a swing high he is framing, he notes a small fair value gap 15:42, 15:49. He says the apparent bull flag then comes up, and asks what it is really doing: in his reading it is only clearing out the bodies of the candles, and the big wick visible on the fifteen-minute chart is not being considered at all 15:52, 15:58, 16:04, 16:07.
The last piece of that reading is where he says the sensitivity sits. Looking back at the up candles when price starts to break down, he says the up candles start with their bodies and their wicks on the low end, and that this is where all the sensitivity on selling short will be 16:07, 16:13, 16:14, 16:18. His conclusion for the setup is that in areas of heavy distribution, a quick rally up and a consolidation that looks like a bull flag is not read by him as bullish, and that he is looking for it to create a false move and break lower 16:23, 16:34, 16:40, 16:47.
Two ICT False Flag Scenarios
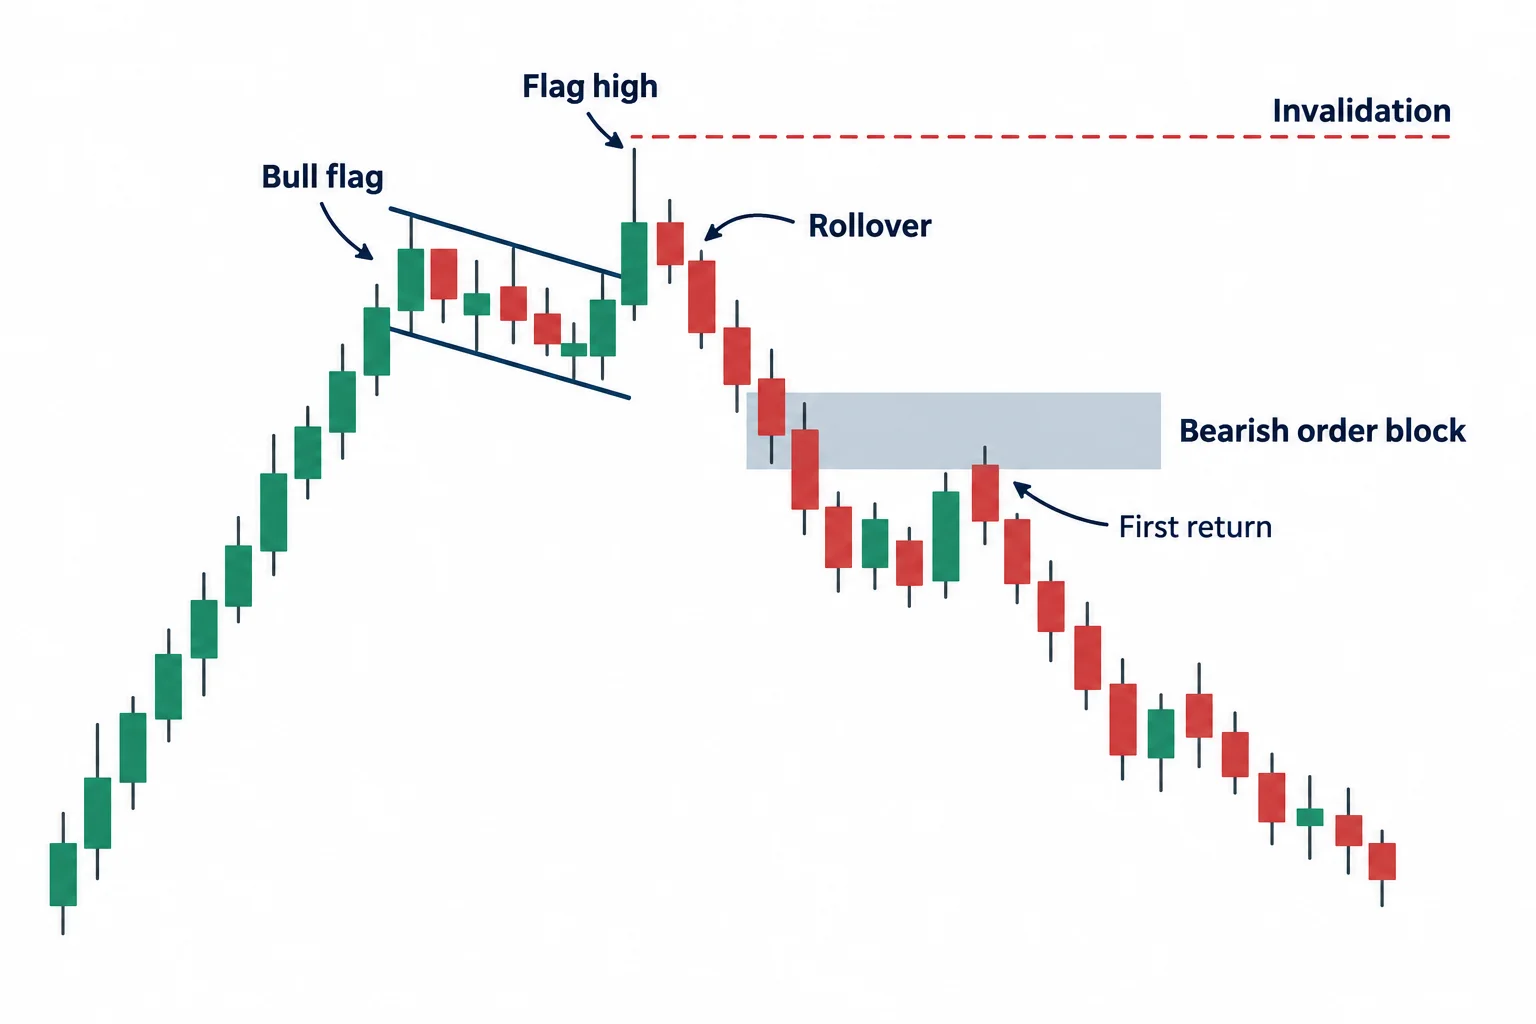
He says one of two scenarios can happen. The one he walks through, and calls the easiest one to trade, is the one where price starts to come up and then rolls over: traders are tripped into thinking it is going higher, and once it rolls over he says the trade is to sell the first return back into a bearish order block 16:40, 16:47, 16:53, 16:57. He does not describe the second scenario in the recording, and he does not present either as certain.
For the entry he gives the level as an opening at 76.97 with the high also coming in at 76.97, and says that is where his short would be 17:03, 17:13, 17:18, 17:20. He says the stop goes above what would be considered the bull flag’s high, the wick, and that this is the risk, 17:26. He describes that risk as not much in terms of pips, and says he would then simply wait for price to come back down and trade and close in 17:29, 17:34, 17:38. The first objective he states is to close the liquidity void that the false flag creates, 17:46.
He then checks the same level on the fifteen-minute chart, notes the last up candle before price starts trading lower, and says the level on that candle is 76.97 again against the low 17:46, 17:59, 18:09. His summary of the sequence is that price breaks down, closes in its void, goes right to the bearish order block, and that he reads what follows as a sell-off, 18:15.
How the ICT Market Maker Trap Works
He pauses to state the point of the example. He says he is showing that there will be times when the market can be broken down from a top-down perspective by defining discount or premium, understanding the higher timeframe as shown on the daily chart, and walking down to a lower timeframe that can be executed on 18:21, 18:29, 18:34, 18:38, 18:45.
The premise he says he is trading on is what other traders will see. He says he can use the premise that other traders are going to see this as a bullish scenario, and calls it a sentiment play in addition to institutional order flow on the higher timeframe 18:45, 18:49, 18:59, 19:03. He says he is able to see what everyone else with a retail-minded perspective would see as continuation on the upside, and that when price starts to break down he knows he can get back in and sell it short at that moment 18:53, 19:09. He then narrates price moving away aggressively, closing in its void, trading up one more time to close a small liquidity void, and ultimately moving lower, 19:14.
ICT Bear Flag Trap That Fails
The second example starts at 19:23. He describes price in an existing downtrend making a sudden decline and then a small consolidation that slopes higher, which by all appearances would be deemed a classic bear pattern or bear flag continuation 19:29, 19:39, 19:44, 19:49, 19:54. In his account one would reasonably project a measured move lower, and he says the pure chart pattern reading pointed to a move to about 73.55 20:02, 20:12.
What he says actually happened is that the market traded down into 74.42 instead 20:12, 20:20. He then brings in the higher timeframe perspective, highlighting the small area where the pseudo bear flag sits, and says that when the market trades into that level the bear flag suddenly does not look so bearish 20:25, 20:31, 20:35, 20:44, 20:50.
On the daily chart he says he is identifying the price action below the lows using the bodies of the candles rather than the wicks, and that this run below was really making a run one more time for the stops beneath those candles 21:00, 21:25, 21:32, 22:03, 22:09. He also says, in the same passage, that all these wicks trade down there and that the heaviest volume sits inside the wicks; the two statements sit next to each other in the recording and are reported here as he says them rather than reconciled 21:11, 21:20. He notes that this is the first return into that area in a month to a month and a half on the pair he calls the Aussie 21:43, 21:50, 22:16.
His stated conclusion from that is that when the market starts creating the pseudo bear flag, he does not see a bear flag, and instead starts looking for reasons to expect higher prices 22:16, 22:21, 22:26. He is explicit that he does not simply buy as the market starts to rally: he says he wants to wait for a swing high to be created and then violated to the upside, 22:30, 22:36.
Once he has the swing high violation, the rest of his description is mechanical: the market comes back down to the last bearish candle, and he turns the idea from a bear flag into a buying opportunity with a stop below the flag’s low 22:36, 22:46, 22:51, 22:54, 22:58. He gives the long as 74.70, saying he will call it 74.70 23:08, 23:10.
His expectation is a range fill of all the down candles, then the body of the last up candle as an upside objective, and then the stops sitting above the equal highs, which he calls a clean level 23:16, 23:23, 23:31. He then points out another bearish order block, one more after that, and equal highs again, and says he could be looking at that as a liquidity pool, with a further area above as an objective for what he calls a really long-term type scenario 23:47, 23:55, 24:03, 24:07.
What he narrates next is the sequence resolving. He says price responds off that level rather handsomely, comes back a little in retracement to populate more buying, then comes up and sweeps out the equal highs he marked 24:07, 24:16, 24:20, 24:29. He quotes the high on one candle as 75.73 and says those stops were cleared out, which is why he says a little rejection showed there 24:38, 24:42, 24:44, 24:47.
He continues through the same chart: price rallies up into closing the range and then blows through its high, the next area of liquidity is the liquidity pool he had marked, price trades through it, makes another small consolidation, runs up into a rejection, sweeps the bearish order block he had identified, and then, as he puts it, clears out the old highs over there just for good measure 24:47, 24:50, 24:56, 24:58, 25:02, 25:10, 25:12, 25:14.
He then notices one more instance while scrolling and takes it as a second illustration in the same vein. Price trades down and creates a small consolidation that is slightly higher, which he says would be viewed as a bear flag 25:28, 25:32, 25:36, 25:37. His stated response is again to wait for a swing high to be violated, and he notes that even though price creates a lower low, which would have looked like the move was going to keep going lower, the market puts the brakes on and goes higher 25:39, 25:43, 25:47, 25:51, 25:53. With the swing high violated, he goes down to the last down candle, draws it out in time, and calls that the buy 25:56, 25:59, 26:00, 26:01, 26:03.
Key ICT False Flag Takeaway
He gives the takeaway directly. When he looks at price action, he says he is looking for reasons why other traders will view the opposite side of the marketplace 26:11, 26:15, 26:21. He says he is not always just looking for what would make him take the trade, and that he is also looking for the marketplace to suggest how retail-minded traders are going to view things, in the form of classic chart patterns and in the form of indicators 26:24, 26:28, 26:40.
His homework for the viewer is a chart study rather than a rule. He says he wants viewers to study going back through old data, to find areas where bear flags and bull flags looked as though they called for the obvious