
Key takeaways
ICT’s Month 02 mentorship session presents a hypothetical Australian dollar trade framework using daily reference levels, an hourly liquidity read, then fifteen-minute and five-minute entries from a bullish order block.
Read the full summary
ICT’s Month 02 mentorship session presents a hypothetical Australian dollar trade framework using daily reference levels, an hourly liquidity read, then fifteen-minute and five-minute entries from a bullish order block. The illustration risks 2% of a $1,000 account with a stop under 10 pips, takes half off at 3R to bank 3%, and leaves the remaining 1% risk portion for higher-timeframe liquidity pools, with chart readings of 9R and 15R. A wider 20-pip stop is also proposed within an approximately 100-pip range, while monthly, weekly and daily levels are favored over indicators and supply-and-demand theory. Repeating the setup is claimed to produce over 10% monthly from first exits, over 21% by capturing half the range with runners, or over 46% by capturing the full range, but these scenarios assume repeated winners and omit a complete loss sequence. The exit approach prioritizes paying yourself through partial profits rather than demanding every pip, and 10% compounded monthly would multiply an account by about 3.14 after 12 months, roughly a 214% gain. Every performance figure is illustrative rather than verified, with no brokerage statement, confirmed fills, complete trade history, tested price data, or evidence that the returns are achievable or repeatable.
How we researched this article
BestProps used document-based research from primary firm sources, checked September 25, 2026. The complete source list, scope, limitations, and commercial-state record appear near the end of this article.
ICT Trade Framework Behind the Case Study
He opens by saying the session keeps to the same theme and the same case study on the Australian dollar, and that it goes quickly through what the previous two sessions already established (0:30, 0:39). The recap is specific: a level identified on a daily chart, brought down to an hourly chart, with buy stops above the market that he treats as resting liquidity pools, and a range he puts at as much as a hundred pips (0:45, 0:56).
One point he makes in that recap is about timeframes rather than levels. He says the market does not need to supply an hourly setup for a trader to use the risk, because a fifteen-minute timeframe and the framework price gives there can serve instead, and that the fifteen-minute chart can itself be reduced to a five-minute chart (1:34, 1:56). The stop is framed off a bullish order block on the lower chart, and he notes that a three-to-one reward-to-risk unfolded just below the first area of buy stops – and, he adds, nowhere near the objectives framed on the hourly chart (2:00, 2:12).
ICT Trade Risk and Partial Exits
He then assumes the trade was taken with two percent at risk (2:34). His description of the exit is precise about the sequence: half the position comes off when the trade reaches three-to-one, and he points out that the buy stops above do not have to be taken out for that to happen (2:41, 3:04). Because the half coming off carries one percent of the risk, he calls that three percent made on the trade, and the second portion stays on for the liquidity pools referenced on the hourly chart (3:17).
From there the narration follows the illustration upward as price takes the buy stops and reaches into higher liquidity pools. He counts nine R for the movement into the fifteen-minute pool, describing it as making nine dollars for every dollar risked, and then says that once the next stop area clears he would have fifteen R (4:04, 5:12). These figures describe what he says is visible on his own chart while he is walking through it; the recording does not establish the price data behind them, and this article does not present them as verified outcomes.
He treats the decision at that point as a genuine crossroads rather than a rule: a trader could take a portion of the remaining one percent off, or leave it to reach for the higher objectives. He says the choice is the trader’s, gives his own preference as taking something off because the market sits in a nice liquidity pool on the fifteen-minute timeframe, and concedes he could be wrong and the market could reverse there (4:25, 4:52).
ICT Trade Framework With a Wider Stop
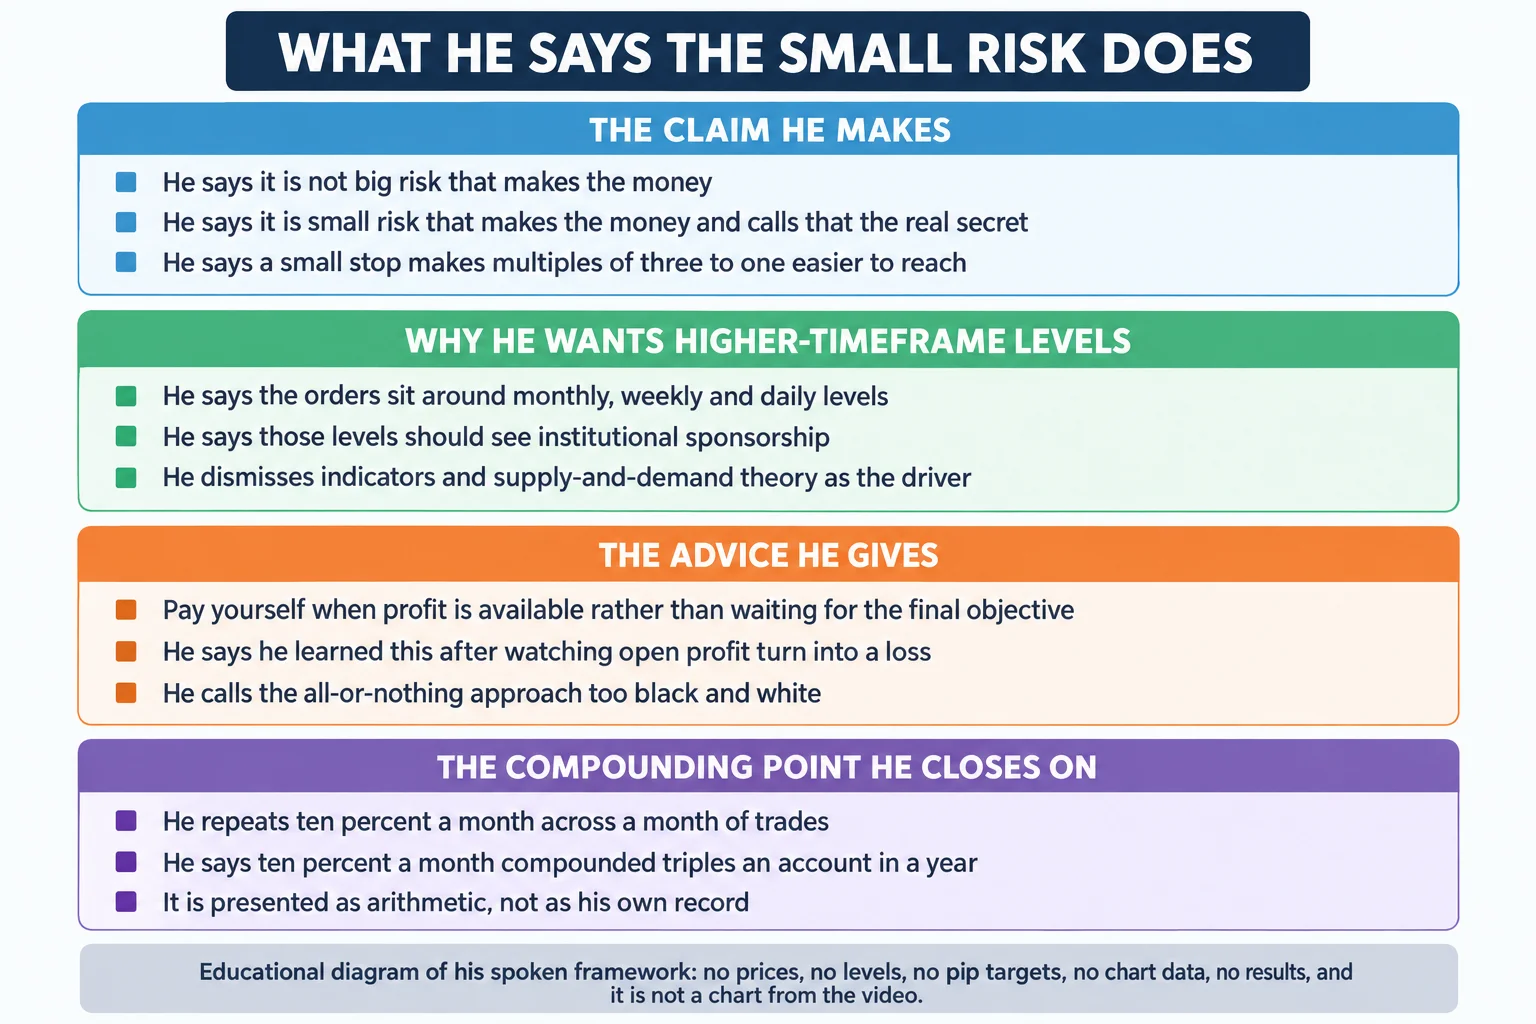
He then tests his own example by loosening the assumption. He says the stop used was ultra short-term, under ten pips, and asks whether a more comfortable twenty-pip stop could still pay out, answering that there is no reason it would not (6:18, 6:27).
The part he asks the listener to focus on is the size of the range rather than its endpoints. With about a hundred pips framed between where he was looking to buy and where he thought price would go, he says a trader does not need the absolute high or the absolute low – what he calls the lion’s portion of the move is enough (6:59, 7:07). He presses the point as a question: does the listener think they will get every pip of every range they identify, and he says insisting on that leads to frustration (7:11, 7:27).
ICT Account Illustration for 10 Per Month
At 7:56 he puts numbers on it. He assumes a one-thousand-dollar trading account, a stop rounded to ten pips, and the market allowing the three-to-one multiple – which he says would already have paid three percent (7:58, 8:09). He then restates the structure in percentages: a two percent trade, half taken off at three-to-one with the first one percent of risk, profits booked at thirty pips, and three percent banked (8:39, 9:08).
His conclusion from those numbers is the sentence the session is built on: if the first three-to-one objective is all a trader ever gets, that by itself is over ten percent in a month (9:14, 9:17). It is worth being precise about what that claim rests on, because the arithmetic and the trading are different things. Three percent on one trade does not become ten percent in a month unless the same three-to-one outcome is repeated several times in that month, and the illustration supplies no sequence of trades, no losing trades and no evidence that the setups appear at that frequency.
He also states what a trader would have to be doing for the illustration to apply at all: the trades have to be framed on levels he says should see institutional sponsorship – monthly, weekly and daily levels, which he says are where the real orders are – and he explicitly dismisses indicators and supply-and-demand theory as the driver (9:43, 9:55, 10:05). That order-flow account of why price moves is his interpretation; the recording does not measure it.
ICT Trade Figures for the Month and Runner
He then extends the illustration to the second portion. If half of the hundred-pip range were captured on the remaining one percent, he puts the additional figure at over twenty-one percent for the month when repeated week after week, on top of the three percent from the first half (10:21, 10:45, 10:59). If the full range were taken, he puts the second portion at over forty-six percent in one month (11:59, 12:05).
Those are the largest numbers in the session and they carry the heaviest assumptions, so they are worth stating plainly as assumptions. Each one presupposes that the same weekly pattern repeats, that the first portion is banked every time, that the second portion reaches the stated objective, and that no losing trade interferes. He states his own qualification in the middle of it – that taking down a hundred pips a week may require a second or third trade, and that the trader will lose and will encounter barriers like everyone else (13:47, 14:04, 14:10). He also says he is not telling the listener to force a hundred pips every week (13:53).
What he says about the runner itself is a claim about relative size: the second portion of the trade will always make more than the first, because the first is exited early (14:20, 14:29). That is not something the recording demonstrates; it follows only in the cases where the second objective is actually reached.
How ICT Traders Make Monthly Withdrawals
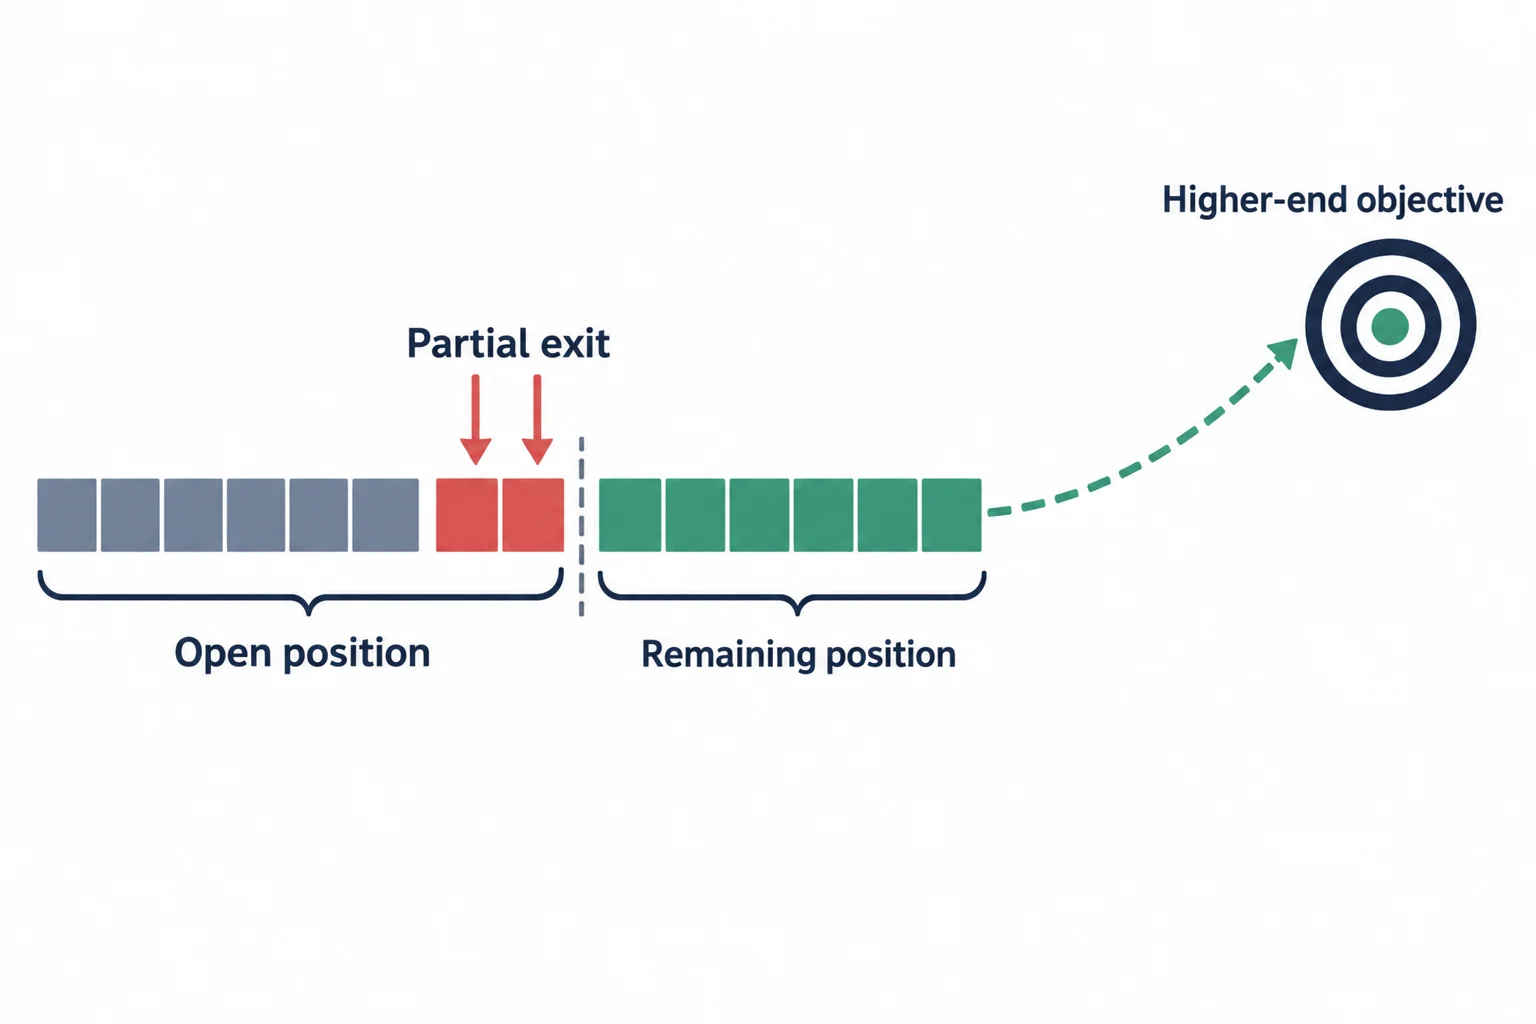
A large part of the session is an argument about exits rather than entries. He says taking a partial is not a weakness or an impediment to making more money, and he is blunt about the traders or educators who say otherwise – his view is that such criticism comes from people who are too black and white about profit taking (14:29, 15:01).
The reason he gives is experience rather than theory. He says he has watched really handsome profits sitting in a trade come all the way back and turn into a loser, or come back and take him out at a modest stop and then run in his favour, and he calls that very frustrating (15:07, 15:22). He says he does not demand everything at his higher-end objective, and describes the psychological effect he is after in fairly physical terms – that taking some skin off the trade means the position has already paid you for your time and focus (16:16, 16:40, 16:50).
He also works the smaller variant of the same point. If a trader could not manage the ten-pip version and stuck to the one-hour setup with a twenty-pip stop, he says a fifty-pip run on the second portion after paying themselves a modest thirty pips is still over ten percent on that second portion alone (15:41, 15:53, 16:22).
ICT Compounding Framework for 10 Per Month
He closes on compounding. He says ten percent in one month on the back end of the trade is already counted separately from the first portion, that the first portion alone leads somewhere at twelve months, and that ten percent compounded over a year works out to over three hundred (16:40, 17:04, 17:24). He asks where else a person would get a three-hundred-percent return, says no money manager or fund manager would claim to do it for you, and ends on tripling the money every year (17:36, 17:46, 17:54).
The compounding arithmetic itself is sound as arithmetic: growing an account by ten percent in each of twelve consecutive months multiplies it by about 3.14, an increase of roughly 214 percent – the figure he rounds up to over three hundred. What that calculation cannot do is establish that the monthly return is achievable or repeatable, and he does not offer evidence that it is. The session contains no brokerage statement, no verified fills, no complete loss sequence and no subsequent outcome for the illustrated setup.
What This ICT Trade Article Does Not Claim
Everything numeric in the session comes from a hypothetical illustration. The account balance, the two percent risk, the ten-pip and twenty-pip stops, the three-to-one exit, the nine R and fifteen R readings, and the ten, twenty-one, forty-six and three-hundred percent figures are inputs and arithmetic the speaker supplies while narrating a chart. The recording measures none of them and reports no result.
The claims that small risk is what makes the money, that liquidity pools above old highs will be reached, that monthly, weekly and daily levels carry institutional orders, and that taking partials is superior to holding for a final objective are the speaker’s market interpretation and his stated preference. They are attributed to him here rather than presented as established fact, and no part of the method has been tested or verified in this article. This is educational writing about a stated framework, not investment advice or a claim of profitability.
ICT Trade Date Identity and Transcription Notes
The upload date and the series position are separate facts. The YouTube watch page shows this recording published on 27 August 2022 and listed at 1085 seconds, about 18 minutes 5 seconds, while the recording introduces itself as continuing the Month 02 case study from the previous two sessions (0:30, 0:39). No contradiction is asserted between the two, and nothing in the audio dates the chart shown.
This article was written from automatic speech-to-text of the original audio rather than from a checked caption track, so a few renderings are ambiguous and are flagged rather than silently corrected. The transcription reads “a hundred pit range” where pip range is meant, repeatedly (10:25), and “the Lions portion of the move” where lion’s share or lion’s portion is meant (7:07). One figure in the wider-stop passage is transcribed as “another 21 plus percent” (10:59) and is reported here as the speaker’s stated figure without being reconciled to a formula. The exact opening words of the recording are not recoverable from the transcript, whose first clear segment begins mid-sentence about the month, so the session is described by the title of the series rather than by a reconstructed opening line.
Watch the Original ICT Trade Recording
ICT Mentorship – Core Content – Month 02: How Traders Make 10% Per Month
The Inner Circle Trader · published to YouTube on 27 August 2022 · listed at 1085 seconds, about 18 minutes 5 seconds. This video is the primary source for every timestamp link above.
The recording is not embedded here because the video owner has disabled playback on other websites. That was tested on 15 September 2026 from a BestProps page origin at both desktop and mobile widths: the embedded player loads and then reports “Playback on other websites has been disabled by the video owner”, with no playable stream and no duration reported in either case. The link above opens the recording on YouTube itself.
ICT Trade Framework Resources
These are the sources checked for this article. The CFTC pages are the regulator’s own advisories – one on trading systems sold to the public, one on foreign currency fraud – and they are relevant context for any claim built on a monthly return figure, including this one. Neither assesses this speaker or tests anything he says. Any ICT, smart-money or third-party indicator, script, note set, transcript pack or re-upload circulating outside the publishing channel’s own page is unofficial and untested here.
- [1] ICT Mentorship – Core Content – Month 02: How Traders Make 10% Per Month The Inner Circle Trader (primary source; watch page and metadata read 15 September 2026, published 27 August 2022, listed at 1085 seconds).
- [2] The Inner Circle Trader (official YouTube channel) (read 15 September 2026), the publishing channel for the Month 02 mentorship series this session belongs to.
- [3] U.S. Commodity Futures Trading Commission (Commodity Trading Systems Sold on the Internet) (read 15 September 2026), the regulator’s advisory on claims made for trading systems sold to the public. Context for reading any return-based model, including this one; it is not a finding about this speaker.
- [4] U.S. Commodity Futures Trading Commission (Foreign Currency (Forex) Fraud) (read 15 September 2026), the regulator’s advisory on forex fraud, relevant because the case study in this session is a currency pair. Background on how returns are marketed to retail traders; it contains none of the lesson’s rules or figures.
Source: ICT, ICT Mentorship – Core Content – Month 02: How Traders Make 10% Per Month, The Inner Circle Trader, published 27 August 2022. Captions were not available for this recording, so the transcript is automatic speech-to-text of the original audio under SHA-256 ba167ec1c563a6f7b665a3ae852b30e12aa373a4565e5db06cf6d365ace3f4f4. Educational write-up of the speaker’s own stated illustration; it is not trading advice, and none of the percentages, risk figures or outcomes described above has been tested or verified here.