
Key takeaways
This is the second module of the second month of the ICT Mentorship, and his subject is how he frames a low risk trade setup 0:27.
Read the full summary
This is the second module of the second month of the ICT Mentorship, and his subject is how he frames a low risk trade setup 0:27. His definition of lower risk is narrow and worth quoting in substance: transposing a higher-time-frame level onto a shorter chart lets you cut the pips between entry and invalidation, and by default that is lower risk 2:43. He works one Australian-dollar example down three time frames. On the hourly form the entry was 75.42 with a 20-pip stop below the mean threshold of the order block; on the 15-minute chart he takes a down candle sitting on the 75.12 level and puts the entry at 75.20 with the stop at 75.07, which he puts at 17 pips; on the five-minute chart he adds the spread to buy at 75.15 with the same 75.07 stop, under 10 pips, and measures a multiple of 3R against the nearby highs before the hourly objective is reached 4:53, 6:28, 8:01, 8:20. Every level, pip figure and ratio in that walkthrough is his own reading of a chart he was displaying, and the review behind this article read the transcript without viewing the recording. He closes with the condition that matters most, that the shorter stop is not a licence to place ultra tight stops on arbitrary entries 9:49.
How we researched this article
BestProps used document-based research from primary firm sources, checked September 25, 2026. The complete source list, scope, limitations, and commercial-state record appear near the end of this article.
This page covers ICT Mentorship – Core Content – Month 02 – Framing Low Risk Trade Setups, a recording published by The Inner Circle Trader. He opens by identifying it as the second module of the second month of the mentorship, and says it deals specifically with how to frame low risk trade setups 0:31.
One boundary matters before the detail. This is a short lesson built almost entirely around one instrument and one set of levels, and every number in it — the entries, the stops, the pip distances and the reward multiple — is his own description of a chart displayed on screen. The transcript behind this article is an automatic transcription of the audio, not human-verified captions. No fill, spread, outcome or performance has been independently verified for this page, and nothing in the lesson is a recommendation to take a position.
What he says makes a setup worth taking
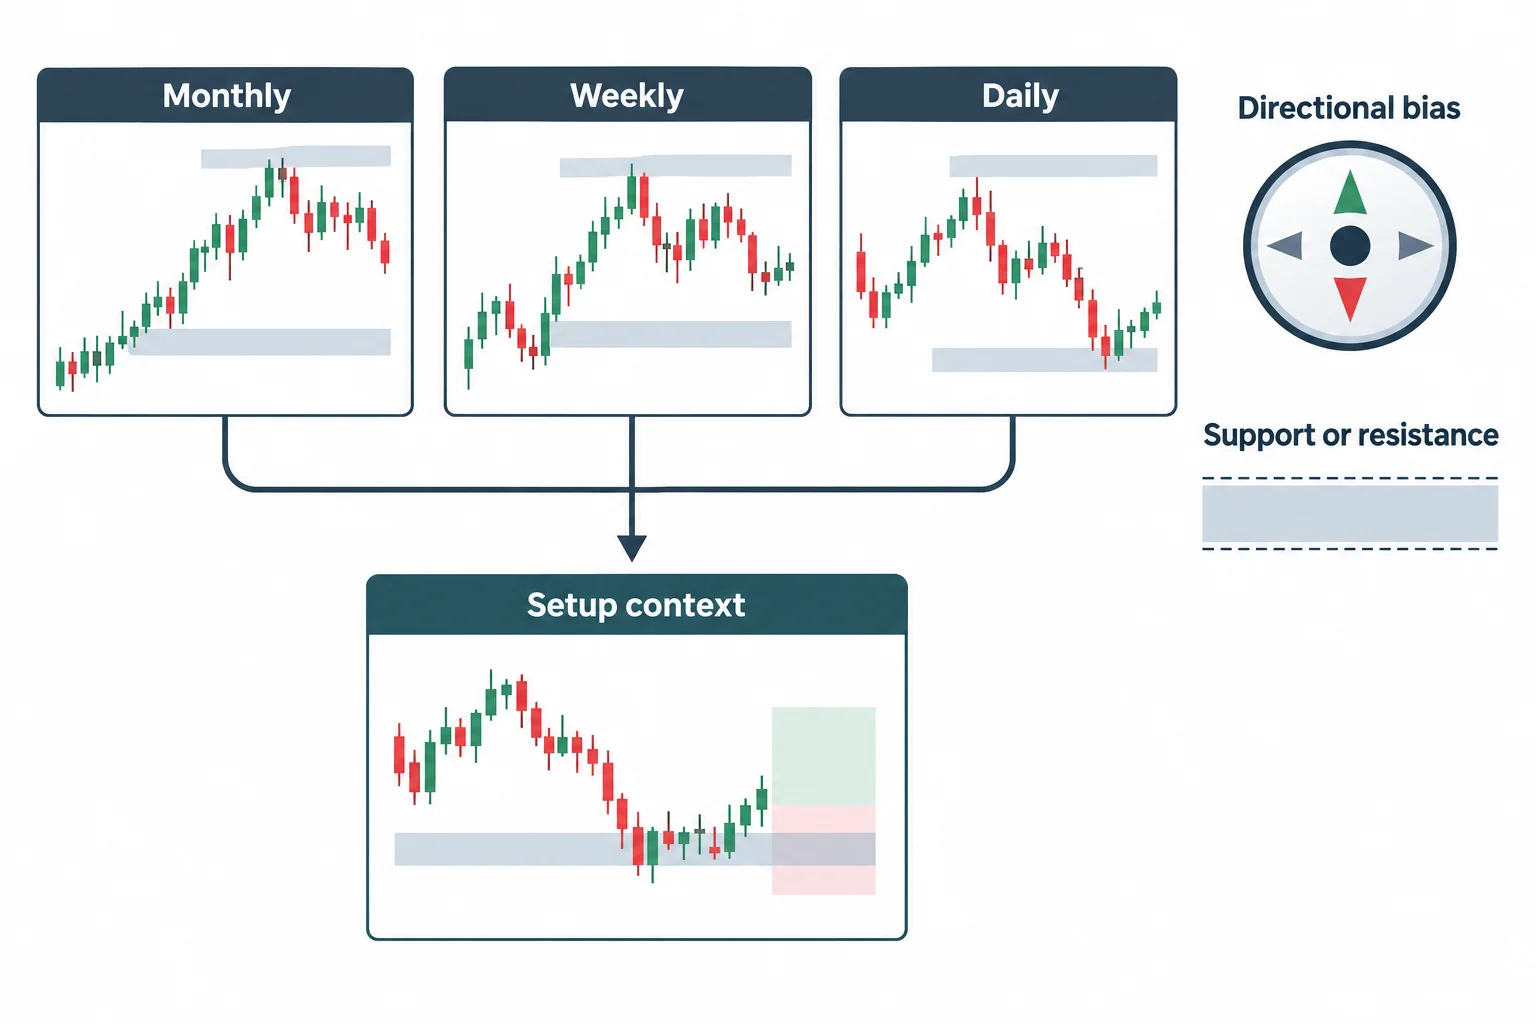
He begins by refusing to start with the short-term chart. Before considering how to frame anything, he says you have to consider what makes a setup worth taking at all, and his answer is that selecting setups on higher time frames is ideal and is the primary function of a high-odds trade 0:38, 0:44, 0:49. The higher time frame, in his framing, is what supplies the directional bias, the institutional order flow and the support or resistance idea that frames the buy or sell 0:53.
His stated reason is about who he believes is on the other side of the chart. He says large institutions and banks analyse markets on a daily, weekly and monthly basis, and that the levels he is looking for are the ones aligned with institutional order flow; without that understanding across the monthly, weekly and daily time frames, he says, your exposure to high probability setups is limited 1:08, 1:17, 1:23. That attribution of higher-time-frame levels to bank and fund activity is his interpretation of how price is delivered; the lesson supplies no order flow, position or fund data, and it is reported here as his stated rationale rather than as a demonstrated fact.
He also makes a practical case for the higher time frames that has nothing to do with edge. Setups there, he says, form slowly and give ample time to plan, which suits people who cannot sit in front of intraday charts because of business, jobs or other commitments; in his words you do not necessarily need to be a day trader to frame low risk, high probability setups 1:34, 1:50, 2:03.
His definition of lower risk
He states the core claim before showing any chart. The higher time frame has more influence on price, which is why he focuses there; the conditions that made a setup valid on the higher time frame can then be refined on a lower one; and transposing those levels down is what lets him reduce the pips at risk in the stop 2:11, 2:22, 2:34. The conclusion he draws is that refining the higher-time-frame levels onto shorter charts permits smaller stop placement, and that this is by default lower risk 2:43.
It is worth being precise about what his definition does and does not say, because it is the kind of claim that reads like a guarantee. What he is describing is a shorter distance between the proposed entry and the level at which the idea is wrong — on the same underlying trade thesis, not a different one. He is not claiming the trade is more likely to win, and he says as much at the end of the lesson when he warns against attaching very tight stops to arbitrary entries 9:49. A shorter stop is reached by less adverse movement, so the reduced distance cuts both ways, and the lesson does not present evidence that the lower-time-frame entry improves the odds.
The daily premise he is working from
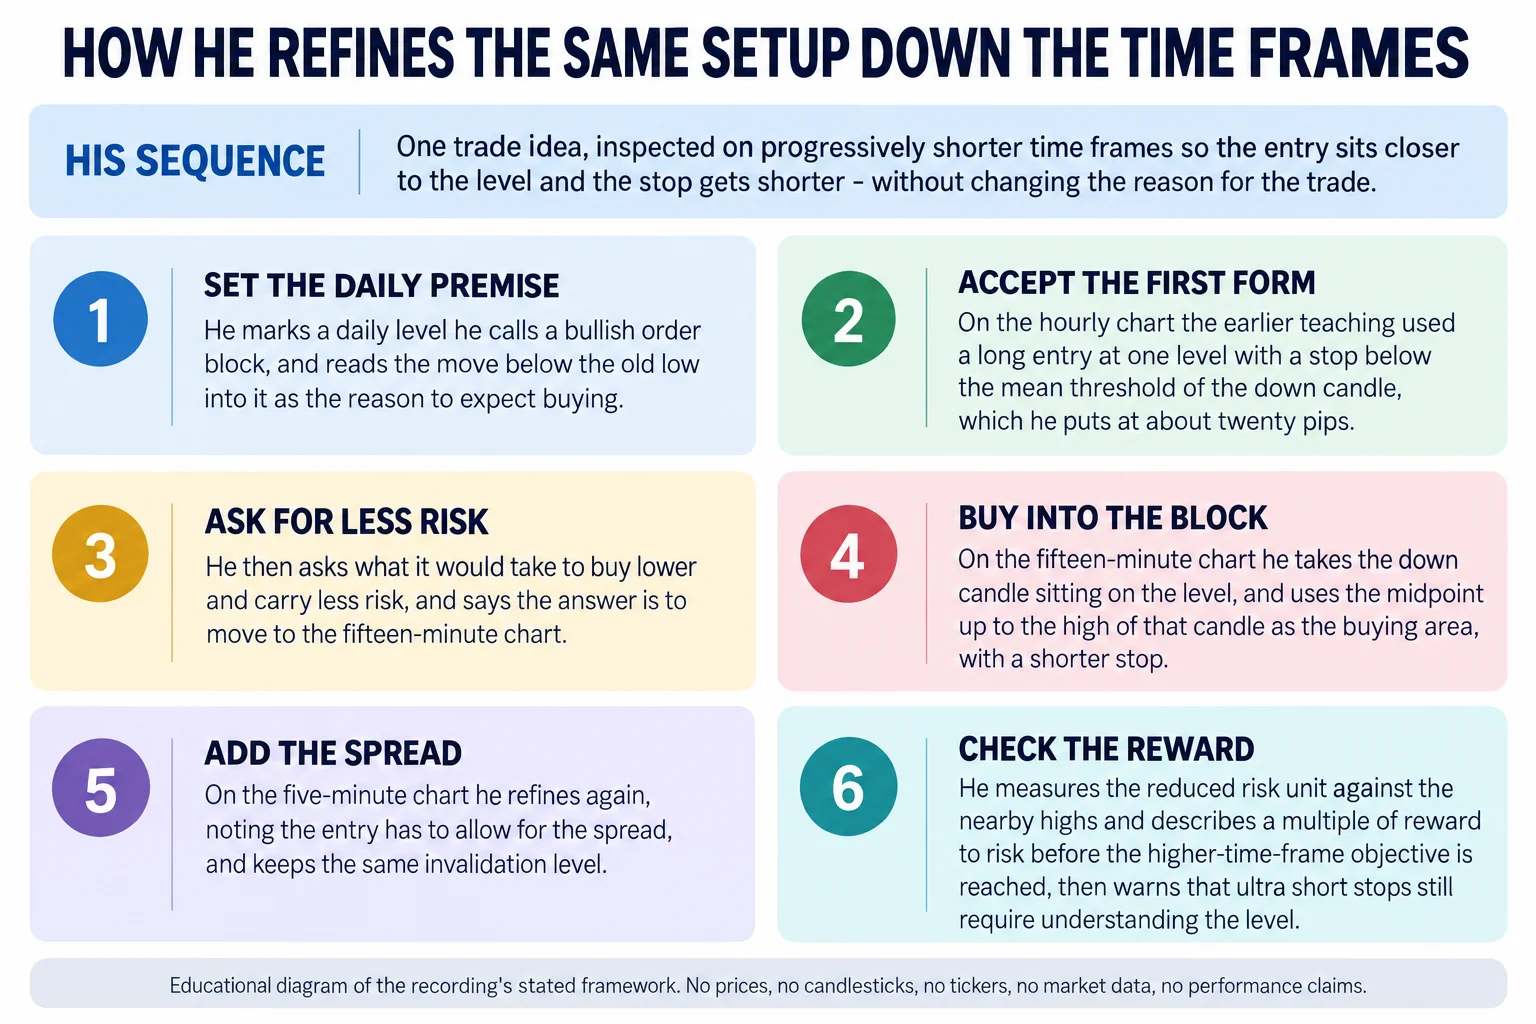
He reuses the Australian-dollar chart from the previous teaching deliberately, telling the viewer it is exactly the same chart and that he is going to amplify on it by dropping two scales lower 3:12, 3:27. The reference level is the daily line at 75.12, which he says is delineating a daily bullish order block 3:34, 3:38.
The reasoning he attaches to that level is the part he stresses. He points out an old low with price passing through it down into the higher-time-frame level, and then says plainly that simply going below old lows is not enough to expect a reversal 3:43, 3:48. What that setup needs instead is a higher-time-frame reason to expect buying below the old low, and his reason is that 75.12 is an old bullish order block where banks have bought before, so a return into it is where he expects the same thing to be attempted 3:56, 4:00, 4:08.
On the hourly chart he notes a low being violated into that key daily support, and marks the buy stops resting above as upper-level objectives framed on the trade 4:12, 8:28. He is explicit that this is not framed as a scalp or a day trade; he says it is something intended to give more magnitude for hauling in pips 4:34, 4:40.
The hourly form he is comparing against
He then recalls the earlier formulation so the comparison has a baseline. In the first teaching of that month, he says, the down candle was treated as the bullish order block and 75.42 was the long entry, with a 20-pip stop placed below the mean threshold of that down candle 4:53, 4:57, 5:01. The mean threshold — the midpoint of the order-block candle — is a recurring reference point in his material and is used here as the line the stop sits behind.
His question at that point is the hinge of the whole lesson: what if you want a smaller stop than 20 pips, and what if you want to be buying lower with much less risk exposure 5:07, 5:13. His answer is that this requires dropping to a 15-minute chart 5:26.
The 15-minute refinement
On the 15-minute chart he says the picture is very close to the hourly one: there is an old low, price trades below it into the same 75.12 level 3:38, 5:37. The buy order that would be needed on the hourly chart way up above is one option; the other is to focus on the area where price actually is 5:43, 5:48.
He identifies sell stops resting below the old low as the orders a buyer can be paired with on the smart-money side, and reads the trade into 75.12 as a Turtle Soup long setup — while noting the advantage that price does not have to travel back up to the higher entry before buying begins 5:55, 6:03, 6:05. Turtle Soup is his own term for that run on the old low, and it is used here in his specialised sense rather than as a standard definition.
The mechanics come next. He takes the down candle sitting right off that level and explains why it qualifies as a bullish order block: the candle after it trades through it 6:12, 6:18. The buying area is then the midpoint of that candle up to its high, which puts the entry at 75.20 with the stop down at 75.07 6:23, 6:28, 8:04. He adds the condition he attaches to the level — if it is going to go higher, it should go higher from there rather than trade down to the stop — and totals the distance at a 17-pip stop 6:35, 6:41. His stated gain is positional rather than directional: the entry sits much closer to 75.12 than the hourly one did, and it is achieved on a 15-minute chart 6:53.
The five-minute refinement and the reward multiple
The third pass goes to a five-minute chart, and he says the only thing being changed is the entry, with 75.12 still the level and the refinement starting from the 75.20 entry 7:12, 7:28. Inside that area he describes another down candle hitting the same daily bullish order block, and notes that it gets violated, which is again what makes it usable as a bullish order block 7:40, 7:46.
Two ways of setting the entry are offered: buying from the open or high of that down candle down to its midpoint, or simply taking the 75.12 level and adding the spread, which he says puts the entry around 75.15 7:50, 7:58, 8:01. The stop stays at 75.07, which he puts at less than 10 pips on the buy 8:04, 8:08.
He then does the arithmetic that the lesson is built around. Refining the risk to eight pips, with a first profit eight pips above and a second and third, gives him a multiple of 3R before the buy stops above the old five-minute high are even reached 8:15, 8:20. He immediately distinguishes the two sets of stops: the ones being taken out at that point are five-minute stops, not the buy stops framed on the hourly chart 8:32. The multiple is defined as three made for every one risked, and he notes price had already moved 24 pips up from the entry with the stop eight pips below it 8:45, 8:50, 8:56.
The comparison he draws is with the hourly entry rather than with any result: the trade reaches the level that the hourly entry would have assumed, but with less distance at risk, producing a three-to-one reward-to-risk on his numbers 9:15, 9:22, 9:30. That three-to-one is his stated arithmetic on a chart he was displaying at the time, and the transcript supplies no fill, no commission, no slippage and no completed outcome, so it is reported here as an illustration rather than as a result.
His closing condition
He finishes by naming the limit of the technique, and it is the part most easily lost if you only read the levels. He says it is remarkable how a setup can be refined down to smaller time frames, and that you do not have to accept big, super-wide stops 9:40, 9:43. What the method does require, in his words, is that you understand what you are doing and why you are doing it, because you cannot simply place ultra short stop orders without understanding the price action and why it should be responding at those levels 9:46, 9:52.
What this lesson does and does not establish
What it establishes is a repeatable procedure with the steps made explicit: take a level identified on a higher time frame, wait for price to trade into it, identify the last down candle that price has already traded through, and use the midpoint up to its high as the entry zone with invalidation on the other side of the level 6:28, 7:50, 8:01. The one genuinely transferable lesson does not depend on his terminology at all: the distance between entry and invalidation is a choice, and moving the entry closer to the level that justifies the trade is how that distance is reduced.
What it does not establish is that the refinement improves the trade. The lesson contains no trade log, no position size, no account result and no sample of outcomes, and the three-to-one figure is his measurement on one chart rather than a documented sequence of trades. Two structural points deserve stating plainly. First, the reward multiple is measured from a reduced stop, so it is arithmetic about distance and not evidence about probability; the lesson never claims the trade became more likely to work, and a shorter stop is reached by less adverse movement than a wider one on the same thesis. Second, the whole construction rests on his premise that 75.12 is a level where large participants previously bought, which is his inference from past price behaviour rather than a measurement of institutional activity; nothing in the recording supplies order flow, positioning or fund data to support it, and the buy stops he refers to are assumed rather than observed. The specific numbers — 75.12, 75.42, 75.20, 75.15, 75.07, the 20-pip, 17-pip and sub-10-pip stops, the eight-pip target and the 24 pips of movement — are all as spoken in an automatic transcription of a chart being pointed at, so they are reproduced because they are how he describes the example, not because they have been checked. Third-party ICT material found anywhere other than the publishing channel’s own pages — indicator scripts, note packs, re-uploads, transcript packs — is unofficial, has not been tested for this article, and no claim is made about its accuracy or whether it repaints.
ICT Mentorship – Core Content – Month 02 – Framing Low Risk Trade Setups
The Inner Circle Trader · watch page lists upload 27 August 2022 · 596 seconds, about 9 minutes 56 seconds. The lesson identifies itself as the second module of the second month of the mentorship, and it is the primary source for every timestamp link on this page.
The recording is not embedded here. An embedded player was tested directly on 15 September 2026 from a BestProps page origin at desktop and mobile widths: the frame loads but then reports “Playback on other websites has been disabled by the video owner”, with no duration and no playback progress, while the video itself is publicly playable on YouTube. No half-working player is left on this page.
Watch the original recording
This is one of the shorter lessons in the series and it is almost entirely a screen-share, so the chart work is the part that repays watching rather than reading: the whole point is seeing where the entry moves to on each successive time frame while the level stays fixed. Every timestamp link above opens the recording at the moment referenced, so the levels and pip distances can be checked against the spoken source directly.
Resources
These are the sources checked while preparing this article. The two regulator pages are general material about how technical-analysis claims and short-horizon trading are described by public authorities; neither evaluates this speaker, tests the refinement described in the recording, or endorses anything in it.
- [1] ICT Mentorship – Core Content – Month 02 – Framing Low Risk Trade Setups — The Inner Circle Trader (primary source; watch page read 15 September 2026, listed duration 596 seconds, publicly playable).
- [2] The Inner Circle Trader — official YouTube channel (read 15 September 2026) — the publishing channel for the mentorship series this recording belongs to.
- [3] CFTC — Fraud Advisory: Commodity Trading Systems Sold on the Internet (read 15 September 2026) — states that technical analysis attempts to predict future price movements based on historical prices, price relationships and price trends, and warns that hypothetical trading results are typically simulations over historical data rather than executed trades. Relevant to the three-to-one figure quoted in this lesson.
- [4] Investor.gov (U.S. SEC) — Day Trading (read 15 September 2026) — describes day traders as rapidly buying, selling and short-selling throughout the day over very short holding periods and states that day trading is extremely risky and can result in substantial financial losses in a very short period of time; relevant to the discretionary, level-based trading described here.
A note on the transcription
The narrative above was written from an automatic speech-recognition transcript of the full original audio, not from human-verified captions, and the review did not watch the recording. That distinction matters here more than in a talk-only lesson, because this one is almost entirely a presenter reading numbers off a chart while he speaks. The transcript is internally consistent and produced no low-confidence segments, which is why the levels are reported at all, but several renderings need care. The instrument is never named in words in the transcript, so it is described here as the Australian-dollar chart only on the strength of his phrase about the Aussie dollar and the reuse of the previous lesson&’s chart 2:54. Decimals arrive without their decimal points in several places, so figures such as 75.12 and 75.07 are reproduced in the conventional quotation form rather than as the bare digits the transcript shows 3:34, 8:04. One passage at the start is clearly misrecognised: where the transcript reads “Yen probability setups” the sense of the surrounding sentence requires high probability setups, so the correction is noted here rather than silently made 2:03.
Source: ICT, ICT Mentorship – Core Content – Month 02 – Framing Low Risk Trade Setups, The Inner Circle Trader,