
Key takeaways
This is the third teaching of eight in the first month of the ICT Mentorship 0:36, and its subject is attention rather than strategy.
Read the full summary
This is the third teaching of eight in the first month of the ICT Mentorship 0:36, and its subject is attention rather than strategy. ICT first contrasts what he calls the informed or smart money perspective with the speculative, uninformed one, arguing that indicators such as overbought and oversold readings are the uninformed view of why price moves 2:59, and that smart money instead treats other participants as liquidity in the form of buy stops, sell stops and pending orders around recent highs and lows 6:36. The practical answer to his own question, “what specifically should you be focusing on right now?” 11:02, is to build a daily price action log from price charts 12:03: a daily chart showing twelve months and no less than nine 13:37, a four hour chart with about three months 13:50, a one hour chart with at least three weeks 14:02, and a fifteen minute chart with three to four days 14:08. On those charts he asks for quick departures from levels, recent highs and lows that have not been retested, clean or roughly equal highs and lows, the day and the session in which the weekly high and low formed, and each day’s high and low 14:43 16:56. He explicitly tells students to resist forecasting at this stage 14:19 and gives no entries, fills or performance results in the recording.
How we researched this article
BestProps used document-based research from primary firm sources, checked September 25, 2026. The complete source list, scope, limitations, and commercial-state record appear near the end of this article.
In ICT Mentorship Core Content – Month 1 – What To Focus On Right Now, the emphasis is on how a new student should spend their time rather than on a pattern to trade. He describes teaching the same mindset in reverse order from the usual retail approach 0:51, and most of what follows is his own market interpretation rather than an independently established account of how price moves.
Two perspectives, as he frames them
He sets up the lesson as a contrast between smart or informed money and what he calls the uninformed or speculative money, and says the two perspectives are diametrically opposed 1:54. He attributes to the uninformed view the belief that indicators drive price, with an overbought or oversold reading treated as the precursor to a move 3:10, and he says that was his own belief for years before it was broken 3:14. His instruction is to get indicators off the charts 3:42, and his reason is unusual: he says they will instead be used as a read on what uninformed traders are thinking 3:47.
From there he describes the smart money view as a liquidity provider’s view 5:01 5:07, in which those orders are provided at a premium and are expected to be returned to 5:20, and in which price is delivered to engineer efficiency for those entities 6:24. The liquidity in his model is concrete: buy stops, sell stops and pending orders resting above and below the most recently formed highs and lows 6:36. He supports the framing with general observations rather than method-specific evidence — a widely repeated statistic that ninety percent of traders lose their money 4:44, and the point that large funds are not automatically profitable, since investors putting money into a fund does not guarantee the fund survives 4:52.
His broader claims about who controls price are the part of the recording that should be read as opinion, and he states them as such. He argues that central banks are in absolute control of the price of their own currency 8:02, using an analogy about a store owner setting the price of their own goods 7:16, and cites the Swiss franc and euro de-peg as his illustration 8:10. He also says the aim of adopting this view is not to take sides: he tells students not to think in terms of victim or aggressor 8:36 and says the markets always trade efficiently, but in a way that is slanted toward the smart money 8:45. Whether that framing describes real market structure is not something this recording demonstrates, and nothing in it tests the claim.
He then narrows the whole mentorship to four principles of price delivery — retracement, expansion, reversal and consolidation 9:21 — and is explicit that he is not teaching them yet. The month of September, he says, exists to bring everyone to the same reference point, and he asks even experienced viewers who have watched his free tutorials to set that aside and start from this foundation 9:40. He also names the Interbank Price Delivery Algorithm as something that has to become familiar through repeated exposure 10:04, and tells students to suppress the desire for techniques and patterns before they have the framework 10:39.
The assignment: a daily price action log
The direct answer to his own question begins when he asks what a new student should focus on right now 11:02. The first instruction is to bring almost no previous knowledge into it, which he argues is easier for a beginner than for someone who has to unlearn an established approach 11:21. He is blunt that an early run of success proves nothing: he says he traded a non-institutional approach for nine months, that it was pure luck, and that it stopped working 11:51. Students who think familiarity with concepts such as optimal trade entry or order blocks is an advantage are told instead to go back to square one 12:56. The task itself is narrow: create a daily price action log using price charts 12:03.
He then specifies how much history each chart should display. The daily chart should show twelve months and no less than nine 13:37, without stretching to multiple years. The four hour chart should show about three months 13:50, the one hour chart at least three weeks 14:02, and the fifteen minute chart three to four days 14:08. The purpose he gives for the sequence is repeated exposure, which he says is the only route to understanding what price should be doing at any given point 10:09.
What he asks students to record is a specific list of observations, not predictions. He tells them to resist the urge to forecast price movements at this stage, calling it a problem that only leads to frustration 14:19. Instead, the log should capture:
- Levels from which price moved quickly higher or lower 14:43.
- Recent highs and lows that have not been retested, which he says are likely to be influential later 14:56.
- Areas where price left what he calls clean highs and clean lows — two roughly equal highs forming in close proximity, or the equivalent double bottom 15:20 15:26.
- Which day of the week the weekly high and low formed, and the time of day or session that produced them — whether it formed in London or in New York 16:36 16:39 16:41 16:48.
- Each individual trading day’s high and low 16:56.
The reasoning he attaches to the equal highs and lows is worth stating carefully, because he qualifies it himself. He says a clean high usually collects buy stops above it and that the market will usually come back up to run through them, while conceding that does not mean price will not continue higher 15:43. He makes the mirror claim for equal lows and sell stops 16:09, and says the market has a willingness to go down and test that liquidity 16:14 — while acknowledging that arriving at the level does not on its own establish whether price continues or reverses 16:18. His own explanation of why these levels matter is that this is how order blocks and liquidity voids are eventually identified 17:51.
One instrument, two charts, and how the levels move down
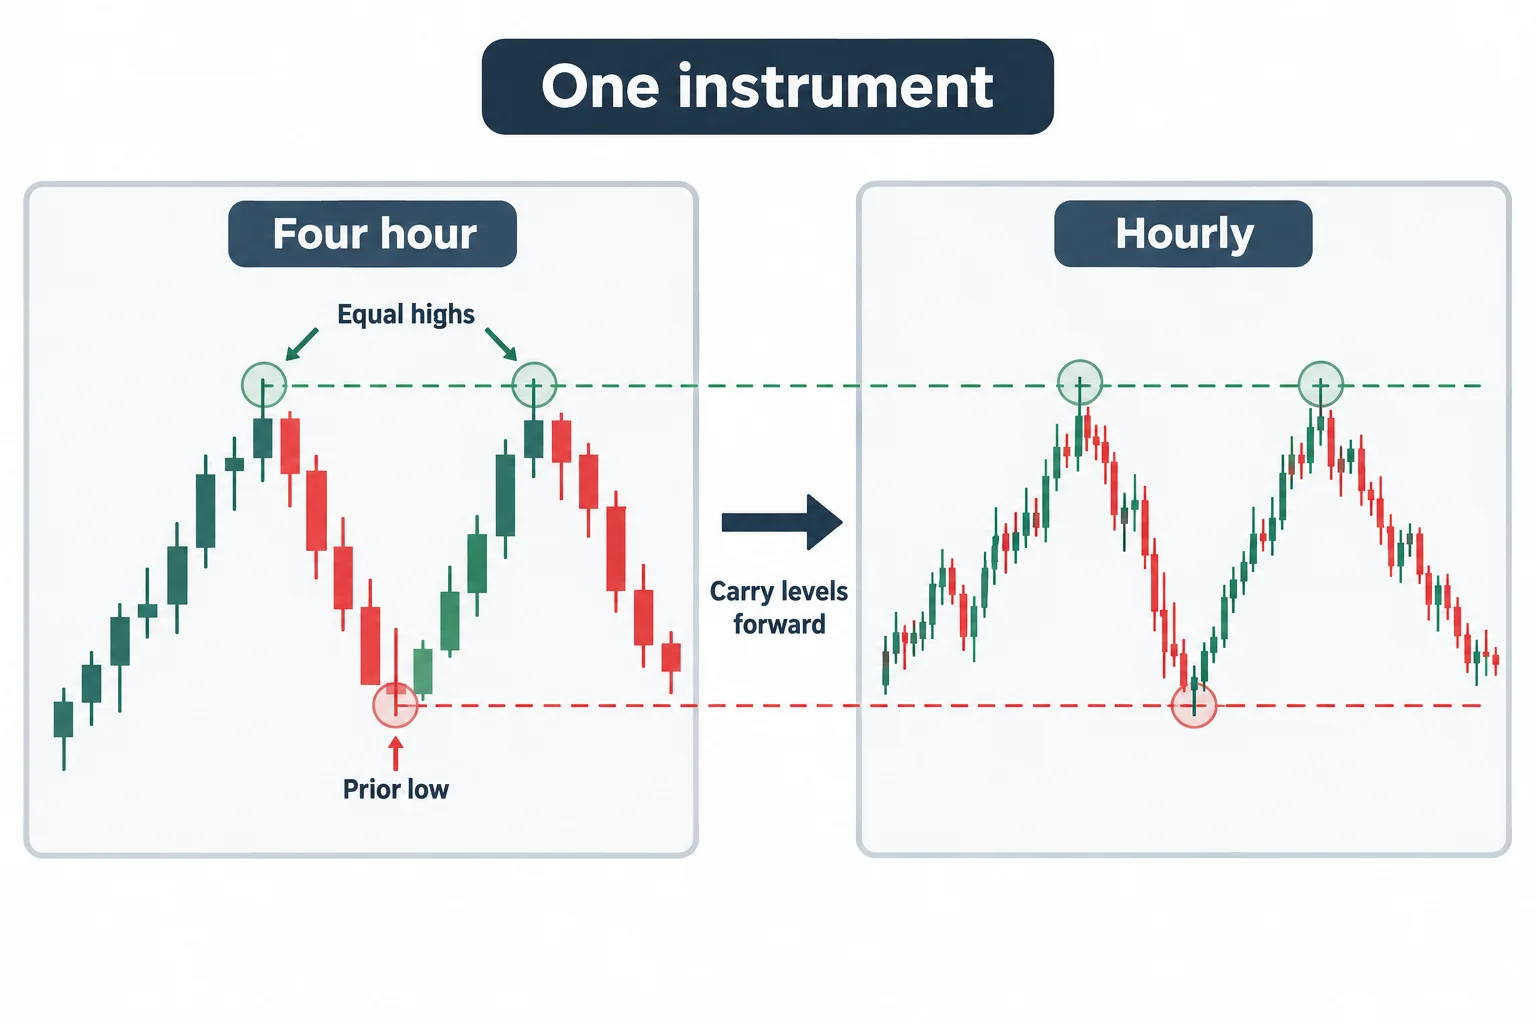
He tells students to work with a single currency pair 17:14, and names the Swiss franc as his own example 17:10. He recommends choosing something other than the British pound or the euro, because he will be demonstrating those pairs himself in the mentorship and a student will get more from a chart he is not covering 17:22. The starting point is the most recent highs and lows that the market has shown a willingness to repel from 17:47.
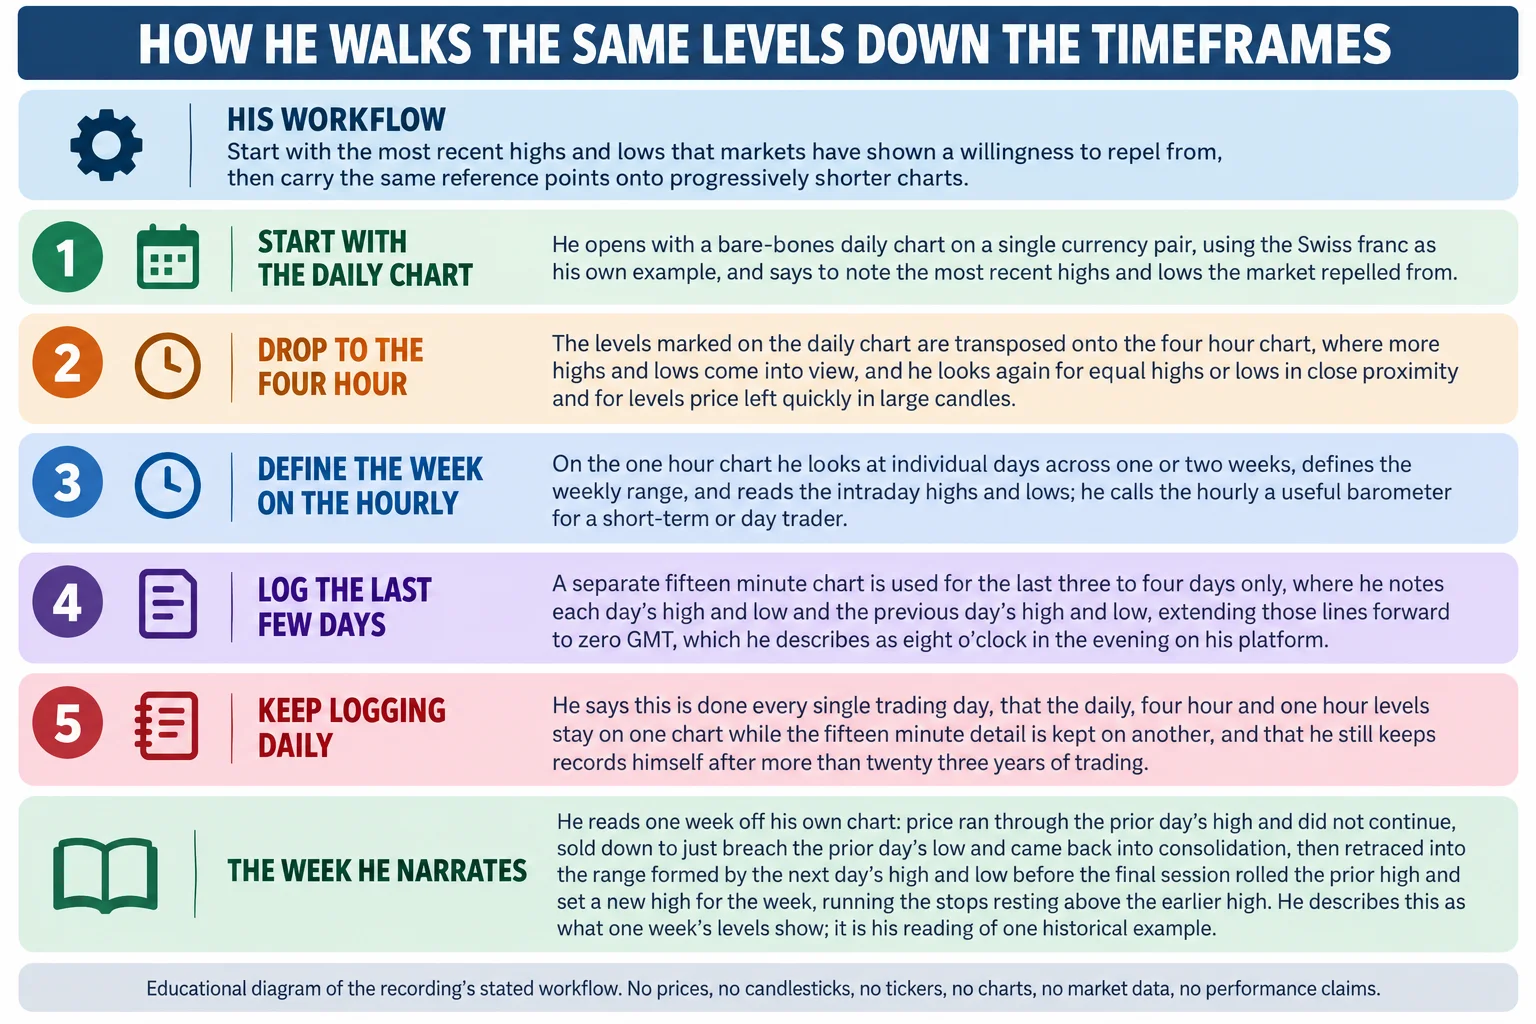
The workflow then descends one time frame at a time. He drops to the four hour chart, where the same levels are visible and additional highs and lows come into view, and those levels are transposed onto the four hour display 18:22. He repeats the search for clean equal highs and lows and for the wide candles that mark a fast departure from a level 18:38. On the hourly chart he looks at individual days across one or two weeks, uses it to define the weekly range and the intraday highs and lows 18:56 19:03, and calls the hourly a useful barometer for a short-term or day trader 19:11.
His instruction about chart hygiene is explicit. The daily, four hour and one hour reference levels stay on one chart, kept in that format separate from everything else 19:29, and he creates a second chart for the fifteen minute work, describing them as two independent charts on the same pair 19:44. The stated reason is practical: so the charts do not become too busy to read 19:54. He notes that a freshly loaded fifteen minute chart with nothing marked on it looks like noise and offers no frame of reference 20:09, which is why the same marking routine is applied to it, limited to the last three to four days 20:31. On it he notes each day’s high and low and the previous day’s high and low, extending those lines forward to zero GMT, which he describes as eight o’clock in the evening on his platform 20:48 20:52.
He says he keeps doing this himself after more than twenty three years of trading 21:28, and connects the habit to how professionals work in general, saying that people who are genuinely concerned about the market keep logs and journals 21:40. He also describes three charts in practical use: one held as the executable chart being watched for a setup, with the analysis charts referred to alongside it 23:55.
The week he reads off his own chart
To show what the log is for, he narrates one week from the chart on screen. He says price came back to the high that formed on the previous day and ran through it near the 9790 level, and notes that it did not continue through it 22:02 22:07. From there it sold down to the previous day’s low, breaching it by a pip or two, and then came back off into consolidation 22:21 22:26. The next session retraced into the range created by the following day’s high and low 22:31, and the session after that rolled the prior high, set a new high for the week 22:55 23:02 and ran the stops that had been resting above the earlier high 23:11.
Two qualifications belong with that passage. It is his reading of a single historical week on his own chart, spoken while he looks at it, and the transcript contains no chart data a reader can check independently, so the sequence cannot be verified from this source. And even within the narration, the level he identifies is used to describe what happened, not to assert what will happen next — which is consistent with his instruction to resist forecasting at this stage.
Analysis is not a commitment
The closing section is about keeping the written analysis separate from the trade. He says he wants students to document price action every single trading day and build understanding from it 23:23, and warns against marrying the ideas in an analysis, saying they should be reflected on rather than treated as the only acceptable read 24:03. His stated reason is practical: if real-time price action contradicts the underlying conditions a trader expects, a fixed analysis removes the flexibility to change direction or stand aside 24:22. He closes by saying direction is not knowable with great certainty — only probabilities are — and that the point of the exercise is to be able to find repeating occurrences in price action over and over 24:48 24:55.
ICT Mentorship Core Content – Month 1 – What To Focus On Right Now
The Inner Circle Trader · watch page lists upload 23 August 2022 · 1503 seconds, about 25 minutes 3 seconds. This is the recording every timestamp link on this page points at.
The recording is not embedded here. An embedded player was tested directly on 15 September 2026 from a BestProps page origin at desktop and mobile widths: the frame loads but then reports “Playback on other websites has been disabled by the video owner,” with no duration and no playback progress, while the video itself is publicly playable on YouTube. No half-working player is left on this page.
What this recording does not establish
This is a foundation lesson, and it is worth being precise about the limits of what it contains. It gives no entry, no stop, no target, no fill and no result, and it explicitly postpones forecasting. The description of price delivery being engineered for smart money, the characterization of indicators as the uninformed view, and the assertion that central banks set the price of their own currency are the speaker’s framework and market opinion; the recording provides no data that tests them, and the ninety percent figure is cited as a widely repeated statistic rather than sourced. The equal-high and equal-low discussion is qualified by him: he says reaching a level does not by itself decide whether price continues or reverses. The one historical week he narrates is read off his own chart, unverifiable from the transcript, and is an illustration of how to log levels rather than evidence of a method that works. Nothing here is a recommendation to take a position, and a log is an observation record, not a trading edge.
Further reading
The sources below were checked on 15 September 2026. The first is the primary source; the rest are official or regulatory references that bear on how a beginner should read the risk claims in a lesson like this one.
- [1] ICT, ICT Mentorship Core Content – Month 1 – What To Focus On Right Now — The Inner Circle Trader (watch page read 15 September 2026; upload date listed as 23 August 2022; listed duration 1503 seconds; publicly playable). The primary source for every claim in this article.
- [2] U.S. Commodity Futures Trading Commission, Fraud Advisory: Foreign Currency (Forex) Fraud (read 15 September 2026) — states that the forex market is volatile and carries substantial risks, that it is not the place for money you cannot afford to lose, and that you can lose most or all of it very quickly. Relevant because the assignment in this lesson is built on currency-pair charts.
- [3] U.S. Commodity Futures Trading Commission, Fraud Advisory: Commodity Trading Systems Sold on the Internet (read 15 September 2026) — describes how technical-analysis-based trading systems are marketed and warns that hypothetical trading results typically come from simulations over historical price data rather than executed trades. Relevant to reading any method presented without published results.
- [4] U.S. Securities and Exchange Commission, Investor.gov, Day Trading (read 15 September 2026) — describes day traders as rapidly buying, selling and short-selling throughout the day over very short holding periods and states that day trading is extremely risky and can result in substantial financial losses in a very short period of time. Relevant to the short-term and day-trading framing in this lesson.
A note on the transcription
The narrative above was written from a local automatic speech-recognition transcript of the full original audio, not from human-verified captions, and the review did not watch the recording. All 302 segments covering the full 25 minutes 3 seconds were read; the transcript reports complete audio and no low-confidence segments. Two consequences matter here. First, this lesson is delivered almost entirely while the presenter is looking at charts, and no chart was viewed, so nothing in this article describes plotted levels beyond the one price level he names in words. Second, numbers arrive without punctuation in places, so figures are reproduced in their conventional form rather than as the bare digits the transcript shows. The pair name is spoken plainly and is quoted directly. No entry, fill or outcome is reported anywhere in this article, because the recording contains none.
Source: ICT, ICT Mentorship Core Content – Month 1 – What To Focus On Right Now, The Inner Circle Trader, watch page upload date 23 August 2022; the recording presents itself as the third teaching of eight in the first month. Local automatic speech recognition of the full original audio was the transcript used and it is not human-verified captions. Every reported rule, figure and interpretation is attributed to the speaker; nothing here is a recommendation to take any position. This commentary is educational and is not investment advice.