
Key takeaways
ICT Mentorship Core Content Month 1 Liquidity Runs defines liquidity as buy and sell orders, especially protective stops expected above old highs and below old lows, then classifies paths toward them by intervening price structure.
Read the full summary
ICT Mentorship Core Content Month 1 Liquidity Runs defines liquidity as buy and sell orders, especially protective stops expected above old highs and below old lows, then classifies paths toward them by intervening price structure. High-resistance liquidity runs cross a thick band of peaks, troughs, old highs and old lows, leaving significant targets well defended, so ICT avoids these setups and says to trade them far less often unless volatility from events such as FOMC, non-farm payroll or a black swan cuts through the structure. Low-resistance liquidity runs follow sharp one-way displacement with little retracement and continue with minimal friction until price returns to the boundary defining the range. On the buy side, the range runs from a broken short-term high to a violated old low, with buy stops above successive short-term highs. On the sell side, it runs from a broken short-term high to the point where price breaks an old low, with sell stops below successive short-term lows and a primary focus on shorts. ICT calls one-way price action with little retracement the easiest part of trading at 15 minutes 43 seconds, while warning that probabilities fall sharply once price reaches the violated boundary and the path becomes high resistance again. The recording provides diagrams and a stated framework only, with no instruments, fills, prices, timeframes, performance data or tested evidence for its market-maker and institutional-order-flow claims.
How we researched this article
BestProps used document-based research from primary firm sources, checked September 25, 2026. The complete source list, scope, limitations, and commercial-state record appear near the end of this article.
In ICT Mentorship Core Content – Month 1: Liquidity Runs, ICT works through the vocabulary the rest of his material builds on. He opens with the ordinary definition of liquidity, replaces it with a trading-specific one, derives buy-side and sell-side liquidity from hypothetical positions and their protective stops, and finishes by classifying the approach to an old high or an old low as either high resistance or low resistance depending on how much price structure lies in the way.
Everything below is written from the recording’s own audio. The source used here is an automatic speech-to-text transcript of the full original audio rather than human-corrected captions, so the words were read, not the charts. The lesson rests on crude diagrams he shares on screen; they are described here only to the extent that he describes them out loud, and no level, instrument, price or timeframe is reproduced or inferred from them. This is his stated framework for reading price delivery, not evidence that orders reliably rest at particular levels or that either condition carries a dependable edge. He attributes the behaviour to market makers and institutional order flow; that attribution is his, and the recording does not test it.
How ICT Defines Liquidity
He opens with the standard description: liquidity is the degree to which a market, asset or security can be quickly bought or sold without affecting its price dramatically. He then sets that aside and says that as it relates to his concepts, liquidity simply means buy orders and sell orders, “it’s as simple as that” (0:29, 1:11). Time frame, he says, is irrelevant to the particular point he is making, and what he is after are reference points where there is a high probability of liquidity resting in the marketplace. That reframing changes how he reads a chart: at 2:58 he says the idea is not to hunt for specific patterns but to establish where existing orders will reside, and the target is therefore an area where the market has already shown a willingness to go higher or lower.
Why ICT Liquidity Sits Above Highs and Below Lows
He builds the idea from a hypothetical rather than from data. Suppose a swing high forms and the market then trades lower. Someone sold there, and while price fell that position was net positive or profitable. If those traders still hold as the market turns back around, their open profit erodes and at some point they are at a losing position. A bearish trader who was in profit on the way down must leave a protective stop somewhere, and in his account of it that stop rests right above the high, or, he says, many times just at that high (1:50). From that he derives the label: the market shows an interest in returning to where that large body of interest sits, and above the high he calls it buy liquidity. He states at 3:24 that he is looking at the situation from a smart-money or market-maker perspective, and that he knows there will be buy stops above that high.
The mirror image uses the same logic. When the market rallies away from a low, buyers who were net positive from that low see their open profit erode as price trades back down into the area their orders originated from, until they too are at a net loss. Watching the market move away from a low, he reads sell liquidity below it (3:38), and identifies both sides of the marketplace together as the foundation for a concept he calls open float, which he notes is not covered in this session.
He states the conclusion as a single fundamental: there will be liquidity above old highs and below old lows, and the market will eventually target those same levels (4:09, 4:17). Practically, that means moving price just above a previous high to knock out the buy stops resting there, and reaching below old lows to take out the sell stops. He restates it in its plainest form (if the market has moved from an old high there is liquidity resting above that high, and if it has moved from an old low there is resting liquidity below that low) and closes the thought at 5:31 with “It’s just that simple.”
High Resistance ICT Liquidity Runs
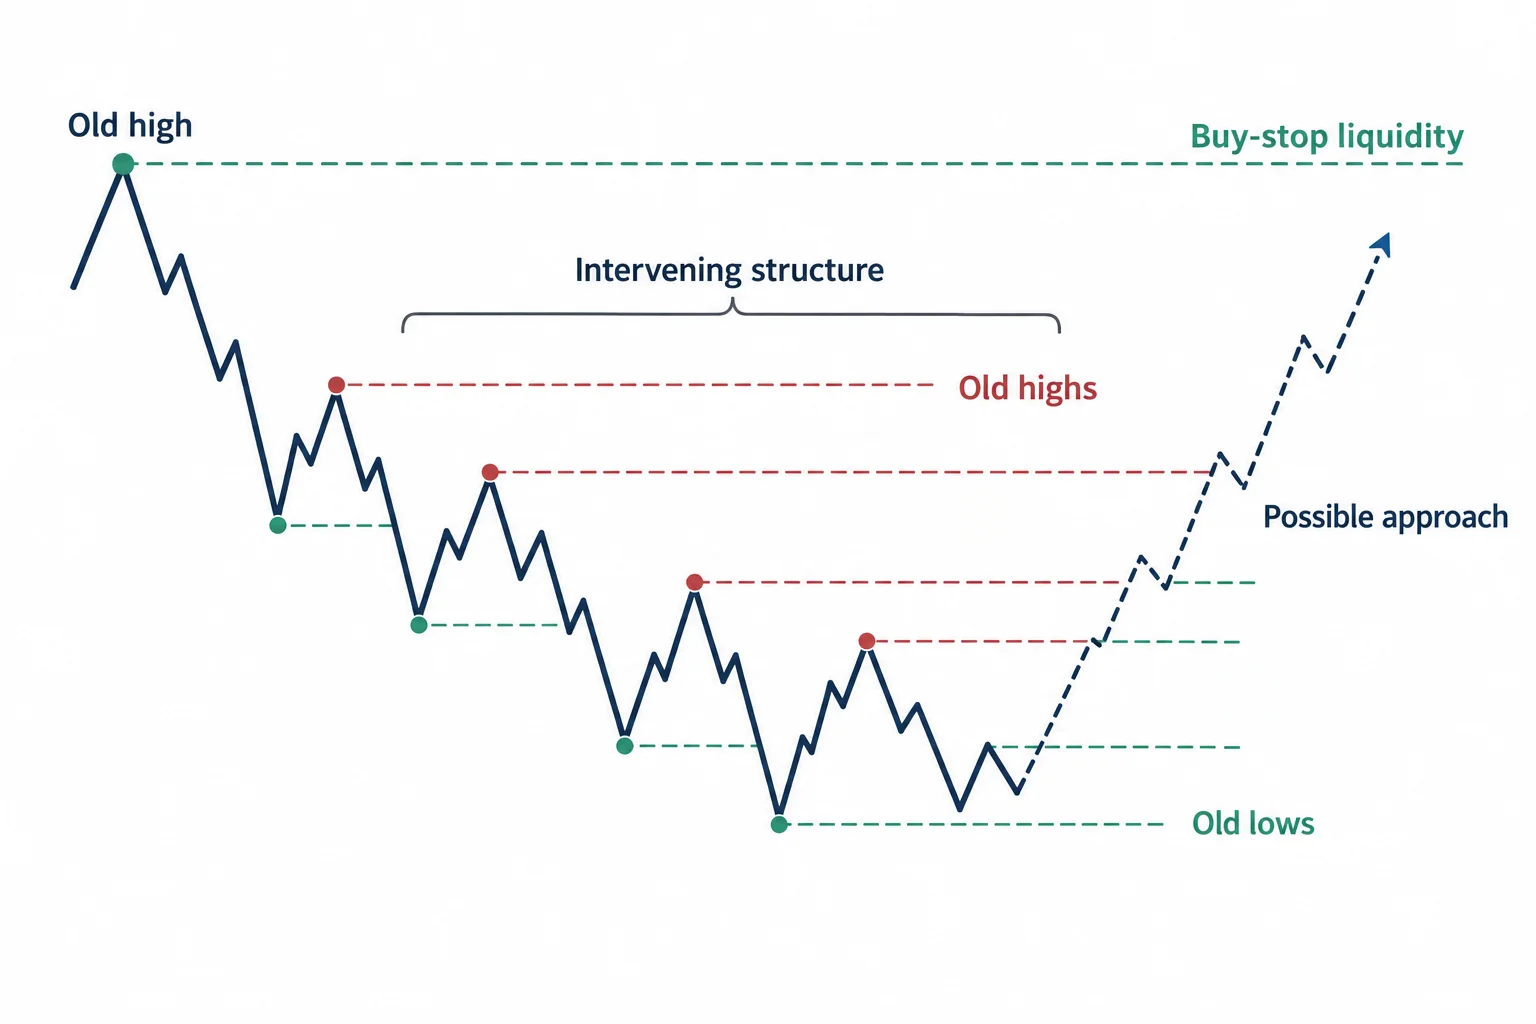
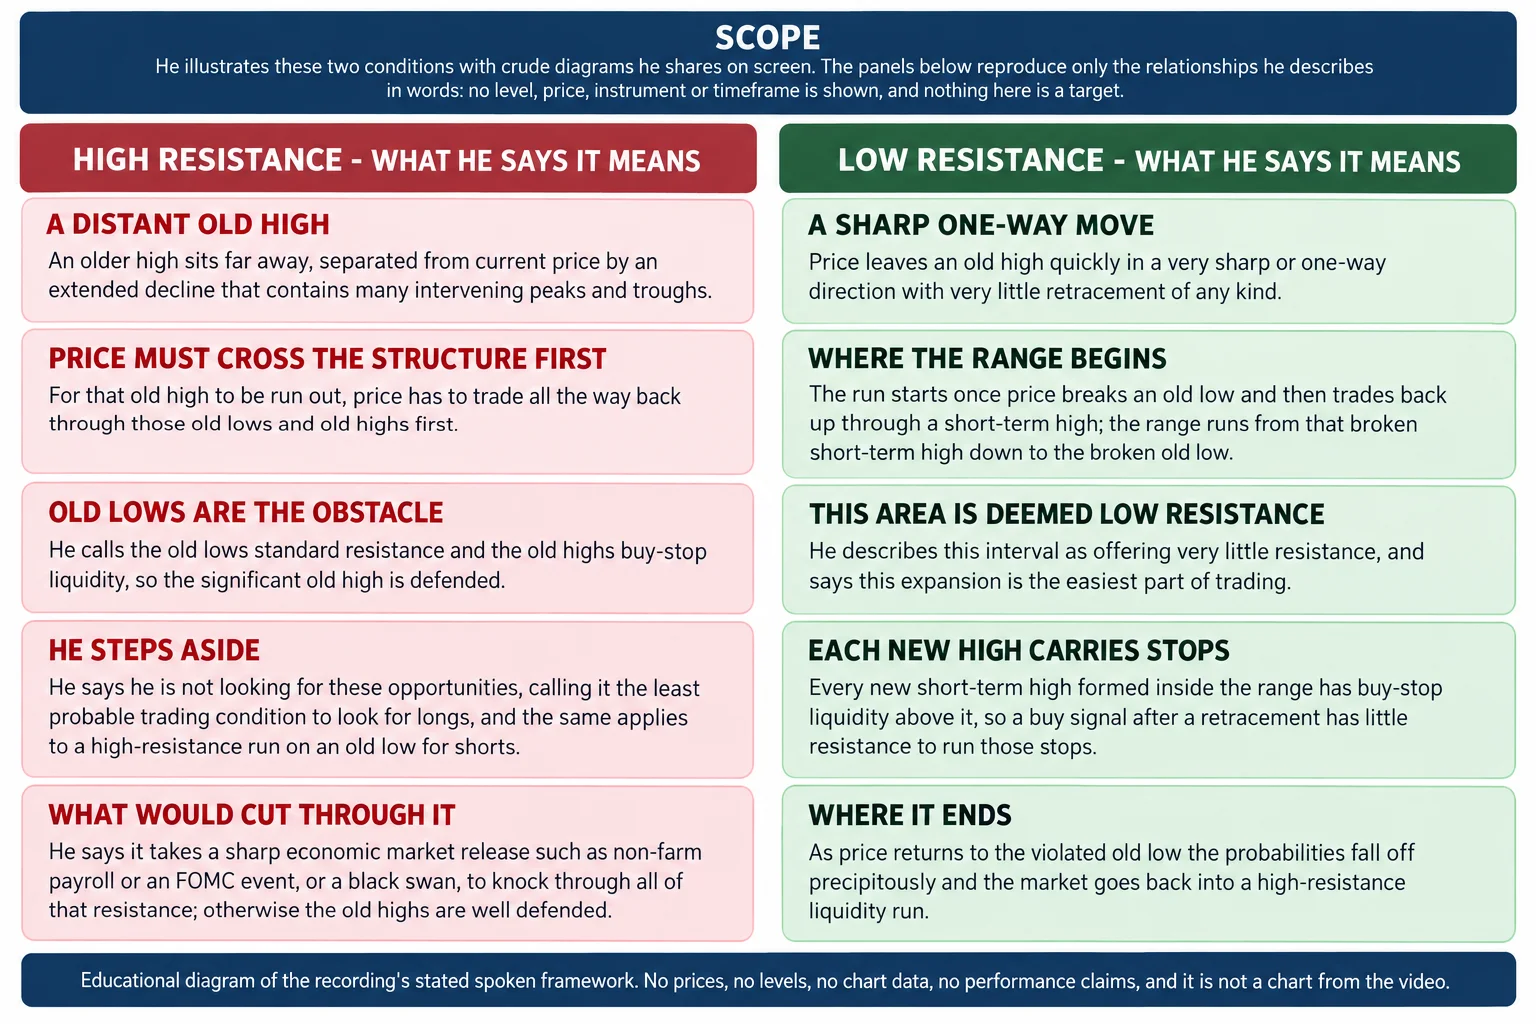
At 5:38 he introduces the complication: the market has a tendency to run out old highs and old lows, but has a very difficult time doing so under certain conditions. His example describes a move higher and then a decline containing, in his words, a lot of peaks and troughs. If a significant old high sits back at the origin of that decline, price has to travel from where it is now through that structure to reach it. On the way it meets resistance in the form of old lows and old highs; he calls the old lows standard resistance and the old highs buy-stop liquidity.
He is explicit that reaching the target is not the point. Even if the market does seek the liquidity above a given high, he asks how anyone knows it will stop there: it could reach one level higher, then the next buy-stop level above that. To run all of those stops, price first has to trade through the intervening old lows and highs. When he sees what he describes as a very thick area of resistance (a lot of price action the market would have to trade through to get back to an old high of significance) he classifies it as a high-resistance liquidity run (7:31).
His stated response is to stand aside. At 7:48 he says plainly, “When we trade, we are not looking for these opportunities,” and he calls it the least probable trading condition to look for longs, granting that there are ways to trade the profile in later teachings. His reasoning is the number of resistance levels and old highs that must be crossed before price reaches the significant old high, and that the market has been making lower lows and lower highs, which means traders holding stops above that old high are highly defended. What would cut through it, he says, is a sharp economic market release (he names non-farm payroll and FOMC as examples) which can knock through all of those levels of resistance and run out the liquidity. Absent that kind of influence or injection of volatility, old highs are in his words generally well defended (8:46). That is a conditional market interpretation, not a claim that any particular release will produce a liquidity run.
He then turns the same construction upside down. After the market makes a low of some kind, with sell stops or sell liquidity resting below it, an advance producing higher highs and higher lows means price cannot reasonably be expected to drop straight to that low without first meeting all of those intervening highs and lows (8:57). He applies the same verdict on the sell side: it is very difficult for price to reach down through all of that price action, and the more time the market spends in the area, the less likely it is to travel all the way to the old low, even where significant liquidity may rest below it. He repeats the exception, naming an FOMC announcement, non-farm payroll or an unexpected black-swan event as the only kind of thing that cuts through the structure to reach the sell side. His instruction is that for shorts they avoid these occurrences, and at 10:53 that this is the element of price action to trade far less frequently.
Low Resistance ICT Liquidity Runs
At 11:04 he introduces the contrast as the situation where the market offers an opportunity to act with very little resistance, and he names it a low-resistance liquidity run. He acknowledges that the diagrams he shares are crude and elementary, and says the concept is easy to see in real price action.
The shape he describes starts with speed. Price comes off an old high and falls quickly in a very sharp, one-way direction with very little retracement of any kind. Once the market breaks below an old low, the run that matters begins only when price turns and breaks back up through a short-term high; the affected range is defined from that broken short-term high down to the level of the broken old low (12:07). What makes it low resistance is the absence of anything for price to work through, and he attaches stop logic to every swing inside the range: each new short-term high has buy-stop liquidity above it, so a buy signal after a retracement meets very little resistance on the way up to those stops. At 14:01 he describes this interval as the easiest part of trading when you can trade inside that range.
The boundary is what stops the classification. As price works back toward the violated old low, he says the market starts encountering high-resistance liquidity runs, and the probabilities fall off precipitously once price returns to the area that defined the low-resistance range. Anything beyond that price point becomes a high-resistance liquidity run again (13:28). He also notes a structural asymmetry inside the range at 14:10: every time a new short-term high forms, a buy signal has very little resistance to get through the old high it retraced from, and you keep looking for those until the break on the old low is filled in.
ICT Liquidity Runs on the Sell Side
At 14:50 he says everything he teaches one-sided is easily communicated by reversing it, and he presents the sell-side low-resistance liquidity run. The construction: a consolidation, then an expansion that breaks above a short-term high, which makes market structure bullish at that moment; price runs up quickly, creates a high and starts to break down; and once it trades below an old low, he says the market will have a very easy time trading back down to the point at which that short-term high was broken.
That point marks the start of the range. At 15:43 he says one-way price action with very little retracement is the easiest time to trade, that the run is defined by the short-term high broken on the upside, and that the focus is primarily on selling short. Every retracement, in his description, finds very little resistance going lower to run out the previous low, because sell stops rest below those lows.
He then describes the mechanics of the retracement itself: price breaks below a short-term low, expands, and makes a small retracement, and below that short-term low he says bottom-chasers who want to be long are forming the liquidity he is targeting. Because the move up was sudden with very little retracement, there is correspondingly little resistance on the way back down to the point where market structure broke. His summary is that between the level where the short-term high broke and the level where price broke the old low, this is the easiest area to trade, because little resistance allows price to cut through all of it. He closes the segment by restating the trigger: you wait for a short-term low to form, and every time one forms there will be sell-stop liquidity resting below it (16:53).
ICT Liquidity Run Examples With Opposite Resistance Conditions
From 17:03 he moves to further examples and asks what makes the two types of run different. The first walkthrough starts with an old high, then a decline that violates old lows, then a rally that runs with very little resistance before the market eventually turns lower and takes out the liquidity below those lows; he calls that run from the high down through the lows a low-resistance liquidity run (17:44).
What follows is the part that makes the classification relative rather than absolute. Because a longer-term high sits to the left, and because the market had already shown a willingness to take out a low and then rallied back to clear a stop before failing to get above a particular up candle, he describes institutional order flow turning bearish again and expanding to the downside. The rally that fails to get above the swing high is then classified as a high-resistance liquidity run, and he gives the reason: a longer-term high and an intermediate-term high have already been priced in, so this high will struggle to be run out (18:44). For a buyer at that rally there is, in his words, a high probability that the high is not going to be run out and that it will stay intact and defended, along with the higher high above it.
The reversal of that same pattern is where the low-resistance run appears. With the old high left in place, every low that forms meets very little resistance, and at 19:33 he says price goes through those lows like a hot knife through butter (equal lows traded through, short-term lows traded through), so the bias is bearish and the focus is on rallies that take out short-term or intermediate-term lows.
The important nuance comes at 20:06. Every rally is viewed as a high-resistance liquidity run that will have a difficult time getting above the previous highs (he concedes it sometimes happens, but says generally it does not), and because that difficulty is built into the price action, the same condition turns into a low-resistance liquidity run for the move below the short-term lows. That is his core point: the two labels describe opposite sides of one structure rather than two unrelated setups. He extends the reading to individual levels, looking for old lows to the left once he has identified whether the market is in a high-resistance or low-resistance condition, and observing liquidity resting below successive lows being run through with only a small retracement in between.
He then runs the bullish version at 21:19. When the market finds a low, builds a smaller consolidation and makes it a long-term low, then rallies, retraces into consolidation and rallies through again, he says that old low will be well defended. The consequence is symmetrical to the bearish case: every retracement lower is, in his terms, a high-resistance liquidity run against the old lows, with stiff resistance to violating them and buying coming in, while every short-term high has an easy run through it, which is the low-resistance liquidity run, with resistance weak and support strong because the market is capitalising only on the buy side.
He then describes how that reads forward: in a bullish condition every retracement sets up another leg to take out the short-term or immediate-term highs above the market, because buy stops rest above them, and he summarises the intent as buying low and selling to willing buyers above the current market action, which he attributes to market makers (22:55). His closing sequence repeats the pattern: the market trades down, makes a small retracement, and the old high above is run out as a low-resistance liquidity run; another retracement, and the next old high is run out the same way.
The closing idea is about defence rather than prediction. He says he looks for clean highs where the levels are too clean, and that at some point it becomes crystal clear that the more price action surrounds a specific high or low, the more that level is being defended on what he calls an institutional price model (24:23). From there he draws the practical conclusion: the easier trading, in his description, is away from those defended levels, and trading that way puts a trader in sync with institutional order flow, so that trades find very low resistance in the form of profitable exits and very little drawdown (24:36). The drawdown and exit comments are his expectation about trading in that alignment, not a measured result.
How to Study ICT Liquidity Runs
Reviewed against the recording, the lesson reduces to a sequence of questions a student can ask of any chart, in the order he presents them:
- Which old highs and old lows are visible, and has the market moved away from them? He treats the area above an old high as buy-side liquidity and the area below an old low as sell-side liquidity (2:09, 3:38).
- Is the path to the proposed target crowded? A thick band of intervening peaks and troughs is what makes a run high resistance and, in his words, the least probable condition for longs (7:31, 7:52).
- Or is it a sharp, one-way displacement with very little retracement, defined after a break below an old low and a break back through a short-term high, where each new swing carries stops and price meets little resistance (12:23)?
- Where does the low-resistance range end? In his framework it ends when price returns to the violated old low, at which point the probabilities fall off and the condition becomes high resistance again (14:27).
He frames the distinction as more specific than assuming every old high or old low must eventually be reached, and the recording is consistent with that: the classification is about the structure between current price and the objective, not about whether the objective exists. He also states that the concept is universal rather than specific to a t