
Key takeaways
ICT Mentorship Core Content Month 1 Impulse Price Swings and Market Protraction is a 733-second Inner Circle Trader recording that defines an impulse price swing as any directional leg between a high and low and market protraction as a small impulse swing tied to a specific time of day.
Read the full summary
ICT Mentorship Core Content Month 1 Impulse Price Swings and Market Protraction is a 733-second Inner Circle Trader recording that defines an impulse price swing as any directional leg between a high and low and market protraction as a small impulse swing tied to a specific time of day. The operative rule is counter-directional, so a timed move higher suggests looking lower and a timed move lower suggests looking higher, with the initial move characterized as manipulation, a Judas swing, or a liquidity run. The walkthrough first identifies zero GMT, London after four GMT, and New York after seven in the morning as recurring windows, while the closing summary instead lists after midnight New York, after seven in the morning New York, and eight in the evening New York, making the windows platform-relative and internally inconsistent. Examples combine timed swings with measured impulse legs, equilibrium, a 62% premium retracement, old lows, equal lows, stop liquidity, and subsequent expansion. The framework provides no minimum move, confirmation step, invalidation level, statistics, sample size, risk model, fills, results, or performance evidence, and its manipulation claims are interpretations rather than measured findings.
How we researched this article
BestProps used document-based research from primary firm sources, checked September 25, 2026. The complete source list, scope, limitations, and commercial-state record appear near the end of this article.
In ICT Mentorship Core Content – Month 1 – Impulse Price Swings & Market Protraction, the speaker opens by saying he will look at impulse price swings and market protraction, and immediately frames them as very similar ideas that are uniquely different 0:35, 0:47. He takes the two separately, starting with the plain swing and then adding time of day to it.
Everything in the lesson is spoken description of charts that were being drawn on screen. This article is built from an automatic speech-recognition pass over the audio, and the reviewer did not view the video, so no chart level, instrument or fill is asserted here beyond what the speaker says aloud.
ICT Impulse Price Swing Meaning
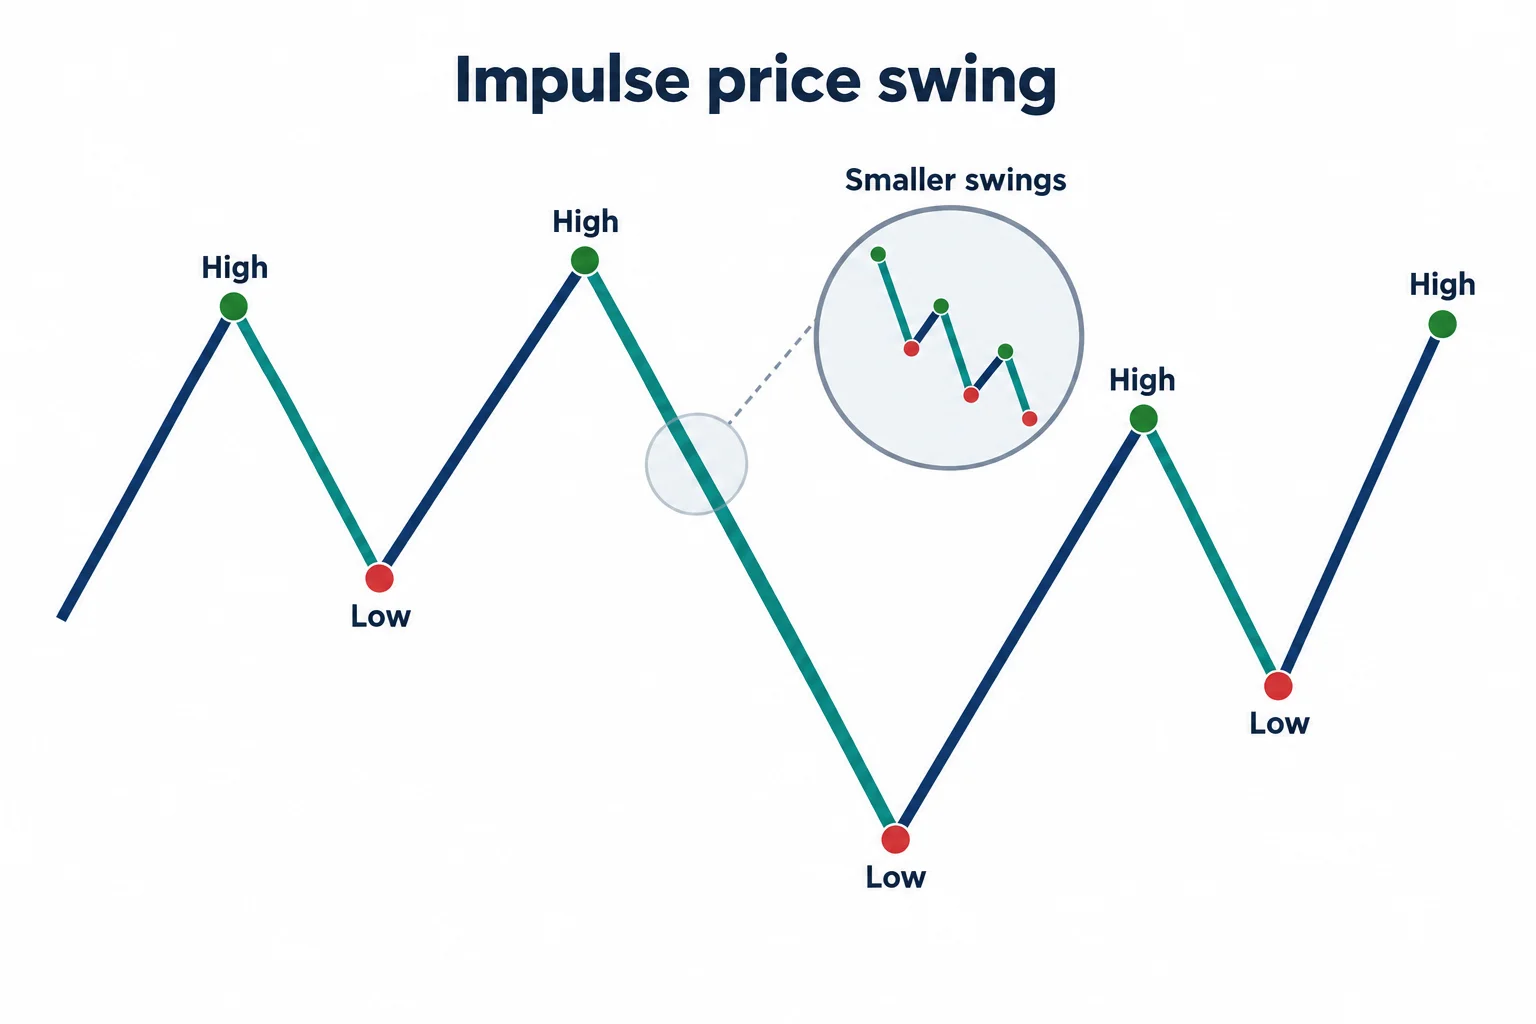
He begins with the simplest version. An impulse price swing, he says, would be something like this. He then walks through a chart leg by leg: a swing down, another swing higher, another lower, another higher, another lower, another higher, and then further swings lower and higher in the same alternating pattern 0:55, 1:04, 1:14, 1:19. His summary of that shape is a sequence of movements from a high down to a low, up to another high, down to another low, and so on 1:38, 1:43.
His instruction from that is about attention rather than a signal. He says that when looking at price action you need to be thinking in terms of impulse price swings, because the detail lives inside them 1:52, 1:58. He then adds that there are smaller and more specific impulse swings that carry considerably more influence over the marketplace, and he files those under a manipulative move or market-making manipulation 2:03, 2:12.
That last step is an interpretation, not a measurement. The swinging structure is visible on any chart; the claim that particular small swings are engineered is his reading of who is on the other side of them.
How Market Protraction Differs From a Price Swing
He then clears the chart and focuses on protraction 2:22. The setup he uses is the same impulse swing idea, with one addition: time of day 2:28, 2:36. He demonstrates the tool he uses for it, saying that holding control and tapping Y adds vertical delineations for zero GMT so one day divider can be compared with the next 2:41, 2:49.
With those dividers on the chart he gives his definition: what he calls time-sensitive impulse price swings are market protraction, and market protraction is an impulse price swing that is highly sensitive to a time of day 3:00, 3:13, 3:16. He then states that there are three primary protractionary market moves every 24 hours 3:21.
ICT Market Protraction Reference Windows
The first one he names is zero GMT. He says he sees one small movement away from that delineation, up or down, and walks through several instances where price trades down away from it and then moves higher, and others where it trades higher 3:28, 3:40, 3:48, 3:52. He closes that section by saying he does not believe that session is that influential initially, and that it is all he is going to look at for it 3:55, 3:59.
The second protractionary state he names is in London 4:05. He turns the control-Y feature off and works instead from vertical lines marking midnight New York 4:13. In that example he points out a market move higher immediately after midnight New York and calls it a protractionary market phase where the market trades up initially at a specific time of day 4:23, 4:27. He says the design of that swing is to fake out the people who chase the initial move after midnight 4:37.
The third reference is the New York session. He says the second impulsive price swing starts in New York, delineates seven o’clock in the morning, and states the expectation he draws from it: if the market has moved lower in London, he is looking for a retracement higher 4:46, 4:50. He calls that impulsive move higher market protraction and says it is designed and intended for manipulation only, to get traders to think the market is making a low, before it reverses and trades down 5:00, 5:05, 5:09, 5:14.
He gives a second New York instance in the same opening hour: a small retracement during the New York session opening after the seven o’clock hour, immediately before the market trades lower, and then a further small impulse swing higher at seven that he again labels protraction 5:22, 5:32, 5:40, 5:48.
The three reference points are not listed identically at both ends of the recording. In the early walkthrough he names zero GMT, London, and the New York window after seven in the morning. In his closing summary he describes the time element as applying after midnight New York, after seven in the morning New York, and at eight in the evening New York 11:33, 11:43. Both lists are reported here as he states them. He also notes that his London reference is read after four GMT on a demo account he names, which ties the London window to the platform time zone rather than to any exchange session definition 6:32, 6:40.
ICT Market Protraction Counter-Directional Rule
This is the operative part of the lesson, and he states it as an inversion. The market protraction he describes is counter-direction: if the move occurs at that time of day and goes higher, he thinks the opposite direction, and if it goes lower, he thinks the opposite direction 5:48, 5:56, 5:59, 6:05. In his worked case the market has been moving lower, so an initial rally is what he treats as manipulation or protraction, with the market seeking to draw in participants on the wrong side or reach for liquidity 6:08, 6:10, 6:14, 6:18.
He repeats the timing condition three times in a row for emphasis, saying it has to happen after seven o’clock in the morning 6:20, 6:23, 6:26. He then gives the London version: after four GMT, a movement higher while he is bearish is read as market protraction or what he calls a Judas swing, a false rally to sell into 6:28, 6:40, 6:43, 6:46. The same thing, he says, occurs after the New York seven o’clock time, where he expects the market to rally up off the London high into a protractionary state that reaches for liquidity and then expands down 6:50, 6:53, 6:56, 7:05.
One terminology note for reading the automatic transcript: the false initial move he names renders in the speech recognition output as “Judah swing” in both places it appears 6:43, 10:56. The term is used here as Judas swing, which is the form the surrounding context supports, with the rendering flagged rather than silently replaced.
ICT Impulse Swing and Market Protraction Examples
He runs through several days. In the first, the market drops initially from the midnight candle, then rallies, which he calls market protraction that sought liquidity below the market and cleared out lows before rallying 7:12, 7:19, 7:28. He points out one more small rally and then a sell-off. On the next day, in London, he describes an initial rally after the midnight candle followed by a move lower, and then one further protractionary state right after the New York seven o’clock hour 7:36, 7:45, 7:52. He describes that one as a small minor impulse swing whose design is to manipulate the sentiment or the thoughts of traders who want to be participants, saying it would look like a low and entice buyers in the New York session before being reversed 7:56, 8:04, 8:11.
ICT Market Protraction Timing Through the Month
With the timing idea established, he deliberately connects it to the material he says he shared earlier that month 8:17. He identifies a market move down as an impulse swing and measures that swing 8:35, 8:45. From that high down to that low, he says, price retraces back up above equilibrium, which puts it in what he calls a premium market at the 62% retracement level, with a move expected to run below the low 8:59, 9:03, 9:08, 9:13.
The sequence he then describes is: the market goes into the protractionary phase after the impulse swing, and he can be a seller reaching for liquidity below the lows, having found an old low in previous days as an additional reference, with the market trading down into that level 9:18, 9:22, 9:24, 9:28, 9:30, 9:32.
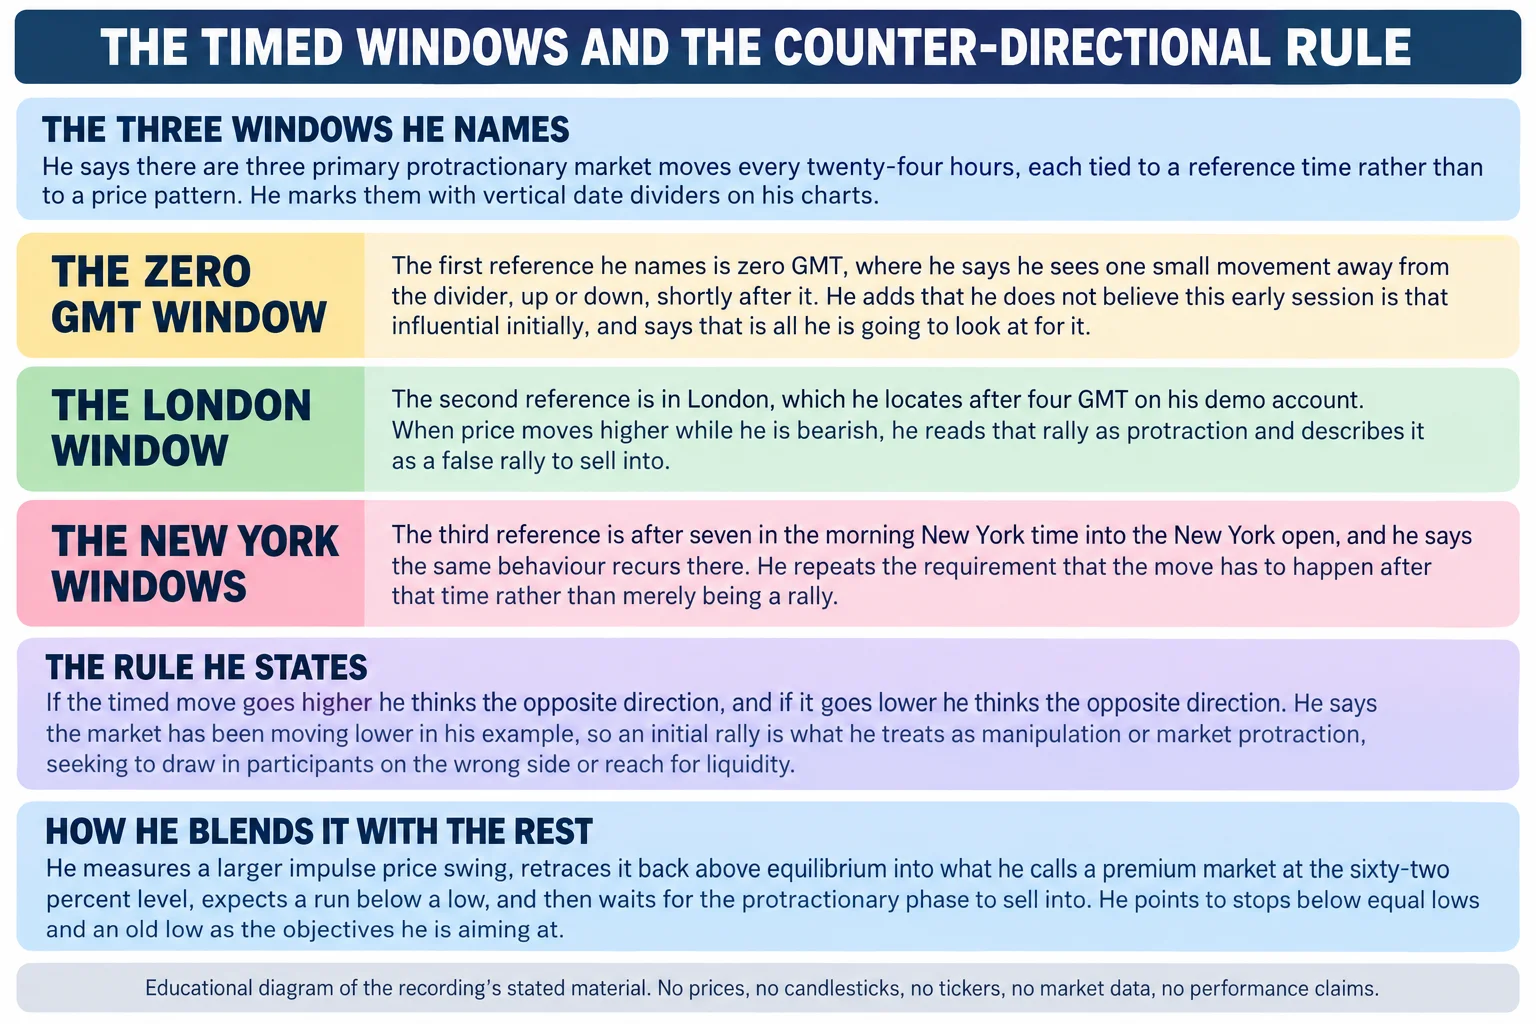
He then repeats the whole analytical sequence on a fresh example. The market makes another impulse swing, rallies with another move higher in the next London session into a Judas swing lower or protractionary phase, which he says fakes traders out into thinking price will drop initially while it actually rallies up into a premium market 9:42, 9:50, 10:00, 10:07. From there he describes a retrade back into equilibrium for market protraction and then an expansion lower that takes out stops below the lows and aims for the stops below equal lows that he says accumulated there 10:10, 10:17, 10:21, 10:27.
In his final example he narrates another impulse swing down to a low, then an impulse swing up at the New York midnight candle which he calls a Judas swing higher and a fake move higher, followed by a move down 10:35,. Going into New York he identifies another protractionary market phase trading up into an area where price had sold off before, and then a lower expansion. He asks aloud why price would reach down there and why it moved so fast to that level, and answers his own question by pointing to the old low 10:56, 11:08, 11:13, 11:18. The specific level he reads out in that passage is left out of this article: the instrument, contract and date of the chart are not established from the spoken material, so the figure cannot be attributed to a verified market.
ICT Price Swings and Market Protraction Compared
He closes by stating the difference plainly: the distinction between determining impulse price swings and market protraction is the fact that a time element is applied to the small impulse swing, after midnight New York time, after seven in the morning New York time, and at eight in the evening New York time 11:25, 11:33, 11:43. He says a protractionary market phase usually enters at those times as a small impulse price swing that runs counter to the major direction you are going to see after that specific time of day 11:52, 11:57. His stated use for it is session trading and session drills, to help give context in practice and to build anticipatory price skills 12:01, 12:10.
How to Interpret ICT Price Swings Carefully
- The windows are his, and they are platform-relative. He reads the London reference after four GMT on a named demo account and demonstrates the dividers with a charting shortcut, so the windows belong to his own session definition rather than to an agreed exchange calendar 6:40. His own lists of the three reference points differ between the opening walkthrough and the closing summary, and both are reported above.
- The rule is stated without a filter. His formulation is that a timed move higher or lower means the opposite direction, with no stated minimum size, no confirmation step and no invalidation level, beyond the requirement that the move occur after the reference time 5:59.
- “Manipulation” is his interpretation. The measurable features are time, swing direction, equilibrium, retracement depth and prior highs or lows. The claim that an initial move was engineered to mislead participants is his explanation of why the move happened, and the recording offers no data separating it from an ordinary counter-trend retracement.
- The chart levels are speech. The transcript is an automatic recognition pass, and this review did not view the video. The 62% retracement he describes and the old lows he names are his spoken annotation of an unseen chart. One stated level in the final example has been omitted because the instrument behind it cannot be established 11:08.
- There is no performance evidence here. The lesson contains no statistics, no sample size, no risk model, no fills and no results. It is a vocabulary and annotation framework, and nothing in it is investment advice or a claim of profitability.
Watch the ICT Market Protraction Recording
ICT Mentorship Core Content – Month 1 – Impulse Price Swings & Market Protraction
The Inner Circle Trader · watch page lists upload 26 August 2022 · 733 seconds, about 12 minutes 13 seconds. The recording is the primary source for every timestamp link on this page.
The recording is not embedded here. An embedded player was tested directly on 15 September 2026 from a BestProps page origin at desktop and mobile widths: the frame loads and the player reports “Playback on other websites has been disabled by the video owner”, with no duration and no playback progress, while the video itself is publicly playable on YouTube. The oEmbed endpoint answers 401 Unauthorized for this video for the same reason. No half-working player is left on this page.
The watch page was read on 15 September 2026 and is publicly listed as ICT Mentorship Core Content – Month 1 – Impulse Price Swings & Market Protraction by The Inner Circle Trader, not private and not unlisted, with an upload timestamp of 26 August 2022 and a listed duration of 733 seconds.
ICT Price Swing Transcription Notes
The transcript behind this article is an automatic speech-recognition pass over the full original audio of this recording, not human-verified captions and not a caption track, and this review did not view the charts. Its cached quality record reports the audio complete at a maximum level of −.1 dB, with 397 low-confidence characters concentrated in six consecutive segments that sit inside the early walkthrough of the swing sequence, roughly between 1:25 and 1:52 1:25, 1:50. Those segments are a repetitive list of swing directions rather than a numeric claim, so nothing is drawn from them beyond the alternating pattern. Two further renderings in the recording need care and are flagged rather than corrected silently: the false initial move appears as “Judah swing” where the context supports Judas swing, and the London reference is tied to his demo account’s clock rather than an exchange session. Nothing on this page comes from anywhere other than the spoken content of this recording.
ICT Market Protraction Resources
These are the sources checked while preparing this article. The CFTC and Investor.gov pages are general regulator material about how trading-system and technical-analysis claims should be assessed; neither evaluates this speaker, tests whether the timed windows he names behave as he describes, or endorses anything said in it. Any ICT, smart-money or third-party indicator, script, note set, chart annotation, transcript pack or re-upload circulating outside the publishing channel’s own page is unofficial, has not been tested here, and no claims are made about its accuracy or repainting behaviour.
- [1] ICT Mentorship Core Content – Month 1 – Impulse Price Swings & Market Protraction The Inner Circle Trader (primary source; watch page read 15 September 2026, listed duration 733 seconds, about 12 minutes 13 seconds).
- [2] The Inner Circle Trader (official YouTube channel) (read 15 September 2026), the publishing channel for the mentorship series used here.
- [3] CFTC (Fraud Advisory: Commodity Trading Systems Sold on the Internet) (read 15 September 2026), states that technical analysis attempts to predict future price movements based on historical prices, price relationships and price trends, and warns that hypothetical trading results are typically based on simulations using historical price data.
- [4] Investor.gov (U.S. SEC), Glossary: Technical Analysis (read 15 September 2026), the SEC’s investor-education glossary entry for the category of chart-based analysis this lesson belongs to.
Source: ICT, ICT Mentorship Core Content – Month 1 – Impulse Price Swings & Market Protraction, The Inner Circle Trader, watch page upload date 26 August 2022. Local automatic speech recognition of the full original audio