
Key takeaways
In ICT Mentorship Core Content – Month 1 – Fair Valuation, the speaker presents fair valuation in two forms: equilibrium, the equal-distance point between a chosen high and low, and valuation from the market maker’s perspective (0:54, 0:59, 1:05).
Read the full summary
In ICT Mentorship Core Content – Month 1 – Fair Valuation, the speaker presents fair valuation in two forms: equilibrium, the equal-distance point between a chosen high and low, and valuation from the market maker’s perspective (0:54, 0:59, 1:05). He says a buyer wants a discount, meaning the lower third of the current range, and that sells are best taken in the upper third, which he calls premium (2:13). He is explicit that the 50% midpoint alone does not establish direction, so he adds structure: the most recent meaningful swing break, displacement, consolidation, a bullish order block, and old highs or an overhead gap as possible objectives (6:10, 9:03). Inside a fast one-directional move he calls a liquidity void, he marks a narrower candle-to-candle interval as a fair value gap, and he says a revisit need not be immediate (3:14, 4:08). He narrates this on a September 2016 Australian dollar chart and reports that a 76.65 weekly objective he had called was hit; that is his own reported outcome on his own chart, which is not present in the audio source and is not verifiable here (1:34, 1:41, 1:48).
How we researched this article
BestProps used document-based research from primary firm sources, checked September 25, 2026. The complete source list, scope, limitations, and commercial-state record appear near the end of this article.
In ICT Mentorship Core Content – Month 1 – Fair Valuation, ICT presents “fair valuation” as two related ways of organizing price action. The first is equilibrium: the midpoint between a defined swing high and swing low. The second concerns price areas that ICT interprets as favorable for large participants to accumulate or liquidate positions.
He introduces the session as the sixth of the eight teachings in the September 2016 mentorship (0:39). This is a summary of ICT’s framework, not independent proof of how banks or market makers trade. The lesson uses an Australian dollar chart the speaker dates to the week of 24 September 2016, although the YouTube upload is dated 25 August 2022. Because the chart itself is not present in the audio source, the discussion below avoids inferring unseen prices, fills or later results beyond the outcomes he states himself.
Two Meanings of ICT Fair Valuation
ICT introduces the two perspectives at 0:54:
- Equilibrium: the equal-distance point between a selected high and low, represented by the 50% level of that range.
- Participant-relative valuation: an area ICT characterizes as favorable for accumulating, distributing or covering positions, depending on whether price is at a discount or premium.
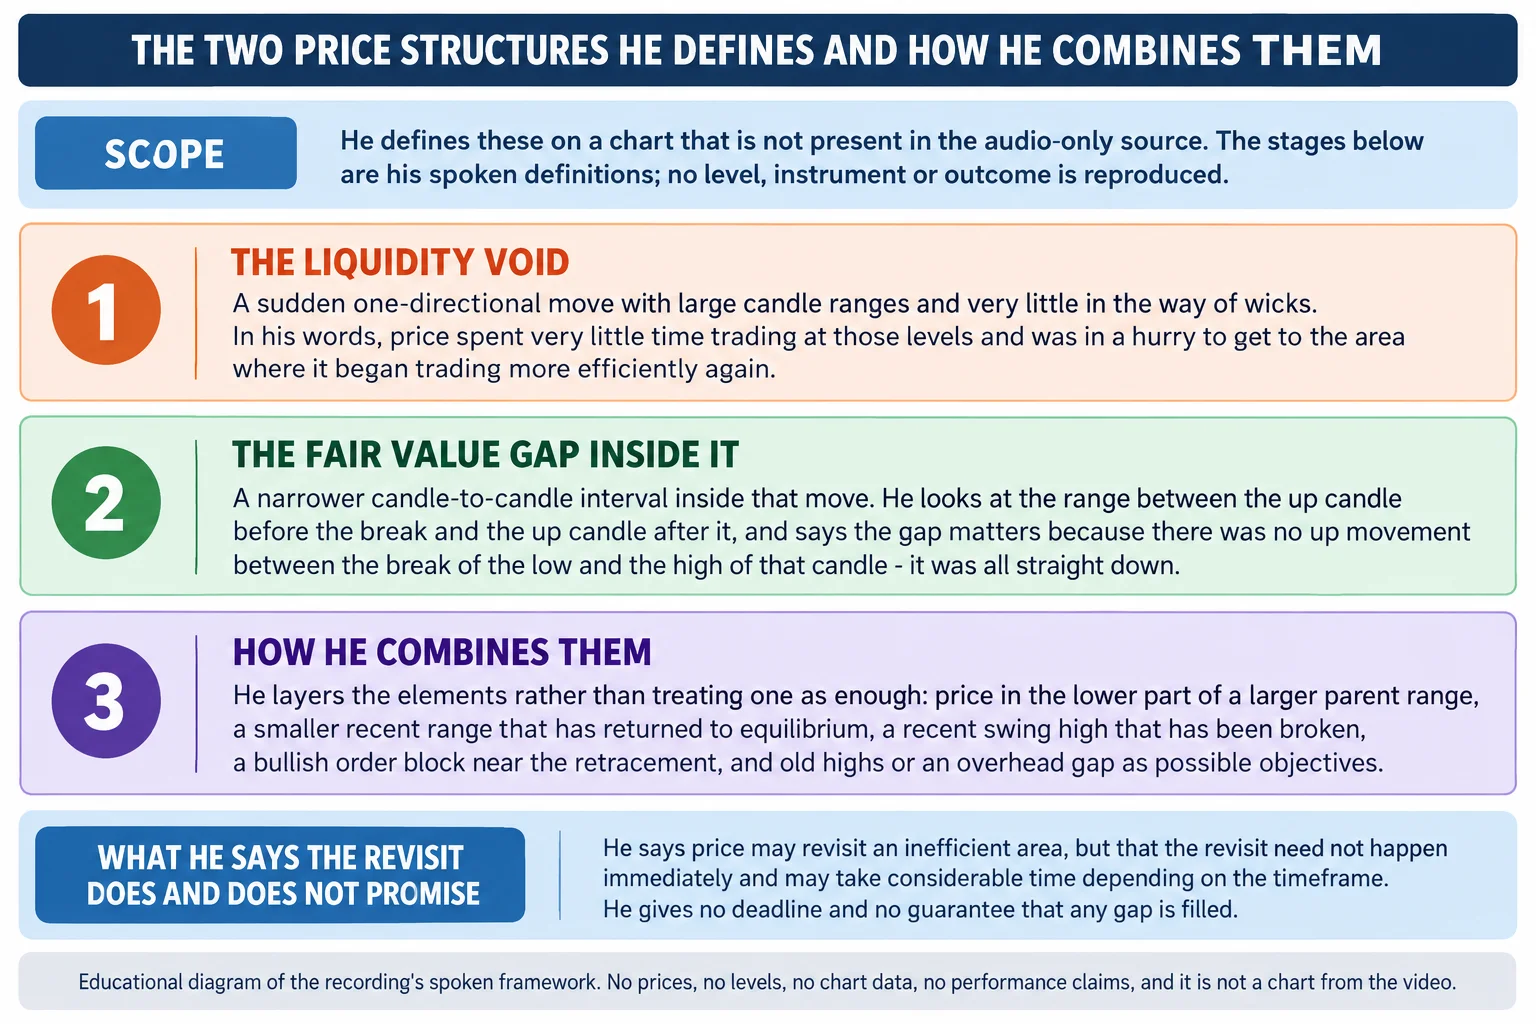
The selected range matters. At 2:10, ICT says buyers should generally focus on the lower portion of the current impulse range, while sellers should focus on its upper portion. He calls the lower region a discount and the upper region a premium. He ties that to the most recent impulse leg: the discount he points to is the lower third of the range created by that impulse price swing, and the upper third of the same range is what he calls the premium market.Equilibrium separates the two sides.
ICT Fair Valuation and Equilibrium Signals
At 6:10, ICT defines equilibrium as 50% of a chosen high-to-low range. Price near that midpoint can move in either direction, so the midpoint alone does not establish bias.
To add context, ICT asks which meaningful swing was broken most recently. In his example, he identifies a break above a short-term high followed by a return toward equilibrium. He interprets that sequence as favoring higher prices because it combines a bullish structure break with a return to the range midpoint. This is ICT’s reading of the example rather than a universally established rule.
The lesson also stresses that analysts can draw nested ranges. A large “parent” swing may place price in a broad discount while a smaller, more recent range places it near equilibrium. The intended analysis therefore combines location across multiple ranges rather than relying mechanically on one Fibonacci measurement.
ICT Fair Value Gaps and Liquidity Voids
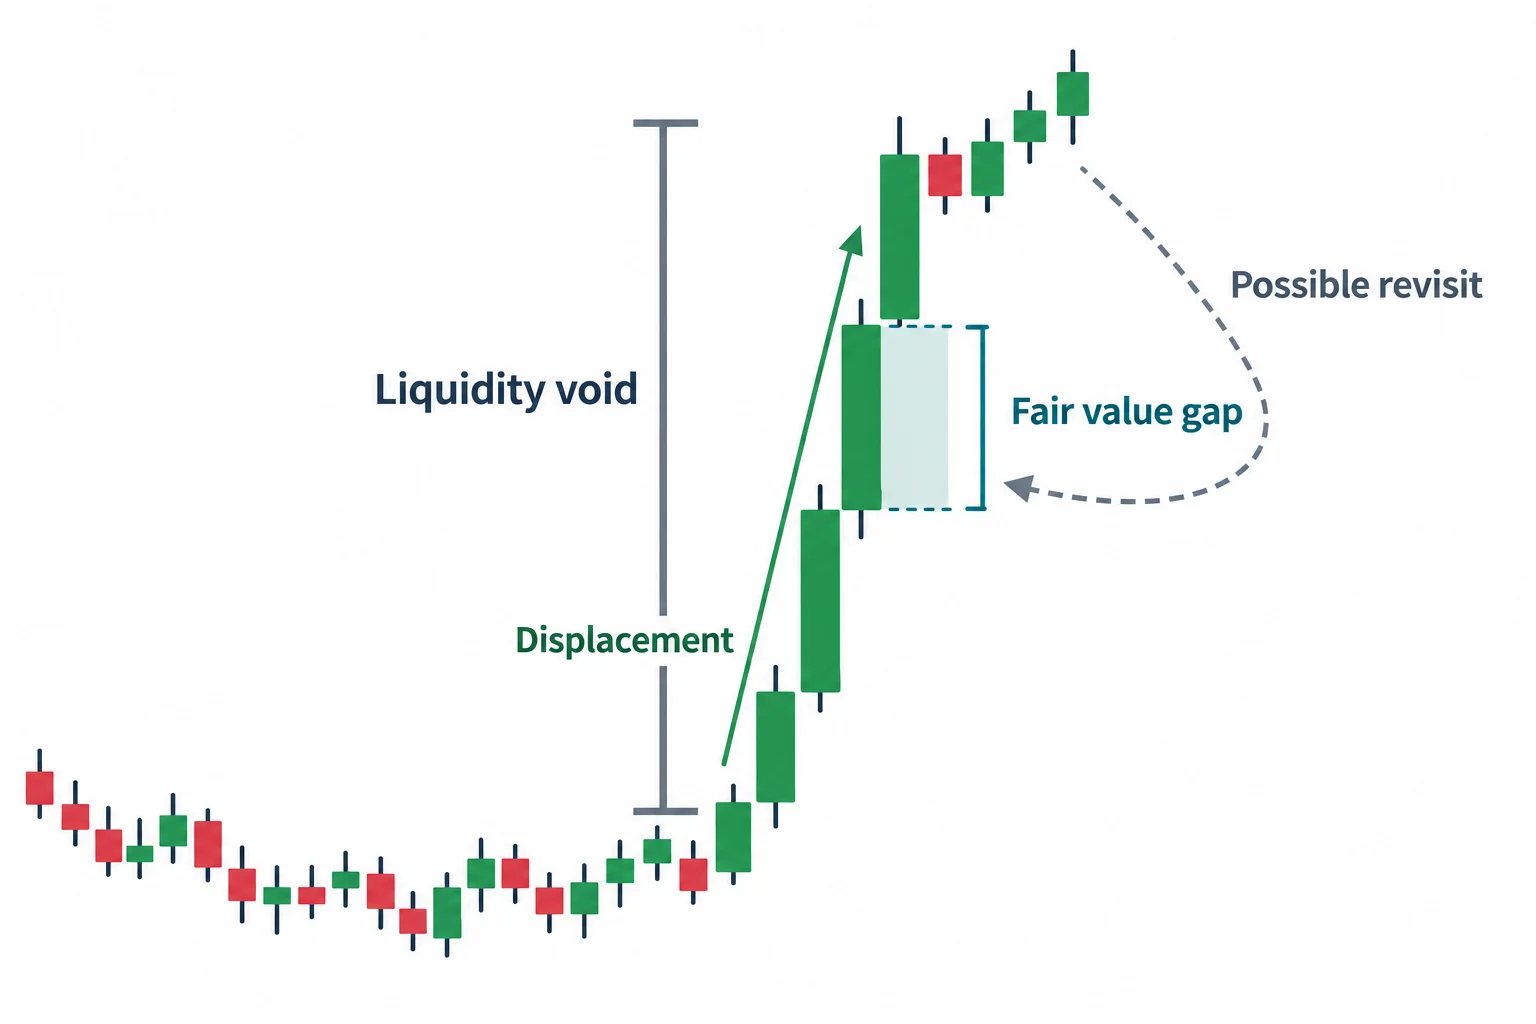
ICT turns to rapid, one-directional movement at 3:06. He calls a fast move containing large candle ranges and limited wicks a liquidity void. His interpretation is that price spent little time trading through those levels.
Within that movement, he identifies a narrower candle-to-candle area as a fair value gap. At 4:07, he describes an interval surrounded by candles on either side but traversed only in one direction during the displacement. He treats that interval as an inefficiency that price may revisit.
ICT explicitly notes that such a revisit need not happen immediately and may take considerable time, depending on the timeframe. His broader thesis is that a return into a void can provide a reference area, but the transcript does not establish that every gap must be filled or specify a reliable deadline.
How ICT Combines Fair Valuation Concepts
The worked example layers several elements rather than treating any one of them as sufficient:
- Price is located in the lower part of a larger range.
- A smaller range has returned toward equilibrium.
- A recent swing high has been broken.
- ICT identifies a bullish order block near the retracement.
- Old highs and an overhead fair value gap provide possible objectives within his framework.
At 9:03, ICT applies this combination to the Australian dollar example. He describes a down candle preceding a move through a short-term high as a bullish order block and interprets the return toward that candle and equilibrium as supportive of a long bias.
Later, at 14:42, he contrasts a quick reversal after taking stops with sideways consolidation. In his reading, failure to move sharply lower after running above highs, followed by consolidation near equilibrium, supported continuation higher. Once price expanded, he says it began trading into the earlier void.
The Outcome He Reports for the Example
ICT opens the lesson by describing this as a chart he had mapped out in advance and says he called the Australian dollar higher during the week of the tutorial’s production, the week of 24 September 2016, with a stated weekly objective of 76.65 (1:20, 1:34, 1:41). He then states that the market did in fact reach that level (1:48).
That is a reported outcome about the speaker’s own earlier call. The chart is not present in the audio-only source, no fills, account statements or broker records are shown, and nothing available here lets a reader check the call, the level or the timing, so it should be read as an attributed claim rather than a verified result. The same caution applies to the order blocks, voids and gap locations he points to: the transcript preserves his words but not the chart they refer to.
How ICT Fair Value Changes by Position
A central distinction appears around 16:50. A higher price can be a premium for a trader chasing an advance while simultaneously being “fair value,” in ICT’s terminology, for a participant liquidating longs accumulated lower.
Conversely, he characterizes a discount as a location where longs might be accumulated or shorts covered. A premium may be used to distribute longs or establish shorts. Thus, “fair” does not mean inexpensive, average or intrinsically correct. It refers to valuation relative to a selected range and the hypothesized purpose of a transaction.
How to Study ICT Fair Valuation
The lesson can be converted into a chart-review checklist without assuming its market-maker narrative is proven:
- Define the most relevant current swing high and low.
- Mark the 50% equilibrium level.
- Classify price as below equilibrium, near equilibrium or above equilibrium.
- Repeat the exercise for a larger parent range and a smaller recent range.
- Note the most recent meaningful swing-high or swing-low break.
- Identify rapid one-way moves and any fair value gaps under ICT’s definitions.
- Mark old highs and lows as potential liquidity references.
- Build a directional hypothesis from the overlap, then define what price behavior would invalidate it.
ICT summarizes the framework at 25:34 as movement among stops, fair value, discount and premium, and says the sequence runs from buy stops and sell stops, from fair value to discount to premium and back (25:50, 25:56). Near the conclusion, at 26:45, he states that fair value in this framework is not fair value in the retail sense but the fair value of liquidating or accumulating from the market maker’s perspective. At 28:19 he tells students to wait for the market to give indications of where fair valuation is, and at 27:45 he urges them to locate price relative to the current range and study consolidation before expansion.
ICT Fair Valuation Limits and Learning Context
The most transferable educational point is the separation of location from direction. A midpoint is only a measurement; ICT adds structure, displacement, consolidation and nearby highs or lows to construct a hypothesis. Range selection remains subjective, however, and changing the chosen swing can change the premium, discount and equilibrium labels.
ICT also attributes price delivery and position management to banks, algorithms and market makers. The transcript supplies his interpretation but no order-book evidence validating those institutional claims. Traders studying the model should distinguish observable chart features (highs, lows, candle ranges and midpoints) from inferred participant motives. This material is educational and is not investment advice or a promise of trading performance.
About this source
This article is written from the recording’s own audio. The source used here is an automatic speech-to-text transcript of the full original audio, not human-corrected captions, and the speaker’s identity, words and reported outcomes are attributed to that recording rather than verified independently. The speaker dates the material to September 2016 and the watch page lists the upload as 25 August 2022; those are different things, and the article keeps the speaker’s dating of the session separate from the upload date rather than treating either as a contradiction. The transcript is not reproduced here and remains private.
Watch the source recording
ICT Mentorship Core Content – Month 1 – Fair Valuation
The Inner Circle Trader · watch page lists upload 25 August 2022 · 1954 seconds, about 32 minutes 34 seconds · public, not unlisted. The speaker dates the session itself to September 2016. This recording is the primary source for every timestamp link on this page.
The recording is not embedded here. An embedded player was tested directly on 15 September 2026 from a BestProps page origin: the frame loads and then reports “Playback on other websites has been disabled by the video owner”, with no playable stream and no duration reported. The link above opens the recording on YouTube itself.
Resources
These are the sources checked while preparing this article. The CFTC pages are the regulator’s advisories on forex fraud and on commodity trading systems sold on the internet; the CME Group page is the exchange’s own FX education material. None of them evaluates this speaker, tests whether equilibrium, a fair value gap or a liquidity void provides an edge, verifies the outcome he reports, or endorses anything said in the recording. Any ICT, smart-money or third-party indicator, script, note set, chart annotation or re-upload circulating outside the publishing channel’s own page is unofficial and untested here.
- [1] ICT Mentorship Core Content – Month 1 – Fair Valuation — The Inner Circle Trader (primary source; watch page read 15 September 2026, published 25 August 2022, listed at 1954 seconds).
- [2] The Inner Circle Trader — official YouTube channel (read 15 September 2026) — the publishing channel for the Core Content mentorship series this module belongs to.
- [3] U.S. Commodity Futures Trading Commission — Fraud Advisory: Foreign Currency (Forex) Fraud (read 15 September 2026) — the regulator’s advisory warning that the forex market is volatile and carries substantial risk and that promises of profit from already-public news are a common sign of a fraudulent pitch.
- [4] U.S. Commodity Futures Trading Commission — Fraud Advisory: Commodity Trading Systems Sold on the Internet (read 15 September 2026) — notes that technical analysis attempts to predict future price movements from historical prices, price relationships and price trends, and that hypothetical trading results are typically simulations over historical data rather than real fills.
- [5] CME Group — Introduction to FX (course page read 15 September 2026) — the exchange’s own introductory course on how listed FX futures work, quoted here only as contract-market background. It contains none of the lesson’s rules or figures.