
Key takeaways
ICT Mentorship Core Content – Month 1 – Equilibrium Vs.
Read the full summary
ICT Mentorship Core Content – Month 1 – Equilibrium Vs. Premium is the fifth installment of the month and the counterpart to the preceding equilibrium-versus-discount session, which he says covered so much ground that this one needs less time 0:32, 0:44, 0:49. He anchors a Fibonacci retracement over an impulse swing from a high down to a low, calls the 50% level equilibrium, and calls anything above it a premium market 2:11, 3:59, 4:10. He states plainly that he does not agree with trading the 50% level itself and that he wants to be selling above the midpoint 3:29, 3:35, 9:28. His preferred band is the 62% to 79% retracement he calls the optimal trade entry 2:25, 5:33. When a premium reversal also runs stops above an old high he calls it a turtle soup sell and takes profits below lows already established on the chart 7:23, 7:26, 7:37. He concedes a range can be anchored differently and produce a stop-out instead 8:30, says sloppy swings should not be measured, and says repeated stop-outs are going to keep happening 9:48, 13:04. He calls the examples hypothetical and hindsight-based, and the instrument is never named 20:39.
How we researched this article
BestProps used document-based research from primary firm sources, checked September 25, 2026. The complete source list, scope, limitations, and commercial-state record appear near the end of this article.
In ICT Mentorship Core Content – Month 1 – Equilibrium Vs. Premium, the speaker opens by placing the recording as the fifth installment of the first month of the mentorship and reminding the viewer that the previous session covered equilibrium versus discount, which is why he says this one can be shorter 0:32, 0:38, 0:44, 0:56.
The recording is spoken description of charts drawn on screen, and it is the sell-side mirror of the discount lesson. This article is built from an automatic speech-recognition pass over the audio and the reviewer did not view the video, so every level and shape below is what he says aloud rather than a level checked against a chart source.
How He Defines Equilibrium and Premium
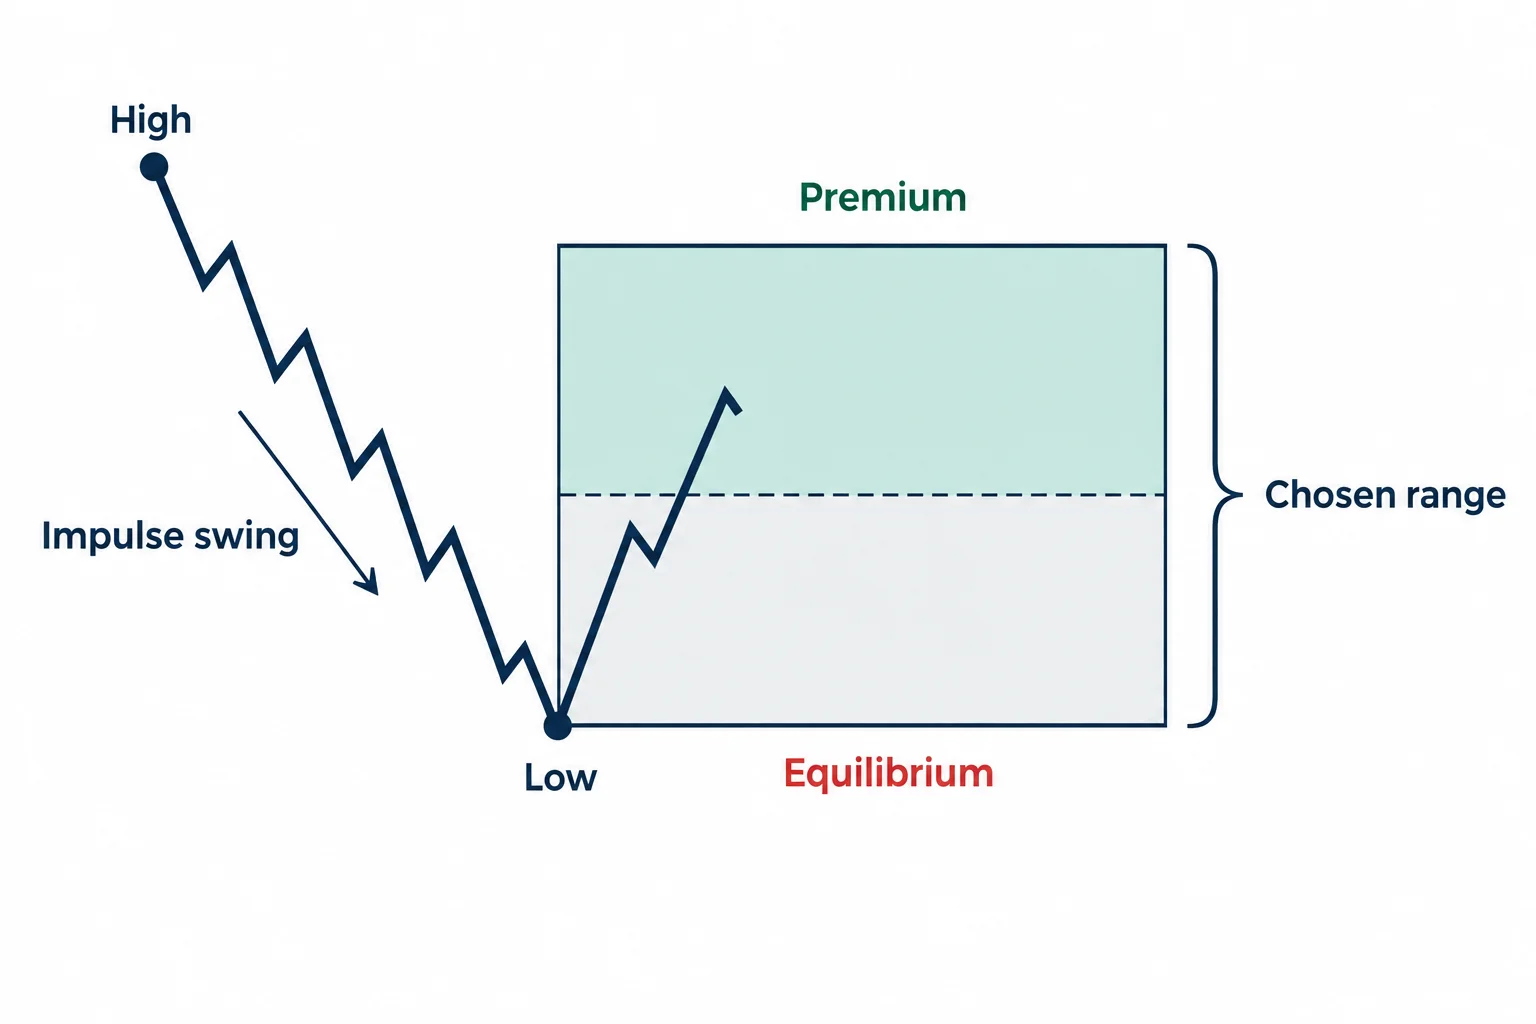
He introduces premium by distinguishing the topic of premium in commodities, which he says will come up later in the mentorship, from premium as it relates to price action, which is what he says this session is about 1:16, 1:23. From there the framework is arithmetic on a chosen range. He looks for an impulse swing, anchors a Fibonacci retracement from the high down to the low he says is the most relevant one, and treats the resulting levels as the map of the range 2:00, 2:11, 2:18.
His definition of equilibrium is deliberately narrow. He says equilibrium or half of the impulse swing has to be at least touched, and then states that this is all equilibrium is, the 50% level on the Fibonacci 3:13, 3:59. Premium follows from the same measurement: the concept, in his words, is that you have to see price move above the halfway point, and once it does it starts going into what he refers to as a premium market 4:03, 4:10.
He then makes the relativity explicit. Premium, as he uses it, means price is at a high level relative to its current trading range 4:14. That is why the same price can be premium in one range and not in another, and why he says the overbought-or-oversold question can be answered from the range instead of from an indicator: he says you do not need overbought and oversold indicators to classify a market, you simply need to know the current price range you are trading in 4:19, 4:25, 4:28.
Why He Will Not Trade the 50% Level Itself
This is the sharpest opinion in the recording. He notes that other teachers say the 50% retracement level of a price swing is a good level to trade, and says he does not agree with that 3:24, 3:29. He allows that it sometimes works, and explains what he wants instead: to be selling in a market that is at a premium level rather than at the midpoint 3:35, 3:35.
He returns to that idea near the end of the recording and states it as a general rule: he is always looking to sell at a premium, and premium is defined by price being above the equilibrium point, the 50% level of a Fibonacci anchored on a swing of clear, discernible price action 9:28, 9:30, 9:35. He reinforces it with an analogy about selling a car at a premium rather than a discount, saying professional traders sell long positions and initiate shorts at premium prices and that there is no better place to do it than above an old high, where willing buyers in the form of buy stops are waiting 17:02, 17:08, 17:15.
The Two Failed Examples and the Missed Opportunity
He walks through swings that do not qualify. In the first, price never gets above the 50% and never even touches it, so he says there is never an opportunity to get short relative to that time frame and that swing, and there would be nothing to do 4:37, 4:40, 4:47. In the second, the same applies to the higher swing, but he asks the viewer to look closer at a smaller swing that formed inside it 4:49, 4:56, 5:00, 5:05.
Measuring that smaller high to low, price gets right to the 50% level he calls equilibrium and then immediately sells off without staying above it long enough to reach a premium market 5:12, 5:15, 5:19, 5:22. He calls it a missed opportunity in terms of looking at equilibrium to premium, not a trade 5:26, 5:28. He adds that there will be times the market simply does not give the scenario to you and particular price swings go without you 5:52, 5:58.
The 62% to 79% Band He Prefers
He names the deeper retracement area as the optimal trade entry, a standard 62% to 79% retracement level on the Fibonacci, and explicitly says he did not create it 2:25, 2:33, 2:39. He gives his reason for preferring it to the midpoint: in that part of the range the market is pressed considerably higher, so from his reading it is most overbought and most willing to soften and go lower 5:33, 5:38, 5:43, 5:48.
He is also careful not to oversell the band. Immediately after naming it he says that if simply selling everywhere between 62% and 79% were the whole method, there would be no work at all in taking trades, and that the viewer probably learned quickly there is much more to it than pulling a Fibonacci over price swings 2:40, 2:48, 2:54, 2:58.
The next example is the one that behaves. Price trades back to equilibrium, moves above it into a premium market, and goes right through what he calls the optimal trade entry 6:08, 6:14, 6:21. He then spells out the intention: measuring that high to low and wanting to sell, he wants to be short in the band between 62% and 79%, above equilibrium 6:32, 6:38, 6:43.
Where the Turtle Soup Sell Comes From
He links this lesson back to the discount session’s stop-run idea and inverts it. Just as a move below a previous low in discount is probably a turtle soup buy, he says a move above equilibrium through the 62% and 79% levels gives the mirror condition: a turtle soup sell that reaches for stops above the impulse swing’s high 7:06, 7:12, 7:18, 7:23, 7:26. In the example he narrates, price runs out those stops above the swing high and then goes lower.
His profit rule is the reverse of the discount lesson too. Where the buy examples took profits above an old high, the sell examples take profits below lows that are already established on the chart 7:35, 7:37, 7:41, 9:14, 9:18, 9:22, 9:26. He restates the combined condition several times across the recording: price above the equilibrium point of the range high and range low, plus stops taken out at an old high, is what he calls a deep premium and describes as good in terms of probabilities 8:53, 8:57, 9:02, 9:08, 12:40, 12:46, 12:52, 14:50, 14:57.
Where the Range Selection Goes Wrong
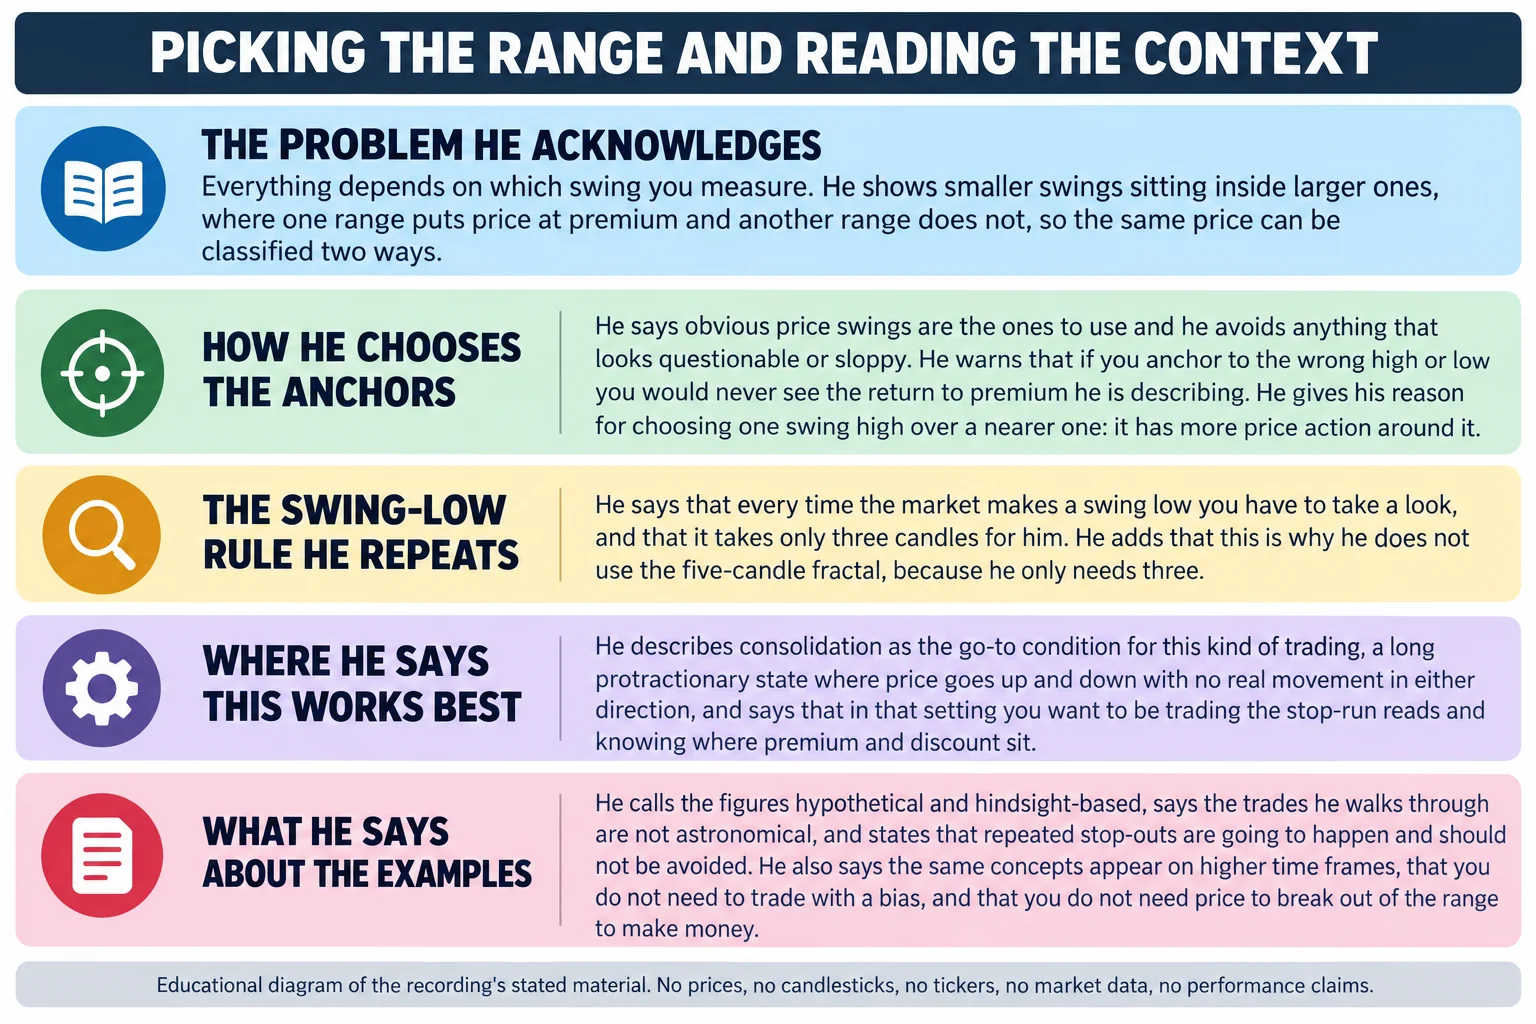
The recording is unusually candid about the weakness of the method. He shows a case where anchoring to one high and low would have meant a stop-out in the same 62% to 79% levels, because price ran right through them 8:30, 8:30, 8:38. He then states the consequence of the other anchor choice: if you had not anchored the Fibonacci to that high and low you would never see the optimal trade entry, or the return to premium, that he is pointing at 8:42, 8:49.
His stated filter for choosing a swing is visual rather than mechanical. He says to use swings from a high down to a low, that obvious price swings are the ones to look at, and that he avoids anything that looks questionable or sloppy 7:42, 7:49, 9:43, 9:47, 9:51. Later he gives a worked reason for one choice over another, saying he is using a particular swing high rather than a nearer one because it has more price action around it 19:24, 19:26, 19:30, 19:32. He also explains his preference against a widely used tool, saying he does not use the Williams fractal because it requires five candles while he only needs three 11:54, 11:59.
He is equally clear that the outcome is not reliable. He addresses the viewer who ignores the first profit target out of greed or impatience and then gets stopped out, telling them that scenario is going to happen and not to try to avoid it, and he repeats the instruction to assume being run through again 12:19, 12:24, 12:29, 12:34, 12:58, 13:04.
Consolidation as the Setting He Prefers
He says this type of trading is his go-to when the market is in consolidation, describing a long protractionary state where price moves up and down with no real movement in either direction 11:01, 11:06, 11:08, 11:16. In that setting he says the trader wants to be working the stop-run reads and tracking where premium and discount sit 11:21.
The Two Numeric Examples He Gives
Toward the end he works two examples with specific figures, and it is the only place in the recording where numbers appear. On the daily chart he says he gets short around the 98 big figure, notes the low that formed at 97.39 and the open at 97.99, and places a limit to take profits 10 pips below that low, targeting roughly 97.29 or 97.30, which he calls 70 pips on a daily chart 17:25, 17:32, 17:37, 17:40, 17:43, 17:51, 17:56, 18:01. He then moves to an hourly chart, says he gets short at 97.70, and measures 42 pips to the nearer low, 60 pips to the lower one, and 70 pips if he goes 10 pips below the latter, adding that leaving four pips for spread still takes him out 20:05, 20:18, 20:21, 20:25, 20:32, 20:50, 20:55.
Two qualifications belong with those figures. The instrument is never named in the recording, so the levels cannot be attached to a verified market, contract or date; the spoken chart is anonymous. And he introduces the numbers as hypothetical and hindsight, saying explicitly that it is all hypothetical and hindsight here while the conceptual idea is the same going forward 20:34, 20:40, 20:44. He also describes the trades he walks through as not astronomical and not enormous, which is his own characterisation of the outcomes 15:58, 15:58. Nothing in them is a fill, a verified execution or a track record.
What He Says About Time Frames and Bias
He argues the concepts are not confined to the intraday charts most of his teaching uses. He says the same concepts appear on higher-time-frame charts and tells the viewer not to discount the material on the grounds that it is usually taught intraday, because he says all of the concepts are universal 18:08, 18:14, 18:17, 18:22, 18:30. He connects this to traders who cannot sit through day trades, saying a daily chart does not need a great deal of movement to produce a decent amount of pips 16:19, 16:25.
He is also dismissive of the need for directional bias. He says you do not have to trade with a bias, describes being asked repeatedly for a daily bias or a trend direction, and answers that you do not really need to know it 18:50, 18:53, 19:00, 19:02, 19:04. His stated reason is that you need to know how to trade inside a range, that those ranges are always there whether the market is trending or consolidating, and that you do not need to break out of the range to make money 19:05, 19:11, 19:16.
How to Read This Lesson Without Overreading It
- The 50% midpoint has to be touched before premium exists. His own definition ties premium to the midpoint of a chosen swing, so on a swing where price never reaches the 50% level there is no premium trade in his framework at all 4:37, 3:13.
- “Premium” is relative, not absolute. It describes price above the midpoint of the particular range being measured. Two defensible anchors on the same chart can put the same price at premium in one and at equilibrium in the other, which he demonstrates rather than denies.
- The 62% to 79% band is a preference, and he says so. He calls it his optimal trade entry, states he did not create it, and immediately warns that trading the band alone would not be work; he also states he does not agree with trading the 50% level other teachers recommend 2:39, 3:29.
- Range selection is discretionary and he concedes the cost. His filter is that swings should be obvious rather than sloppy, which is a visual judgement rather than a test, and he shows a case where the alternative anchor would have produced a stop-out instead of the trade 9:47, 8:30.
- The reported outcomes are his narration of hypothetical examples. The instrument is never named, the numbers he quotes are described as hypothetical and hindsight-based, and he says repeated stop-outs will keep occurring 20:44, 13:04. Captions and spoken narration cannot independently establish fills, costs or performance.
- The probability language is his. Phrases such as very good probabilities and really, really good appear as his characterisation of the setup, and the recording contains no sample size, no comparative test and no risk model behind them 9:08, 14:49.
- This is not instruction to trade. The material is an educational explanation of one trader’s price-location framework. Nothing here is investment advice or a claim of profitability.
Watch the Original Recording
ICT Mentorship Core Content – Month 1 – Equilibrium Vs. Premium
The Inner Circle Trader · watch page lists upload 24 August 2022 · 1,259 seconds, about 20 minutes 59 seconds. The recording identifies itself as the fifth installment of the first month of the mentorship, and it is the primary source for every timestamp link on this page.
The recording is not embedded here. An embedded player was tested directly on 15 September 2026 from a BestProps page origin at desktop and mobile widths: the frame loads and the player reports “Playback on other websites has been disabled by the video owner”, with no duration and no playback progress, while the video itself is publicly playable on YouTube. The oEmbed endpoint answers 401 Unauthorized for this video for the same reason. No half-working player is left on this page.
The watch page was read on 15 September 2026 and is publicly listed as ICT Mentorship Core Content – Month 1 – Equilibrium Vs. Premium by The Inner Circle Trader, not private and not unlisted, with an upload timestamp of 24 August 2022 and a listed duration of 1,259 seconds. The recording places itself as the fifth installment of the first month of the mentorship, which is a different calendar date from the upload; both are reported as they are, and neither is treated as a contradiction.
A Note on the Transcription
The transcript behind this article is an automatic speech-recognition pass over the full original audio of this recording, not human-verified captions and not a caption track, and this review did not view the charts. Its cached quality record reports the audio complete at a maximum level of −7.7 dB, with 354 low-confidence characters concentrated in four consecutive segments between roughly 1:30 and 1:53 1:31, 1:48. Those segments carry his description of how several smaller impulse swings combine into one larger swing, so the nesting idea is reported as his spoken description with that rendering caveat attached rather than quoted as clean text. The Fibonacci percentages, the 62% to 79% band and the pip arithmetic elsewhere in the recording render consistently between his restatements, which is why they are reproduced above with their anchors. Nothing on this page comes from anywhere other than the spoken content of this recording.
Resources
These are the sources checked while preparing this article. The CFTC and Investor.gov pages are general regulator material about how trading-system and technical-analysis claims should be assessed; neither evaluates this speaker, tests whether a range anchored this way behaves as described, verifies any level quoted in the recording or endorses anything said in it. Any ICT, smart-money or third-party indicator, script, note set, chart annotation, transcript pack or re-upload circulating outside the publishing channel’s own page is unofficial, has not been tested here, and no claims are made about its accuracy or repainting behaviour.
- [1] ICT Mentorship Core Content – Month 1 – Equilibrium Vs. Premium — The Inner Circle Trader (primary source; watch page read 15 September 2026, listed duration 1,259 seconds, about 20 minutes 59 seconds).
- [2] The Inner Circle Trader — official YouTube channel (read 15 September 2026) — the publishing channel for the mentorship series used here.
- [3] CFTC — Fraud Advisory: Commodity Trading Systems Sold on the Internet (read 15 September 2026) — states that technical analysis attempts to predict future price movements based on historical prices, price relationships and price trends, and warns that hypothetical trading results are typically based on simulations using historical price data.
- [4] Investor.gov (U.S. SEC) — Glossary: Technical Analysis (read 15