
Key takeaways
In this fourth teaching of the first mentorship month, the speaker frames ICT equilibrium and discount as a way of valuing price inside a chosen range rather than as an entry signal.
Read the full summary
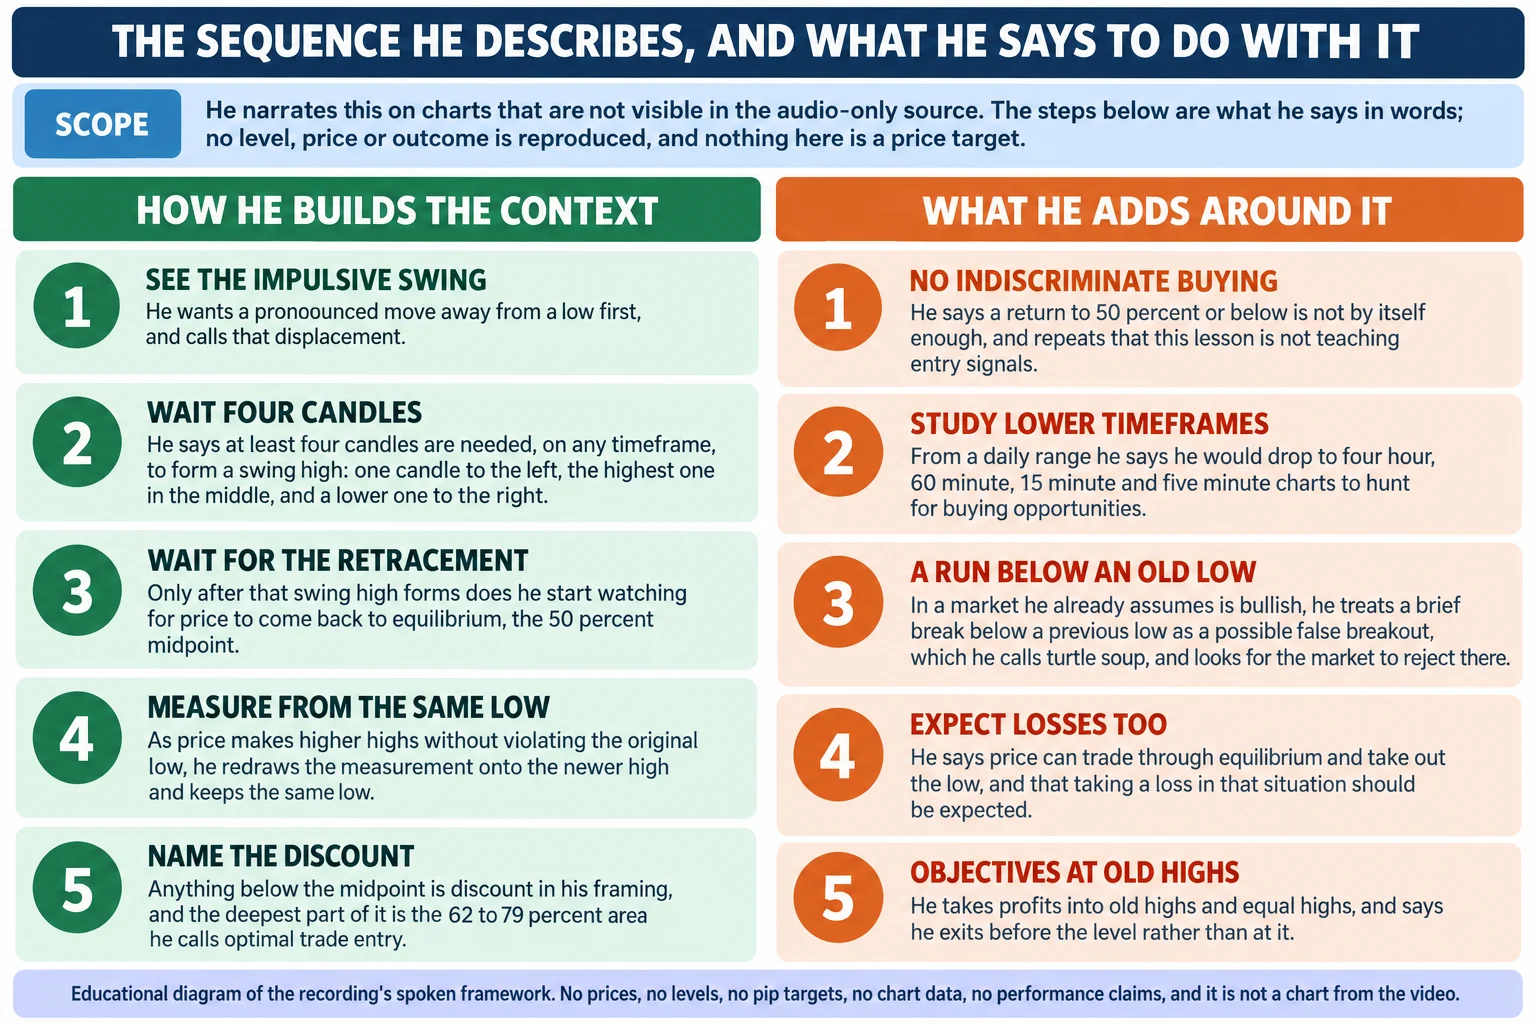
In this fourth teaching of the first mentorship month, the speaker frames ICT equilibrium and discount as a way of valuing price inside a chosen range rather than as an entry signal. He defines equilibrium as the midway point of an impulsive price swing, marked with the 50% level of that measured range (10:24). He starts from a pronounced move away from a low, waits for a confirmed swing high — a central high with a lower candle on each side — and only then watches for price to retrace to the midpoint (9:48, 11:59, 12:12). As long as the original low holds, he redraws the measurement onto each new high and keeps that same low, so the working range is an updateable reference rather than a fixed one (14:04, 21:42). Everything below the midpoint is discount in his framing, and the deep part of it, roughly 62% to 79% of the range including 70.5%, is what he calls the optimal trade entry area (24:09). He says reaching the midpoint is not by itself a reason to buy, that the Fibonacci tool has no predictive power on its own, and that the framework produces losses often enough that they should be expected (1:36, 17:11, 31:40). Trade examples he narrates come from charts that are not visible in the audio source; they are attributed here as his statements, not verified.
How we researched this article
BestProps used document-based research from primary firm sources, checked September 25, 2026. The complete source list, scope, limitations, and commercial-state record appear near the end of this article.
This article summarises a single recording: ICT Mentorship Core Content – Month 1 – Equilibrium Vs. Discount, published on The Inner Circle Trader channel. The watch page lists the upload as 24 August 2022, a length of 3388 seconds (about 56 minutes 28 seconds) and the video as public.
Two dating details are kept separate. The watch page carries the August 2022 upload date, while inside the recording the speaker refers to a chart range running from an August 14th low into September and to “Friday’s close of September 16th”. Those are his own session references on his own charts. They are not evidence about the upload date, and nothing here tries to fold the two into a single calendar claim.
The source behind every timestamp link on this page is an automatic speech-to-text transcription of the recording’ audio, produced locally with a Whisper large-v3-turbo model. It is not a human-verified caption track, so individual words can be misrecognised. Where a term looks wrong in context that is flagged in place rather than corrected silently. The transcript is not reproduced here and stays private.
One limit applies to the whole lesson: the speaker narrates charts, and charts are not part of an audio source. Nothing below reconstructs chart coordinates, order fills or instrument prices from the video image. Reported figures are quoted as what he says about his own charts, and the framework is presented as his market model rather than as an independently established account of how banks or algorithms trade.
He opens by placing the session in its series (0:31) and by warning that it will look elementary to long-time students before adding depth to the optimal trade entry idea he introduced in 2010 (1:08). He also repeats an instruction from earlier in the mentorship: do this work in a demo account (2:25).
What He Calls Equilibrium
Equilibrium is defined in one sentence: 10:24. On a chart that midpoint is marked with the 50% level of the measured range, which he calls 11:09. He measures from a low up to a high and treats the halfway point as the boundary between the two halves of the swing.
He is explicit that the measuring tool has no independent power. He says 1:36, that it does not by itself say where a market will reach for, and that some projection on the trader’s part is unavoidable. In his framing the ratios are a way of seeing where the midpoint sits, not a source of signals.
The two halves are then named from the perspective of a bullish thesis: above the midpoint is premium, below it is discount. In this session he says 11:26 and tells the audience the premium side is the subject of the following week’s teaching. That is the boundary of this recording, and the article does not extend it.
Reading the Swing: Impulse, Four Candles and the Midpoint
The sequence starts with a pronounced move. He wants an impulsive price swing away from a low first, and calls the force behind that kind of move displacement (6:21). His explanation of why price runs that way — larger participants accumulating and then offering at higher prices — is his interpretation of market behaviour, not something the recording demonstrates.
Nothing is measured while the move is still forming. He says the trader only starts watching for a retracement once price comes back off the high, and that the high itself has to be confirmed: 9:48 on any timeframe, with one candle to the left, the highest candle in the middle and a lower candle to the right (11:59). Only when that pattern is in place, and 12:12, does the midpoint become relevant.
He also says to start the exercise on the daily chart (12:35) because it gives a trader room to plan, and that from a daily reference he would work down into lower timeframes to look for buying opportunities (11:16). He states plainly that this session is about context rather than entry signals, and repeats the point later: reaching the 50% level or going below it is not enough on its own (17:11).
Updating the Range Without Moving the Low
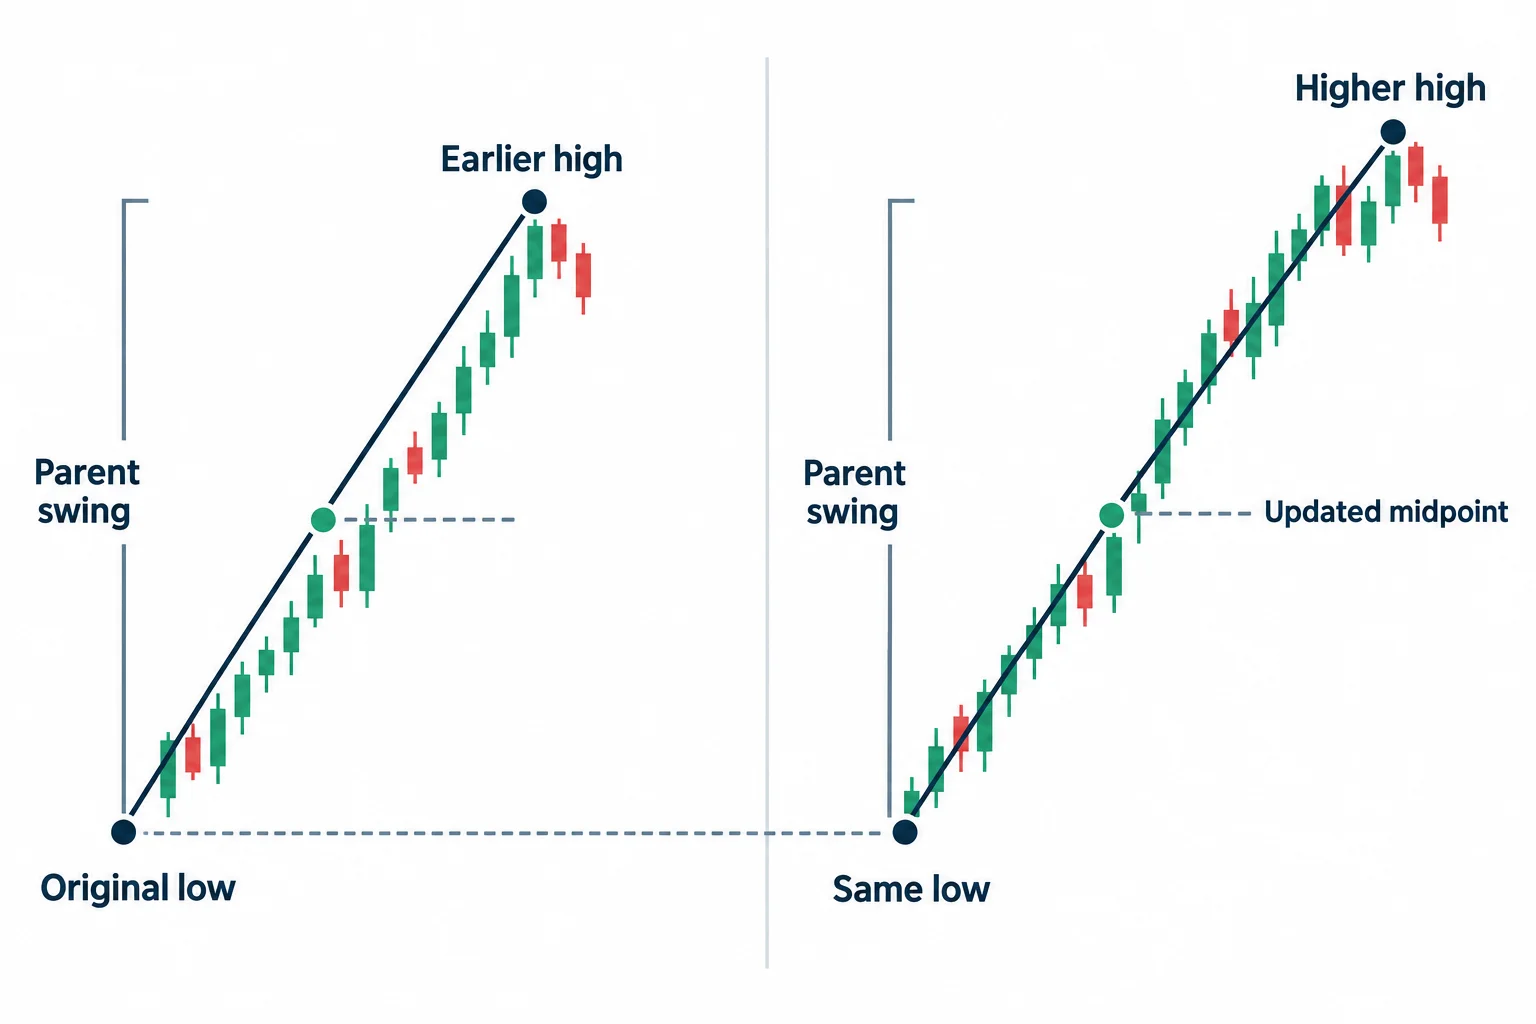
One detail separates this from a static retracement tool. As price makes a higher high without breaking the original low, he redraws the measurement onto the newer high but keeps the same starting low, because 14:04. Repeating that as the market steps higher produces what he calls the parent swing — the larger measured range still in force (21:42).
Range selection is therefore a judgement call, not a fixed calculation, and he says as much when he shows alternative swings on the same chart and picks the one with the strongest reaction. A reader following the method has to decide which low and which high define the working range, which is why he keeps returning to study rather than to a formula.
Discount Below the Midpoint
Below the midpoint the market is described as being at a discount relative to that measured swing. He describes the consequence in relative terms: in a market whose underlying basis is bullish, 16:24, and the move away tends to be quick. He frames that responsiveness as a built-in relative-strength check on both the range and the bullish premise.
He then walks through a daily example where price took out an old high, sold off, returned to the midpoint and 16:50. His reading is that the market is then in an area that can be bought at the banking level, but he qualifies it immediately: a trader cannot buy indiscriminately anywhere from the midpoint down, because more information is required first.
The 62% to 79% Area He Calls Optimal Trade Entry
Inside discount he singles out a narrower band. He names 29:35 as the levels he keeps on his Fibonacci tool and calls the area around 62% to 70.5% 24:09. In this session the optimal trade entry idea is the deep-discount zone of the measured range, not a standalone signal.
He explains the attention that band gets in terms of measurement rather than the ratios themselves: those levels are sensitive because they show how far the current range has extended (29:46), which is consistent with his earlier remark that 1:36. In the automatic transcript the phrase describing those levels is rendered as “tradesman levels”; given the surrounding discussion of retracement the intended term appears to be retracement levels, while the values 62, 70.5 and 79 are unambiguous.
Stop Runs, Turtle Soup and Where He Takes Profits
The second half of the lesson layers his liquidity concepts onto the valuation framework. When the market is already assumed bullish and price dips below a previous low, he treats the break as a likely stop run rather than a change of trend (37:57). If price rejects quickly from that break he calls the pattern a false breakout, or 32:29, and looks for expansion away from the low.
He also states the mechanism as he sees it, saying that price often retraces simply to let orders build above an old high, that 46:50, and that 46:32. Those statements are his market model and his vocabulary. A transcript cannot verify that any particular participant placed orders at any level, and none of it is presented here as established fact.
For exits he uses the same structural references in reverse: after a stop has been run he looks to take profit once price clears a previous high, and says he wants to be out before the level rather than at it (46:26). Equal highs and old highs are the areas he marks as objectives (51:24).
What He Says Invalidates the Idea
The recording is direct about failure. When price trades through the midpoint and takes the low out, he says the trader is 31:40, and treats that as an expected outcome of the method rather than an anomaly. He keeps the original low as the anchor only while it holds — 14:04 — so a violation is what changes the measurement, and he says the range he picks is itself a judgement call when several swings are available on the same chart. Later he makes the same point about a broken low inside his stop-run logic: if the market is genuinely bullish it should not keep going, because the stops have already been taken (53:02).
The Intraday Aside on Grades of 10
Near the end he adds a short intraday note, saying that 51:03 — the idea that short-term price reaches for liquidity in small fixed increments above a high — and ties it back to the equal-high references already marked on the chart. He presents it as something taught earlier in his material rather than as a new rule, and the recording makes no attempt to demonstrate it statistically.
Reported Examples From the Recording
Several numbers appear as he narrates his own charts. They are recorded here as his statements, and nothing in this article treats them as verified fills or reproducible results.
- A hypothetical long inside a small consolidation before an expansion, entered around “the 95 big figure” and taken to the equal-high area near 98.50, which he calls a 300-pip move on a signal that 19:47 19:56.
- A second example in which a position bought in the middle of a range and exited at the bottom of a bearish order block is put at 36:58, with a restatement in the same breath of a figure he gives as roughly 170 pips. The automatic transcription renders that follow-up phrase unclearly, so the second number is reported without embellishment and the pair is left as his own rounding.
- An hourly example where he says the open of one candle and the high of another both print 97.68, so profit should be taken before that level rather than at it (49:42). Digits are easy to misread in an automatic transcription, the chart is not visible in the audio source, and the transcript does not name the instrument he is narrating at that moment clearly enough to attribute the figure to a pair.
- A frequency claim: on the daily chart he says setups of this kind come along roughly weekly (37:12).
He closes by framing the whole lesson as a foundation to study in hindsight first, and announces the next topic as the premium side of the same range (56:15). Nothing in the recording is presented as investment advice, and no performance, profitability or accuracy claim is made for the method in this article.
Study Checklist
- Write down the directional premise first; this recording only handles the bullish case.
- Mark the impulsive move away from a low and wait for a swing high: lower candle, highest candle, lower candle.
- Count the fourth candle turning lower before measuring anything.
- Measure the swing low to the confirmed high and mark the 50% midpoint as equilibrium.
- Redraw the measurement onto each new high while the original low holds, and track which range is the parent.
- Label everything below the midpoint as discount and mark the 62%, 70.5% and 79% references inside it.
- Note previous lows that were broken and rejected, and previous highs and equal highs, as reference objectives.
- Record the cases where price traded through the midpoint and took the low out; he says those losses are part of the method.
Watch the source recording
ICT Mentorship Core Content – Month 1 – Equilibrium Vs. Discount
The Inner Circle Trader · watch page lists upload 24 August 2022 · 3388 seconds, about 56 minutes 28 seconds · public, not unlisted. This recording is the primary source for every timestamp link on this page.
The recording is not embedded here. An embedded player was tested directly on 15 September 2026 from a BestProps page origin: the frame loads and then reports “Playback on other websites has been disabled by the video owner”, with no playable stream and no duration reported. The link above opens the recording on YouTube itself.
Resources
These are the sources checked while preparing this article. The two CFTC pages are the regulator’ fraud advisories on forex and on commodity trading systems sold online, and the Investor.gov page is the SEC investor-education entry on day trading. None of them evaluates this speaker, tests whether equilibrium, discount or the optimal trade entry area provides an edge, verifies any figure reported in the recording, or endorses anything said there. The CME Group FX course page was not reachable during this review and is therefore not cited. Any ICT, smart-money or third-party indicator, script, note set, chart annotation or re-upload circulating outside the publishing channel’ own page is unofficial and untested here.
- [1] ICT Mentorship Core Content – Month 1 – Equilibrium Vs. Discount — The Inner Circle Trader (primary source; watch page read 15 September 2026, published 24 August 2022, listed at 3388 seconds).
- [2] The Inner Circle Trader — official YouTube channel (read 15 September 2026) — the publishing channel for the Core Content mentorship series this lesson belongs to.
- [3] U.S. Commodity Futures Trading Commission — Fraud Advisory: Foreign Currency (Forex) Fraud (read 15 September 2026) — warns that the forex market is volatile and carries substantial risks, that it is not the place for money you cannot afford to lose, and that scam pitches commonly promise profit from news already public.
- [4] U.S. Commodity Futures Trading Commission — Fraud Advisory: Commodity Trading Systems Sold on the Internet (read 15 September 2026) — notes that technical analysis attempts to predict future price movement from historical prices, price relationships and price trends, and that hypothetical trading results are typically simulations over historical data rather than real fills.
- [5] U.S. Securities and Exchange Commission, Investor.gov — Day Trading (read 15 September 2026) — the regulator’ plain-language warning that day trading is extremely risky and can result in substantial financial losses in a very short period of time. Background only; it does not address this lesson.