
Key takeaways
ICT reviews a reported NQ futures trade built from a bullish daily buy-side imbalance and sell-side inefficiency premise, then executed on the one-minute chart during the first day of the Jackson Hole Symposium, while BestProps stresses that machine captions, absent charts and unaudited fills prevent independent verification.
Read the full summary
ICT reviews a reported NQ futures trade built from a bullish daily buy-side imbalance and sell-side inefficiency premise, then executed on the one-minute chart during the first day of the Jackson Hole Symposium, while BestProps stresses that machine captions, absent charts and unaudited fills prevent independent verification. Candle bodies held at or above 29,451, relative equal lows were swept, and ICT entered below the prior low after price failed to close below the midpoint of the first post-open fair value gap from 21 August, then sought a close above the wick midpoint, acceptance above an inversion fair value gap and a successful retest. He moved his stop to 29,501.75 and says the September NQ low reached 29,502.00, one 0.25-point tick above it. His pyramiding rule permits long additions only at or below equilibrium, although he concedes a second entry did not qualify against his original 29,514.50 measurement and says he re-anchored to a wider range. He reports starting with six contracts, adding four in discount, removing four above a prior high, planning to exit five of the remaining six at the next high and leave one runner, which later stopped out after narrowly missing the high of a green-shaded imbalance. He identifies the management error as failing to move the runner stop beneath the open of an emerging order-block candle after two consecutive up-close candles signaled changed delivery. The broader method prioritizes daily bias, liquidity sweeps, body acceptance or rejection, fair value gaps, inversion gaps, wick consequent encroachment and predefined equilibrium before lower-timeframe execution. Later levels discussed but not traded include 29,662 consequent encroachment, a prospective push toward 29,757 and a measurement into the 29,830s. TradingView Bar Replay is suggested for bar-by-bar study but cannot reproduce live event conditions, while CME Group specifications cited for MNQ state a value of $2 times the Nasdaq-100 Index and a minimum tick of 0.25 points. The original lesson is available through YouTube, although embedding was disabled by the video owner, and the article remains educational commentary rather than an official ICT transcript, audited performance record or trading recommendation.
How we researched this article
BestProps used document-based research from primary firm sources, checked September 25, 2026. The complete source list, scope, limitations, and commercial-state record appear near the end of this article.
In NQ Trade Review & Detailed Look at Price Delivery, ICT reviews an NQ session on his own charts and links a daily-chart premise to one-minute execution. The recording itself is dated Friday, 28 August 2026: at 0:07 he notes it is the last trading day of the week, and he says he will explain how he traded the previous session, the first day of the Jackson Hole Symposium. This article follows the captions of that recording, with timestamps, and separates what he says from what can be independently verified.
Two limits apply throughout. The captions are machine-generated and mangle parts of his vocabulary, and captions show no chart, so they cannot confirm the displayed annotations, order tickets, fills or the exact price path. Everything below is therefore attributed: reported levels, reported position sizes, stops and outcomes are the speaker’s account of his own session, not audited records. Nothing here is a recommendation, and nothing here shows a tested or repeatable result.
Educational review only. Futures trading carries a substantial risk of loss, and one recorded session cannot establish that any approach will work again.
ICT Price Delivery Premise on the Daily Chart
ICT starts with a daily dealing range and the gray band visible on his intraday charts. At 1:20 he describes that band as the daily buy-side imbalance / sell-side inefficiency (the range that, in his description, includes the volume imbalance at its low). He distinguishes it from a suspension block: he says the structure is not a suspension block here because the required volume imbalance is not present at the high. His own label for that block is rendered inconsistently by the captions; the surrounding sentences support reading it as “suspension block,” which is how it is treated below.
The directional expectation came from an objective price had approached without reaching. At 2:41 he says that because price did not deliver to that level on the way down, his PDA reading suggested the market was returning to premium, so he was looking for higher prices. He then lists the draws he expects price to work toward: individual highs, the midpoint of a wick (his consequent encroachment), and the remainder of the older imbalance. His framing is deliberately hierarchical: the daily area and the direction come first, and the one-minute chart is used to execute the idea rather than to generate it.
ICT NQ Trade Expectations at the Market Open
At 5:40 the review moves fully to the one-minute chart. From about 6:14 he describes the regular-session open as an alternating sequence: price traded down and took sell-side references, then rallied through buy-side references while leaving another one standing, slightly lower.
He expected that behaviour because of the event backdrop. Around 4:56 he says day one of the Jackson Hole Symposium carries the highest likelihood of a “seek and destroy” day, in his terminology an expanding session that clears stops on both sides and uses the commentary around the event as a smoke screen for what looks like buying and selling pressure. By 8:36 he is describing exactly that: up, down, up, clearing stops on each swing, and at 9:01 he compares the shape to what retail material calls a megaphone pattern that widens as it goes.
He kept a bullish higher-timeframe premise because candle bodies were not closing below an upper subdivision (an octant) of the daily area. From 7:49 he identifies that level at 29,451 and later notes that the bodies held at or above it. For him, the absence of acceptance below the level meant the lower move was more likely a liquidity raid than sustained bearish delivery.
ICT NQ Trade Entry Fill and Stop
The entry logic is set out from 10:59, where he says he expected relative equal lows to be taken and was giving price the chance to trade into the first fair value gap presented after 9:30, the one from the prior Friday, 21 August. At 12:22 he describes the range he was measuring in his head: from the low that had formed to the high of that gap.
Around 14:44 he explains the condition he wanted met first: a candle closing below the midpoint between the low and the high of the gap. It did not close below that midpoint, though he gave the next candle a moment to spike down and do it. Because it did not, he entered instead of waiting for a deeper retest, and at 15:47 he points out what he calls his fill, below the prior low, in his model the minimum criterion for buying sell-side liquidity. Pressed by the market moving away without him, he says he could not wait any longer.
He then wanted confirmation rather than an immediate extension:
- A close above the midpoint of the relevant wick, which he notes happening at 17:40.
- Acceptance above the area he classified as an inversion fair value gap, discussed from 18:29 and confirmed for him at 19:05.
- A retest of that gap that holds rather than producing renewed downside delivery, which he records at 19:13.
None of these is presented as a generic candlestick signal. Within his framework they mattered because they lined up with the daily premise, the sweep of lows already completed, and the volatility profile he expected from the event.
On risk, he reports rolling his stop to 29,501.75 below a wick at 19:33, and says price later traded within one tick of it without triggering it. At 29:06 he asks viewers to check the low on the September NQ contract at seven minutes past 10:00 a.m. Eastern and states it as 29,502.00, a quarter point, one tick, above his stop. He also answers a viewer who argued that a “real broker” would have taken the stop: his reply is that futures traders all see the same high and low while forex customers trade inside a broker's own pool of liquidity that can widen spreads against them. That is his interpretation of how the two markets behave, not an independently verified claim. He adds that had the stop been hit he would have re-entered immediately and rebuilt the full position.
ICT Trade Management Targets and Errors
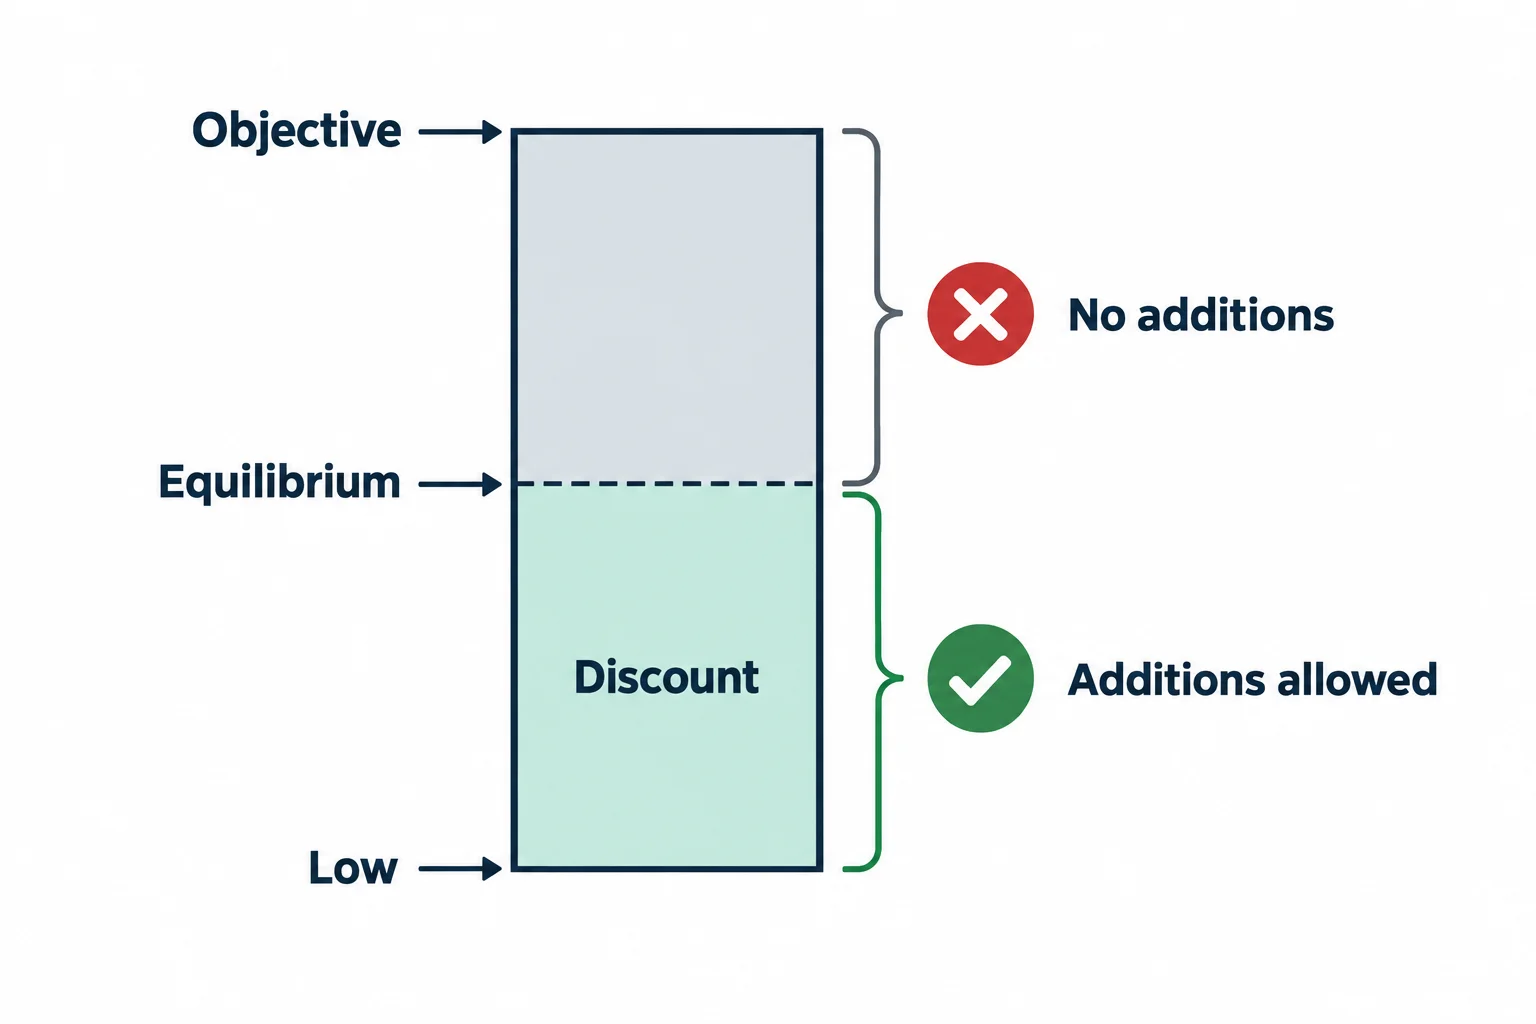
At 22:22 he states his addition rule: for a long, pyramiding must happen at or below equilibrium (the midpoint between the low he is measuring from and the objective he is aiming at), and once price trades beyond equilibrium he does not permit himself to add. He then applies the rule to his own second entry and, at 30:51, concedes that the entry did not fit the level he first measured (29,514.50) and explains that he had already committed to the larger idea, so he re-anchored the measurement to a wider range where the entry did sit at or below equilibrium. That is his account of the decision, not a verified fill.
He reports the position in stages from 41:53: an initial entry of six contracts, four added in discount, then four taken off just above a prior high, leaving six; his plan was to remove five at the next high and leave one runner for a more distant buy-side target. The runner’s exit was placed at the high of a green-shaded imbalance, which he explains at 42:49. He says price came close to that target, failed, and stopped the remainder out at 43:12.
He then grades that decision himself. His view, stated at 43:16, is that the less-than-optimal part was leaving the stop where it was instead of moving it to the open of a specific candle: by then, two consecutive up-close candles and the way price had travelled suggested a change in the state of delivery and an emerging order block, and he argues a stop that sits below a level price still needs to draw toward is the wrong place to hold risk. The position size and the numbers are his reported figures; the captions cannot authenticate the orders.
NQ Price Delivery Through Wicks and Imbalances
A recurring lesson is to split a significant wick into halves. From 27:21 he explains that when price is above a wick and the context is bullish, the bodies should hold in the upper half; a close back below the middle of that upper half is what made him uneasy, and he describes leaning on the fact that a probe lower should be a wick rather than a body. He applies the mirror image later: at 55:26 he notes that in a bearish read at a daily array the bodies failing to reach consequent encroachment is exactly the behaviour he wants to see.
From 47:50 onward he walks through the later session, and at 50:05 states plainly that he did not trade any of it. He narrates a reaction off the daily gray area, a change in the state of delivery with an order block, an inversion fair value gap, the final-hour “macro” windows he names at 52:24 as 2:50–3:10 and 3:15–3:45, and a push in the last ten minutes that the captions render as “merger on close / MOC” at 53:13. At 53:36 he attributes a bounce to the daily inversion fair value gap, and at 53:56 identifies its consequent encroachment as 29,662.
Looking ahead, at 59:12 he notes it is Friday, day two of the symposium, and tells viewers to expect the unexpected; at 59:27 he refers to pressing toward 29,757 with a measurement into the 29,830s. Those are his stated expectations for a session that had not happened when he recorded, not verified outcomes, and they are not a forecast you should act on.
ICT NQ Trade Review Lessons
- Build the daily context and the directional expectation before studying a one-minute entry, then use the lower timeframe only to execute.
- Track whether candle bodies accept or reject a level; a wick touching a level is not the same event as a body closing beyond it.
- Write the range, equilibrium and objective down before deciding whether another entry is still in discount, and honour the rule when it says the next entry does not qualify.
- Separate the plan for the initial target from the discretionary runner, and pre-commit where each exit lives.
- Review the management mistake without rewriting the original thesis; here the thesis is defended and the stop handling is not.
- Treat event sessions such as the Jackson Hole Symposium cautiously. The speaker himself describes them as producing unusual volatility at unusual times.
He closes by encouraging viewers to annotate daily wicks, old highs and lows and inefficiencies on their own charts and to slow down while studying. Those are his interpretations and his terminology; they are not proof that the market behaves this way.
ICT NQ Trade Review and Price Delivery Video
The mapped source lesson is NQ Trade Review & Detailed Look at Price Delivery from The Inner Circle Trader. This BestProps article is independent educational commentary grounded in that recording’s captions: it is not a transcript, not an official ICT lesson, and not evidence that any entry, addition, exit or result described in the recording occurred as reported.
Watch the original lesson on YouTube
This recording cannot be played inside another website. A test run from a BestProps page on 13 September 2026 loaded the YouTube player for this video and the player itself returned “Playback on other websites has been disabled by the video owner,” with no playback position and no media data, so no player is embedded here and no owner restriction beyond that message is asserted. You can watch the full lesson directly on YouTube.
Watch NQ Trade Review & Detailed Look at Price Delivery on YouTube ↗
ICT Trade Review Sources and Price Delivery References
Three references support the practical side of this article: the exchange page that defines the contract being sized, vendor documentation for replaying a session bar by bar, and an unofficial community summary of the same recording.
Size Each NQ Trade From Exchange Specifications
CME Group states that Micro E-mini Nasdaq-100 futures (MNQ) are smaller-sized versions of its benchmark E-mini contracts, designed to manage exposure to the 100 leading non-financial U.S. large-cap companies that make up the Nasdaq-100; the same page states that the contract is $2 x the Nasdaq-100 Index and has a minimum tick of 0.25 index points.[1]
That page is the reference for converting anything you study into a position you can actually size. Contract multipliers, tick minimums, margin requirements and trading hours are set by the exchange and can change, so a figure you calculate today is only valid against the specification you read. Check the exact contract and month, then convert to account currency and to the maximum loss your plan and your firm’s rules allow.
Replay NQ Price Delivery With Documented Tools
TradingView documents how to open Bar Replay, choose a starting point, step forward one bar at a time, adjust speed, restart from a different point, run replay across a multi-chart layout, and jump back to live data.[2] The same page lists limitations that matter for this workflow: server-side alerts keep firing on real-time data and new ones cannot be created during replay, trading orders are executed against real-time data, non-standard chart types are incompatible with replay, and spread and tick-based charts do not work in it.
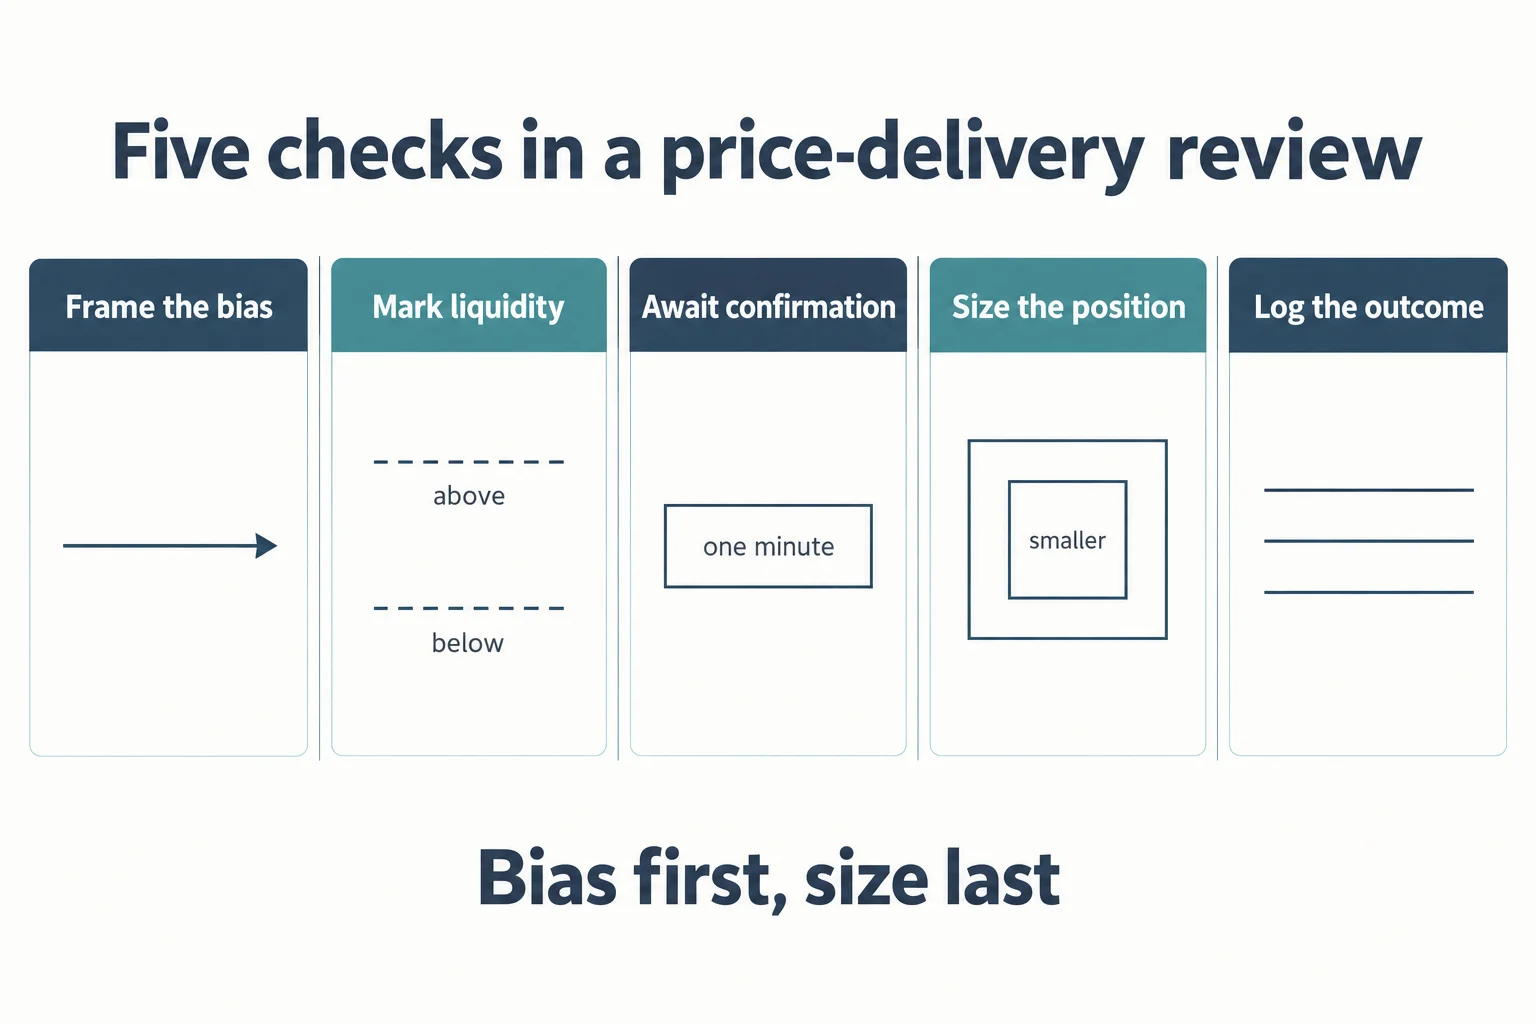
Use it to practise the sequence described above (premise, liquidity, confirmation, risk) without reading a finished chart backwards. It is third-party vendor documentation for a charting feature, not a strategy and not a performance record, and it does not reproduce the live conditions of an event session: any conclusion drawn from a replay is drawn with the benefit of a completed record.
Treat Third-Party ICT Trade Summaries as Unofficial
An ICT Archivist entry for this recording exists and links to the same video.[3] It is a community-run archive that summarises Inner Circle Trader recordings in its own words, carries a displayed publication date of 2026-08-28, and is not the original lesson, not an official ICT publication and not affiliated with BestProps. Its summary broadly matches themes in the recording (daily arrays, volume-of-bounce areas, pyramiding at or below equilibrium, partials and runners, and volatility around the symposium), but it is a paraphrase of reported remarks, not a verified outcome, and it is not the source of any claim in this article; the captions of the recording are.
ICT Trade Sources and Tool Documentation
- [1] CME Group: Micro E-mini Nasdaq-100 Futures Contract Specs
- [2] TradingView: How do I turn Bar Replay on?
- [3] ICT Archivist: NQ Trade Review & Detailed Look at Price Delivery (unofficial community summary)
BestProps is not affiliated with CME Group, TradingView or ICT Archivist, and no source listed here endorses this article, the Inner Circle Trader material or any setup. Equilibrium, consequent encroachment, liquidity, fair value gap and premium or discount are used here as descriptive study terms. Nothing on this page demonstrates a tested, repeatable or profitable result.