
Key takeaways
ICT reviews the 1 September 2022 morning and afternoon sessions in the September E-mini S&P 500 futures contract across daily, fifteen-minute, five-minute and one-minute charts.
Read the full summary
ICT reviews the 1 September 2022 morning and afternoon sessions in the September E-mini S&P 500 futures contract across daily, fifteen-minute, five-minute and one-minute charts. He says price swept sell-side liquidity below an audio-rendered 3913.25 level, reversed into a fair value gap and later ran higher after a fifteen-minute buy-side sweep and move into an order block. In the morning he reports two short entries, partial exits at successive lower lows and a final exit below 3913.25. Around the noon-to-one New York lunch hour, a resting limit order filled earlier than intended while he was away, he added to the long, then exited near cost because relative equal lows could be taken, calling the premature entry an ICT human error and warning against placing resting orders at lunch. In the afternoon he describes price reaching the audio-rendered 3922.25 daily fair value gap high, producing displacement and a short-term market-structure break, then offering a long on a retracement into a one-minute fair value gap with a stop below the referenced low and partial exits during the rally. He also highlights the three thirty-three to three forty-five market-on-close algorithm window and a move into a fifteen-minute bearish order block to the tick. The recording is a same-day recap rather than a forecast, runs about 17 minutes 9 seconds, and provides no account figures, statistics or independently verified performance, while all quoted levels come from his spoken chart narration.
How we researched this article
BestProps used document-based research from primary firm sources, checked September 25, 2026. The complete source list, scope, limitations, and commercial-state record appear near the end of this article.
In ICT Emini S&P500 AM & PM Session Review – 09/01/22, he opens by saying he will keep it as brief as he can, and goes straight to the daily chart of the September contract 0:06, 0:11. The watch page lists an upload of 1 September 2022 with a duration of 1,029 seconds, against a transcribed audio duration of 1,028.8 seconds. This is a recap of that same session, not a forecast.
ICT Emini Daily Session Context
His first two marks are a small gap beneath a low on the daily chart, and the area he says he had already named as a likely target 0:21, 0:27. He states that he made a public record of an objective he renders as 4080 together with the previous week’s low, and tells viewers to go and find that record on his social feed themselves 0:32, 0:42, 0:48.
He then narrates the day itself: the market opened, traded down, cleared what he calls the sell side of the quarter, and repriced, closing back in a fair value gap 0:56, 1:01, 1:04. He ties that to the gap he marked at the start, describing the range between a high and a low and saying the sell side offered it that day 1:08, 1:10, 1:12, 1:15, 1:18. The low he returns to is the level the audio renders as 39.13 and a quarter, which he says was the level mentioned in the morning session recording and which he later draws as an orange line on the chart 1:24, 1:25, 1:41.
What matters to him about that low is what comes next. He says price trading back up into that area once more is important going forward, and that it may be an interesting draw on the quarter into the following week, while adding that he does not think a run at it sooner looks likely 1:47, 1:57, 2:03. He then walks the decline in order: the market dropped, created a small consolidation with relative equal lows, found support at the old fair value gap high, broke lower beneath the level the audio renders as 39.0950, which he calls the low of the daily gap, cleared his 39.13 and a quarter level, and became a reversal day with a run on the high 2:17, 2:22, 2:27, 2:33, 2:37, 2:47.
ICT Emini Session Range and Liquidity Sweep
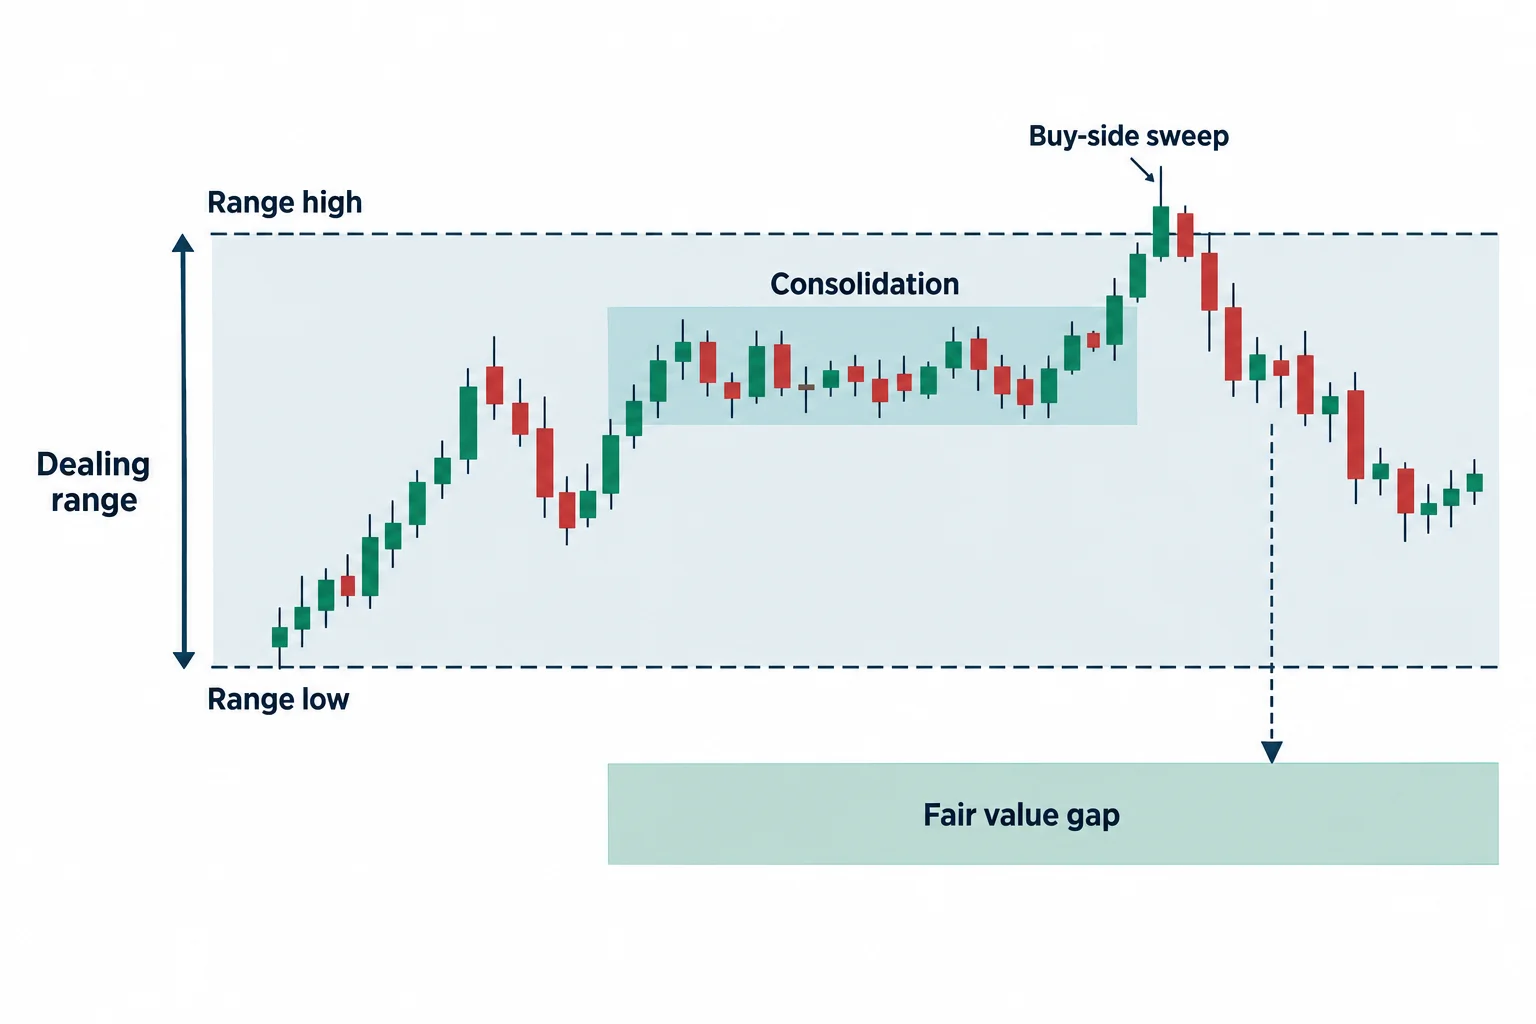
On the fifteen-minute chart he marks an order block, the dealing range from the high to the low of that timeframe, and a consolidation that price broke above, clearing the buy side 2:47, 2:55. He identifies the area below as what he calls the institutional order flow entry drill, a term he says viewers will learn about, and then has the market drop and close in the fair value gap and below his 39.13 and a quarter level 3:03, 3:07.
He then narrates the same decline in miniature: price consolidates once more, the lunch hour passes, price breaks lower again straight into the order block, rallies back into a fair value gap, accumulates again at the high of the daily gap that the audio renders as 39 22 and a quarter, and then rallies into the older area and above a high there, clearing a level he renders as 50 3:18, 3:25, 3:31, 3:38, 3:47, 3:50, 3:54. He says that was it for the day, and that he was not able to trade the three o’clock setup because he had something to take care of later in the afternoon 3:58.
The setup he could not take is one he dwells on briefly. He describes price trading right into the order block, and answers the obvious question about precision: he points out that there was a wick on the candle, and says that when there is a wick it draws your eye to the body of the candle, which is why he describes the delivery as precise 3:50, 3:58, 4:07. He then notes the afternoon session’s two highs, which the audio renders as the 39-38 level and the 39-29 and a half level, and says every other level was one already marked from the morning 4:10, 4:14, 4:24.
ICT Emini Morning Session Trades
On the five-minute chart he marks a swing low and explains why he chose it over an earlier one, describing the sweep into it as something a trader can be aggressive with 4:36, 4:40, 4:44. From there he marks a short-term low, says that is where the market-structure shift occurs, and notes a trade back into it that he says he could not take because he was not in front of his charts and was waiting for the 9:30 opening 4:56, 5:00, 5:02, 5:04, 5:09.
He says he felt price had reached the point where it should have moved lower, and that the next candle carried the ten o’clock news, which put a little heat on the idea but not much 5:21, 5:26. The high should stay intact in his reading, he says, because there was a swing high there and because there had been a lot of movement lower with plenty of liquidity beneath it, including the daily low he draws in orange 5:32, 5:40, 5:48, 5:56. He says he did not have those levels outlined on the chart he is showing and was drawing attention to them from his other timeframes, and that he had mentioned them in passing on his social feed when someone asked how he came up with a bias: sell side below, inside the fair value gap 5:59, 6:03.
He reports selling short and then selling short once more, and he is specific that the second entry was not at the highest high but lower in the candle 6:10, 6:15. He says he took a partial as price drew down below the lows, then another partial, and then, when price went below his 39.13 and a quarter level, closed the final portion just before the run-up that follows in the recording 6:21, 6:34, 6:44.
ICT Emini Session Liquidity After the News
He returns to the high he had shown earlier and asks the viewer what they see, then answers his own question: that high was a draw on liquidity, and once the levels inside it have been closed in and market structure shifts, the market is going to want to come back up to that level 6:29, 6:34, 6:40. He describes price as having gone below the fair value gap and below the old low, which he calls the intraday version of that idea 6:50, 6:54.
He identifies three swing highs in a row as the intermediate-term price high, has the market break lower after the news, and says the imbalance in that move is what makes it an intermediate-term high 6:58, 7:04, 7:19. The return back into that area is a setup he says he did not take, and he points to his own recording of the session as the evidence that price went right into it and tapped the fair value gap high again 7:26, 7:31.
He calls that behaviour algorithmic rather than harmonic or supply and demand, and describes the sequence as a small retracement up, a larger block formed by the last two up-close candles, and a sell-off that trades below the lows 7:39, 7:45, 7:50. He then turns to the lunch hour and says he had to step away from his charts ahead of it 8:02.
ICT Emini Premature Lunch Entry
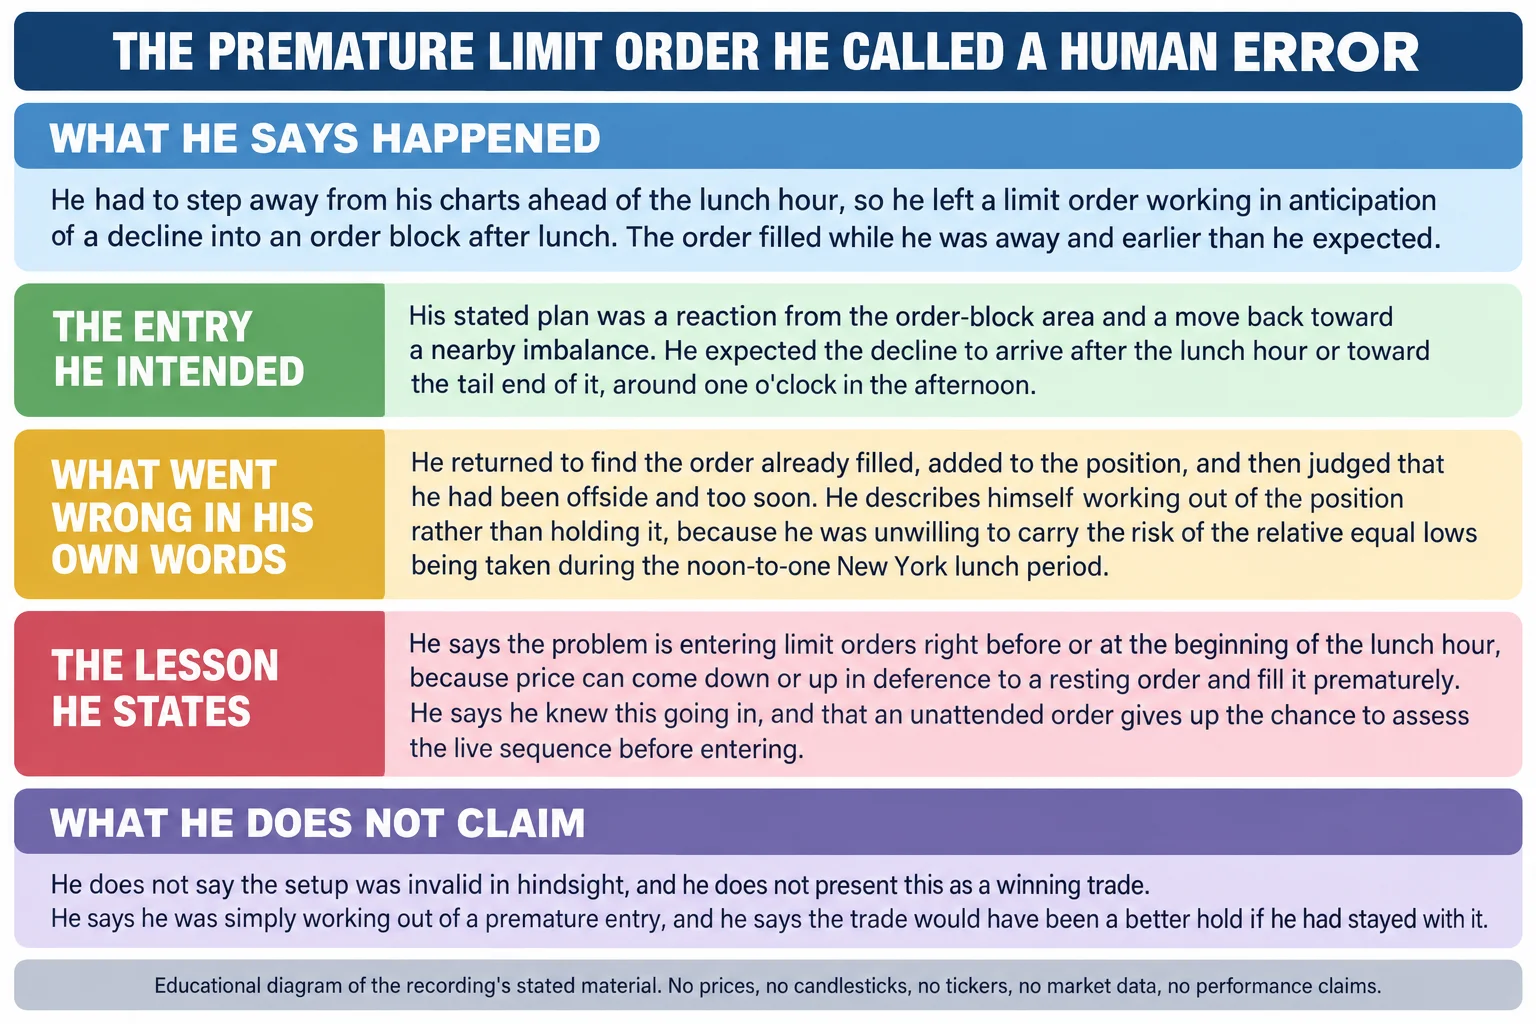
He explains what he had been thinking while price was still up at the highs. If it dropped into the area he had marked, that would probably happen after lunch or toward the tail end of it, around one o’clock in the afternoon, and if he were in front of the charts he would obviously do something differently, but he did not want to miss it because he wanted to show something related to that high 8:08, 8:12, 8:26, 8:32.
The order filled while he was away. On returning he saw it as potentially offering another opportunity, bought more of it, and planned an exit, on the reasoning that two lows below would hold 8:39, 8:45. When price dropped into the order block he bought once more and then realized he was already offside and had been too soon: the low he thought would hold was also the low end of the daily fair value gap 8:45, 8:55, 9:06.
He calls it a premature entry that he then tried to finesse, on the plan that if price could pop back into the area he would move to the sidelines, wait for the relative equal lows to be taken, and take the trade later in the afternoon 9:10, 9:15. He says he got out, and that the point is that the limit order filled too soon 9:21, 9:28.
The lesson he states is about the timing of resting orders rather than about direction. He says the problem is entering limit orders right before or at the beginning of the lunch hour, noon to one New York local time, because price can come down or up in deference to a resting order and fill you prematurely 9:34, 9:43. He adds that he knew this going in, that he simply could not be in front of the charts at the time, and that what followed was him working out of a premature entry rather than expressing a view 9:51, 9:54, 10:03.
He also gives the more granular version. Zoomed in, he shows the fair value gap and the candle the order filled on as price dropped into the midpoint between two levels, and says he was looking to go long on the move back into that gap 10:18, 10:23. He says the retracement went further than he wanted, that he did not need price to reach the gap above and only wanted it close enough to a high that everything he had on would have covered costs with a little left over, and that he closed it on the following candle and was content with it 10:31, 10:39, 10:43, 10:56.
He then concedes that with hindsight it would have been a better hold, and repeats that the timing was the problem because he had to work himself out of it in the first minutes of the lunch hour 11:23, 11:28. He also explains the specific risk that made him unwilling to hold: after the shift in market structure price broke lower into another fair value gap, the levels from the daily chart had been transposed onto the one-minute chart, and a low with a lower low meant stops had already been run down there in a deep discount below the gap low and below the old low 11:42, 11:48, 11:52, 11:56.
That, he says, is exactly what he was afraid of: those lows being taken, and the possibility that price could go deeper and blow out the earlier low 12:10, 12:19. His stated reason for not holding is therefore the lunch hour itself, with the whole hour between noon and one ahead of him 12:34, 12:39. He notes what happened at one o’clock: the market traded higher into a fair value gap and up to the level the audio renders as 39 38, where he says buy-side liquidity was resting 12:55, 13:04, 13:10.
ICT Emini Afternoon Session Sequence
He opens the afternoon section by taking the market down into the level he renders as 39 22 and a quarter, which he identifies as the high of the daily fair value gap 13:10, 13:14. What follows in his account is displacement, a broken short-term swing high, a return down into a fair value gap, a long entry, and a stop placed below the low he had referenced 13:19, 13:21, 13:24, 13:27. He says he saw no reason to think price would go below that stop, and that if it did he would simply wait for another entry 13:34, 13:37.
He then describes the market rallying, says he will take a partial and another partial, and points viewers to the short vignette of the session where he says you can see that actually occurring 13:42, 13:43, 13:48. After that he narrates price dropping back into a small fair value gap, rallying, and consolidating around a level the audio renders as 39.47 and three quarters, which he says was visible on the hourly and fifteen-minute charts 13:50, 13:55, 14:00.
One later setup he describes as a little muddy in his opinion: price overshot the gap without quite going below it, and although he says he would have been interested in taking a trade on that gap, he did not 14:05, 14:09, 14:12. He notes that a short-term shift in market structure formed there too, with a fair value gap dropping in 14:12, 14:23.
For the last hour he marks the window the audio renders as three thirty-three to three forty-five, which he associates with what he calls the market-on-close algorithm 14:26, 14:34. In his account price trades into it once more, turns, and accelerates into a fifteen-minute bearish order block, which he says it reached to the tick, and then settles into a sloppy little range between a high and a low 14:47, 14:53, 14:58.
ICT Emini Session Review Scope and Limits
He closes by explaining why he wants to change how he publishes these reviews. He says he does not want the combined morning-and-afternoon videos to stay this long, that he has floated the idea on his social feed and asked for a thumbs-up on the video if viewers support it, and that he is aiming for something closer to five minutes per session on a consistent format so viewers know what to expect and can test themselves against his notes 15:04, 15:25, 16:19, 16:33.
He also draws a line around what the reviews will contain. He says he has been publishing mentorship core content so viewers have the prerequisite language, that this frees him to speak more openly on YouTube, and that he is not going to go into every detail and every facet of what he calls the algorithm because he does not consider it necessary 15:40, 15:47, 16:05. The tail of the recording is a sign-off this review cannot render reliably: the automatic transcript produces words that do not form a coherent closing statement, so nothing has been reconstructed from it 16:59, 17:05.
How to Read the ICT Emini Session Review
The recording mixes three different kinds of statement, and they do not carry the same weight:
- Reported actions are his account, not verified records. The two shorts, the partials, the lunch-hour limit order and the afternoon long are described by him in the recording. No statements, fills, sizes or account figures appear, and the transcript cannot confirm any of it 6:10.
- Chart levels are speech, not inspected data. Every level on this page is the automatic transcription of his narration, including the daily objective, the level he renders as 39.13 and a quarter, the afternoon high he renders as 39 22 and a quarter, and the closing level he renders as 39.47 and three quarters 2:27, 13:10.
- His framework claims are attributed. That a level closed in earlier becomes a draw on liquidity, and that the closing window is driven by what he calls a market-on-close algorithm, are his interpretations. The recording offers no statistics, no sample and no documentation for either 6:40, 14:34.
- He does not present the day as a template. He separates the setups he took from the one he did not, and he treats the premature entry as a mistake rather than a lesson in timing 9:21, 14:12.
- Directional language is his, not advice. Statements about where price should have gone and what it was likely to do are his same-day reading of one session. Nothing here is a recommendation or a claim of profitability.
Watch the ICT Emini Session Recording
ICT Emini S&P500 AM & PM Session Review – 09/01/22
The Inner Circle Trader · watch page lists upload 1 September 2022 · 1,029 seconds, about 17 minutes 9 seconds. The recording is a same-day recap of the 1 September 2022 morning and afternoon sessions in the September E-mini S&P futures contract, and it is the primary source for every timestamp link on this page.
The recording is not embedded here. An embedded player was tested directly on 15 September 2026 from a BestProps page origin at desktop and mobile widths: the frame loads and then reports “Playback on other websites has been disabled by the video owner”, with no duration and no playback progress, while the video itself is publicly playable on YouTube. The oEmbed endpoint answers 401 Unauthorized for this video for the same reason. No half-working player is left on this page.
The watch page was read on 15 September 2026 and is publicly listed as ICT Emini S&P500 AM & PM Session Review – 09/01/22 by The Inner Circle Trader, not private and not unlisted, with an upload timestamp of 1 September 2022 and a listed duration of 1,029 seconds. The title date, the upload date and the session being reviewed are the same calendar day, and the recording covers both the morning and the afternoon of that session.