
Key takeaways
ICT Charter Price Action Model 5 is a session-based framework for capturing intraday volatility expansions using a daily-chart liquidity draw, London Open or New York Open timing, session swings and Power of Three rather than targeting a full daily or weekly range.
Read the full summary
ICT Charter Price Action Model 5 is a session-based framework for capturing intraday volatility expansions using a daily-chart liquidity draw, London Open or New York Open timing, session swings and Power of Three rather than targeting a full daily or weekly range. ICT prefers Monday, Tuesday or Wednesday and seeks bullish moves toward equal highs, buy-stop liquidity or rejection blocks and bearish moves toward equal lows, sell-stop liquidity or other downside references, without requiring the daily candle to close in the trade direction. Standard-deviation projections use a clear 4 p.m. to 8 p.m. New York Central Bank Dealers Range above 15 pips, a range-bound 8 p.m. to midnight Asian range of at least 20 pips but preferably no more than 40 pips, or the 4 p.m. to midnight alternative “flout” range projected in 50% increments when neither qualifies, with measurements kept on a 15-minute chart. Prior days’ projection levels remain plotted so old and new clusters can be combined with higher-time-frame liquidity, intraday or prior-day highs and lows, London, New York or London Close timing and a separate plug-and-play entry such as optimal trade entry, Turtle Soup, fair value gaps, breakers, order blocks or positioning around an opening price. ICT recommends one chart template, adding each qualifying day’s levels and reviewing session-window turning points, but the methodology is presented as ICT’s interpretation rather than independently verified evidence of profitability.
How we researched this article
BestProps used document-based research from primary firm sources, checked September 24, 2026. The complete source list, scope, limitations, and commercial-state record appear near the end of this article.
In ICT Charter Price Action Model 5 \ Day Trading – Intraday Volatility Expansions, a 55-minute-28-second upload from the Inner Circle Trader, ICT sets out the day-trading model that accompanies the fifth of his charter price action models. All of it is his own framing of how he reads a market, not an independently established forecasting method.
The architecture is stated in the first minute. At 0:32 he describes the stage as higher-time-frame liquidity draws, which he says means focusing on a directional bias; at 0:42 the setup is intraday volatility expansions; and at 0:45 the pattern is session swings using power of three. Those three labels describe the roles each part plays rather than a sequence of guarantees.
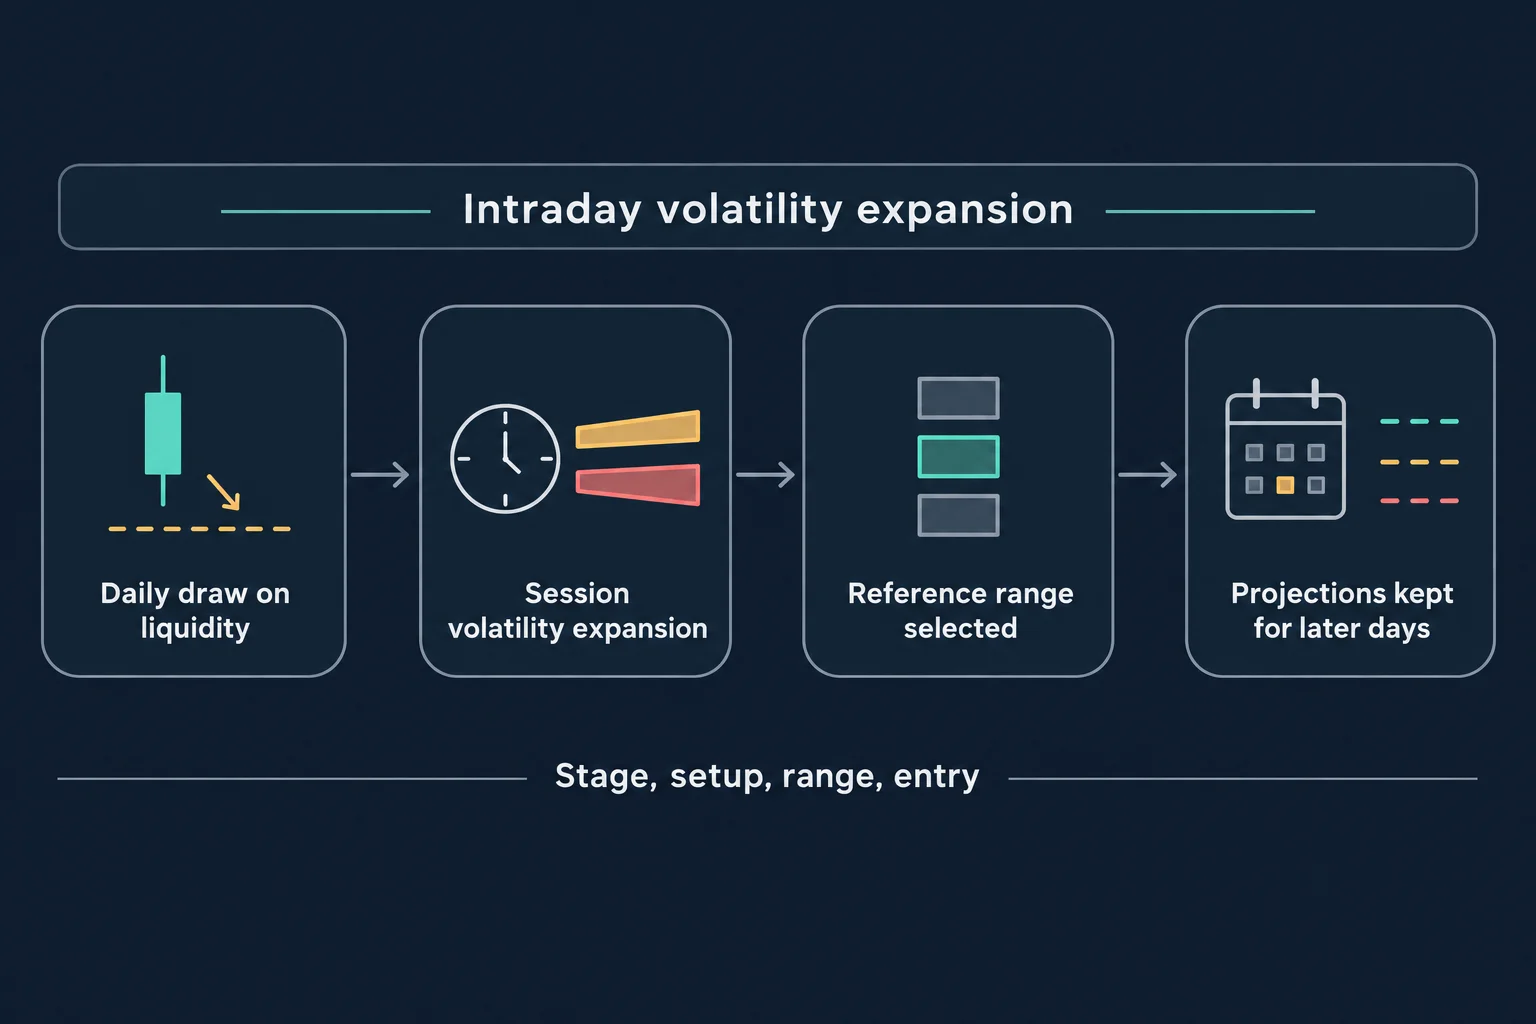
How ICT Price Action Model 5 Captures Intraday Volatility
The scope is deliberately narrower than a swing trade. At 2:25 he says the model is not about trading the daily range in its entirety or the whole weekly range, and at 5:44 he puts it plainly: he is looking for a move in London or a move in New York. The stated preference at 3:28 is to trade it on Monday, Tuesday or Wednesday, though he does not define the model itself as day-specific.
ICT Model Direction Sessions and Intraday Trade Objectives
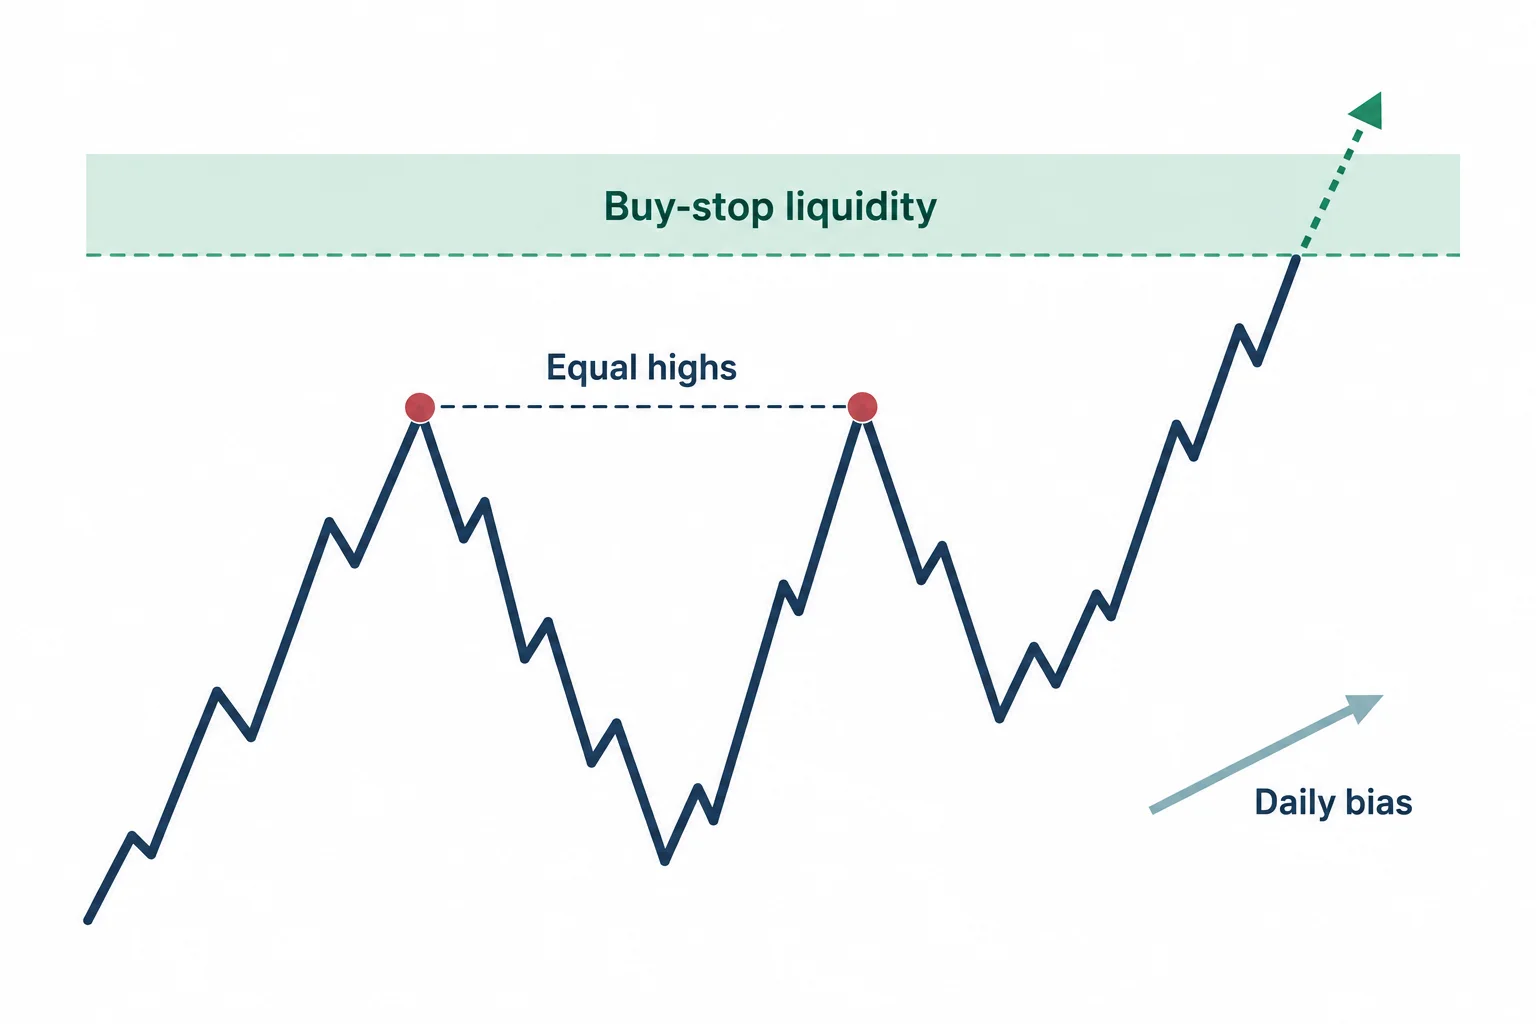
Direction comes from the daily chart. At 12:59 he says the daily chart highlights the most probable draw on liquidity, which supplies the bias, and he expects daily ranges to expand in that same direction (13:17). The premise is a direction to trade in, not a level that must be reached that day.
The liquidity references are described for both directions. For a bullish scenario he looks for expansion toward an overhead reference – stated at 11:18 as a rejection block above market price, a buy-stop liquidity pool, or equal highs on the daily – and he notes at 11:26 that those equal highs may also be intraday or intraweek. The bullish scenario itself opens at 10:28, where he treats the session range as the frame for the anticipated expansion (11:08). The bearish case reverses it: he identifies a rejection block on equal lows with a sell-stop pool resting beneath it, and describes having watched those equal lows for months as a pool of sell stops (6:10 and 6:31).
Why the Daily Close Does Not Define the Intraday Trade
One passage is easy to misread, so it is worth quoting closely. At 13:22 he says that when the draw lies below current price the daily range will tend to open near its high and close near its low – but then at 13:36 he states that because this is session trading inside intraday price action, the daily close is not required to be down on a closing basis to find setups. He repeats at 14:24 that the close does not have to be below the open or near the low, then reverses the whole statement for the bullish case.
What he is asking for instead is expansion in the anticipated direction during the session, traded as an intraday move rather than held for the daily range (14:10). A market can expand downward through London or New York and later retrace without that session expansion having failed to occur.
Choosing the Intraday Price Range for Volatility Projections
The largest single section of the lesson is a decision sequence for picking which range to project standard deviations from. He gives three options with explicit qualifying conditions.
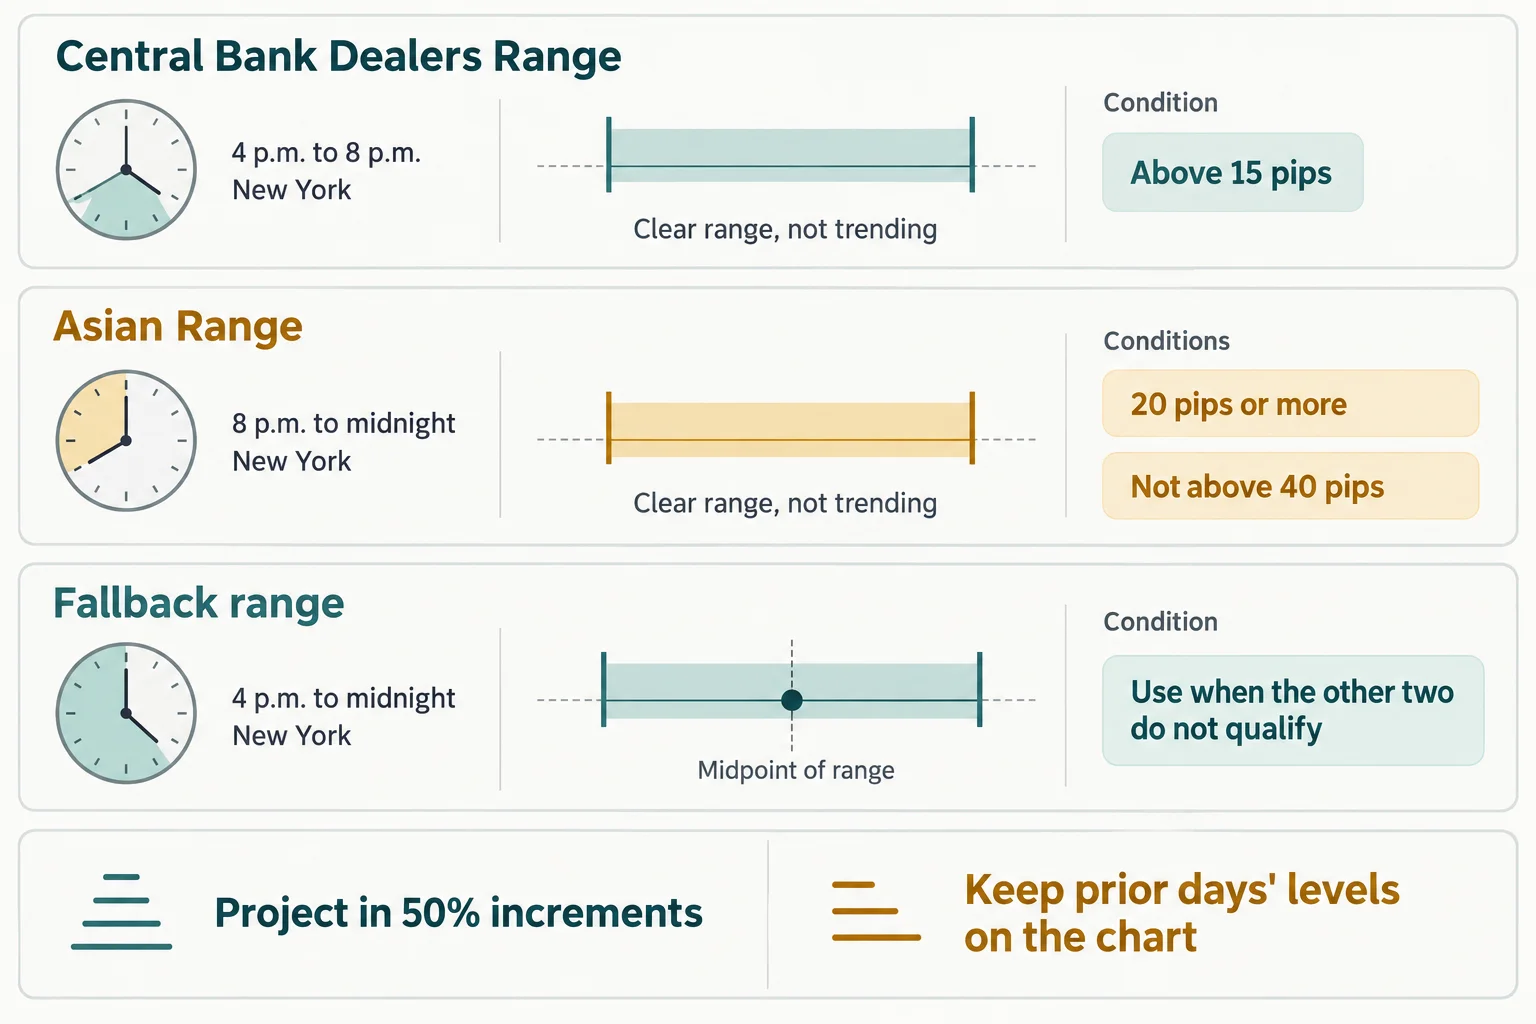
- Central bank dealers range. The ideal case is when the window from 4 p.m. to 8 p.m. New York time forms a clear, discernible trading range rather than a trend. If that window is expanding or trending instead, he says it is probably not a good range to use (15:54 and 16:36). The threshold is stated at 16:47: below 15 pips, do not use it.
- Asian range. The same logic applies to the 8 p.m. to midnight New York window – it should be a clear range rather than a trend (16:58). The minimum is 20 pips or more, and he adds that he does not like to use it above 40 pips (17:27 and 17:36).
- The fallback range. When neither of the above is favourable, he uses the range from 4 p.m. New York time to midnight New York time, with no pip limit, and expands it in multiples of 50% increments (18:03 and 18:16). He refers to this one by a name the automatic transcript renders as “flout”, and at 38:01 describes its span as the “20 to 4” relative times.
A naming caveat belongs here. The term rendered as “flout” recurs throughout the lesson, and at 38:36 the captions render the same name as “FLOW”. What can be established from the audio is the window it covers and the 50% expansion rule quoted above. What cannot be established is the term itself or whether “flout” is a recognition error, so the name is carried as the transcript gives it rather than expanded or guessed at. He also declines to re-teach it, pointing viewers back to his separate mentorship material at 18:30.
Two further preferences are stated as habits rather than results. He keeps these measurements on a 15-minute chart for consistency (26:40), and he measures the ranges on both candle wicks and bodies. Neither carries a supporting comparison in the lesson.
Retaining Prior Day Price Projections in the ICT Model
The distinctive instruction is to preserve the levels rather than recompute them. He says to leave previous days’ standard-deviation levels on the chart and watch for clusters between the older and newer projections, then combine an overlap with a liquidity premise, an intraday or prior-day high or low, and a session window (37:12). The worked walkthrough moves Tuesday through Thursday, and when Wednesday’s dealer range comes in under 15 pips he discards it and says the rules do not permit using it even though he has plotted what its third deviation would have been (37:13 and 37:31). Because the Asian range also fails that day, he switches to the fallback range and compares its projections against Tuesday’s retained levels (37:52).
He then reads the week’s turning points as coinciding with those overlaps. At 39:38 he walks a level near 132.06 he identifies as a previous old low, describes a first hit, a retracement and then a run higher to a third standard deviation, and calls that run a turtle soup sell – with the entry idea being to sell the New York session overlap into the London close (39:55 and 40:00). At 42:38 he blends time of day with the deviations and liquidity, and at 42:51 points out that every shaded area on his chart is a specific kill zone – a New York kill zone, a London open kill zone and a London close profit-taking kill zone. At 52:36 he reads a sell-off through double lows formed on 19 and 20 June as a sweep designed to put traders short, below the same 132.06 level.
None of those visual alignments can be checked from a transcript. The recording shows one annotated historical week interpreted after the fact; it cannot establish the prices, the entries, the exits or what followed.
ICT Intraday Trade Entries Stay Modular
The model does not mandate a trigger. At 20:01 he says he is taking liberty in assuming the viewer knows how to select an entry pattern, and at 20:19 lists the options as optimal trade entry, turtle soup, fair value gaps, breakers, order blocks, and trading above or below the opening price – the last of which he calls plug and play (20:33). That makes Model 5 a context-and-objective framework in which the trigger is a separate decision, not a self-contained signal.
Applying the ICT Intraday Volatility Expansion Model
Four decisions are kept separate throughout: the broader directional premise, the session to trade, the projections derived from a consistently chosen range, and the entry pattern. He closes by asking viewers to run one chart template, add each qualifying day’s levels, and review turning points around the designated session windows (53:51).
What is absent is any evidence of results. Across 55 minutes there is no win rate, no sample size, no backtest output, no drawdown profile and no account statement, and no trade in the walkthrough is identified as a real-money fill. The pip thresholds – 15 pips, 20 pips, 40 pips – are his stated qualifying rules, and the levels, clusters and turning points are his readings of a chart he was annotating.
One limit is specific to this article’s source. The transcript used here is a local automatic speech recognition of the recording’s complete audio, not human-checked captions. It renders the fallback range’s name inconsistently as “flout” and “FLOW”, turns “buy stop” into “buy stock” and “sell stop” into “sell stock”, and writes the level near 132.06 as “13206”. Where a term could not be resolved from context it is flagged rather than normalized, and the video’s charts were not reviewed while writing. Every price, pip distance and chart reading is reported as something the speaker said.
Watch the original recording
The embed above is the upload’s own YouTube player and it is left in place because it plays. This exact iframe markup was loaded from a BestProps origin on 15 September 2026 and clicked: playback advanced to 5.8 seconds of the recording’s own 3327.8-second duration with no error notice and no owner restriction reported by the player, and the watch page reports the video as playable in an embed. All timestamp links in this article point into the same recording.
Source and further reading
- ICT Charter Price Action Model 5 \ Day Trading – Intraday Volatility Expansions – the recording itself. Watch page read 15 September 2026: about 118,800 views, 55 minutes 28 seconds, published 15 January 2024 at 3:35 p.m. Pacific (15 January 2024 23:35 UTC), playability status OK.[1]
- The Inner Circle Trader – the publishing channel’s own page, and the first-party record of what it uploads and when. It takes precedence over any reupload, mirror or third-party archive of the same lesson.[2]
- CFTC fraud advisory – commodity trading systems sold on the internet – the U.S. derivatives regulator’s warning that hypothetical results assume fills at specific prices, that stop orders may execute at a worse price or not at all, and that commissions raise the break-even point. Relevant to a walkthrough built on annotated historical charts.[3]
- CFTC Learn & Protect – forex frauds – the regulator’s statement that most retail foreign exchange traders lose money and that past results do not guarantee future success.[4]
- 17 CFR 4.41 – advertising by commodity pool operators and trading advisors – the rule governing hypothetical performance presentation, cited because the lesson’s examples are annotated chart walkthroughs rather than audited outcomes.[5]
- Investor.gov – leverage – the SEC investor-education page explaining how leverage magnifies both gains and losses, since a pip threshold means nothing without the position size and margin behind it.[6]
Any ICT, smart-money or third-party indicator, script, spreadsheet, note set, transcript or social-media summary circulating outside the publishing channel’s own upload page is unofficial and untested here. Liquidity draw, rejection block, power of three, kill zone, turtle soup, optimal trade entry and standard-deviation projection are the speaker’s own vocabulary; this article reports his usage of them not as verified market mechanics.
- [1] ICT Charter Price Action Model 5 \ Day Trading – Intraday Volatility Expansions – The Inner Circle Trader (watch page read 15 September 2026)
- [2] The Inner Circle Trader – official YouTube channel
- [3] CFTC – Beware of fraudulent trading systems (read 15 September 2026)
- [4] CFTC Learn & Protect – Forex Frauds (read 15 September 2026)
- [5] 17 CFR 4.41 – Advertising by commodity pool operators and trading advisors (read 15 September 2026)
- [6] Investor.gov – Leverage (read 15 September 2026)
This is independent educational commentary on one speaker’s framework. It is not official ICT material, it is not a tested trading system, and it is not investment advice or a promise that the approach will produce profits. Leveraged trading involves substantial risk and is not suitable for everyone.