
Key takeaways
ICT Charter Price Action Model 4 is Inner Circle Trader’s quarterly-shift position-trading framework, presented in a 37 minutes 8 seconds video, targeting moves lasting about two months or longer and at least 500 pips.
Read the full summary
ICT Charter Price Action Model 4 is Inner Circle Trader’s quarterly-shift position-trading framework, presented in a 37 minutes 8 seconds video, targeting moves lasting about two months or longer and at least 500 pips. Preparation starts with medium- and high-impact economic events, monthly and weekly bias, seasonality, CFTC Commitments of Traders positioning, and rolling 20-, 40- and 60-trading-day dealing ranges from highest high to lowest low with Sundays excluded. Bearish entries use a four-hour premium fair value gap at no more than plus three standard deviations, while bullish entries use a four-hour discount gap at no more than negative three, with London or New York open timing, European opening price filters, and either a 15-minute institutional order-flow pattern or stop order. Targets include old daily or weekly liquidity and fair value gaps offering at least 500 pips, with demo-account exits at 100, 250 and 500 pips, 80% of remaining exposure closed at 500 pips and 20% left to run. Stops sit 25 pips beyond the reference swing and are reduced by 25% at one-quarter of the objective, 50% halfway through, and moved to breakeven at three-quarters. ICT prefers starting risk near 1% rather than 1.5%, halves risk after a full-risk loss until half the loss is recovered, halves it again after another loss, and also halves risk after five consecutive wins. The retrospective EUR/USD example uses barchart.com charts and a six-month commercial-positioning program, reporting seven-to-one reward-to-risk and roughly 14% return at 2% risk, but it is an annotated paper trade, not a verified fill, and ICT explicitly says seasonality can fail, stops can be exceeded by gaps, and over-leverage should be avoided.
How we researched this article
BestProps used document-based research from primary firm sources, checked September 24, 2026. The complete source list, scope, limitations, and commercial-state record appear near the end of this article.
What the ICT Model 4 Trade Plan Does
In ICT Charter Price Action Model 4: Trade Plan & Algorithmic Theory, a 37-minute-8-second upload from the Inner Circle Trader published 11 January 2024, ICT lays out the position-trading plan that accompanies the fourth of his charter price action models. He opens by stating the target: Model 4 aims at 500 pips or more per trade (0:09; 0:33). It is his framework for reading a market, not an independently established forecasting method, and no result in the recording is identified as a verified real-money fill.
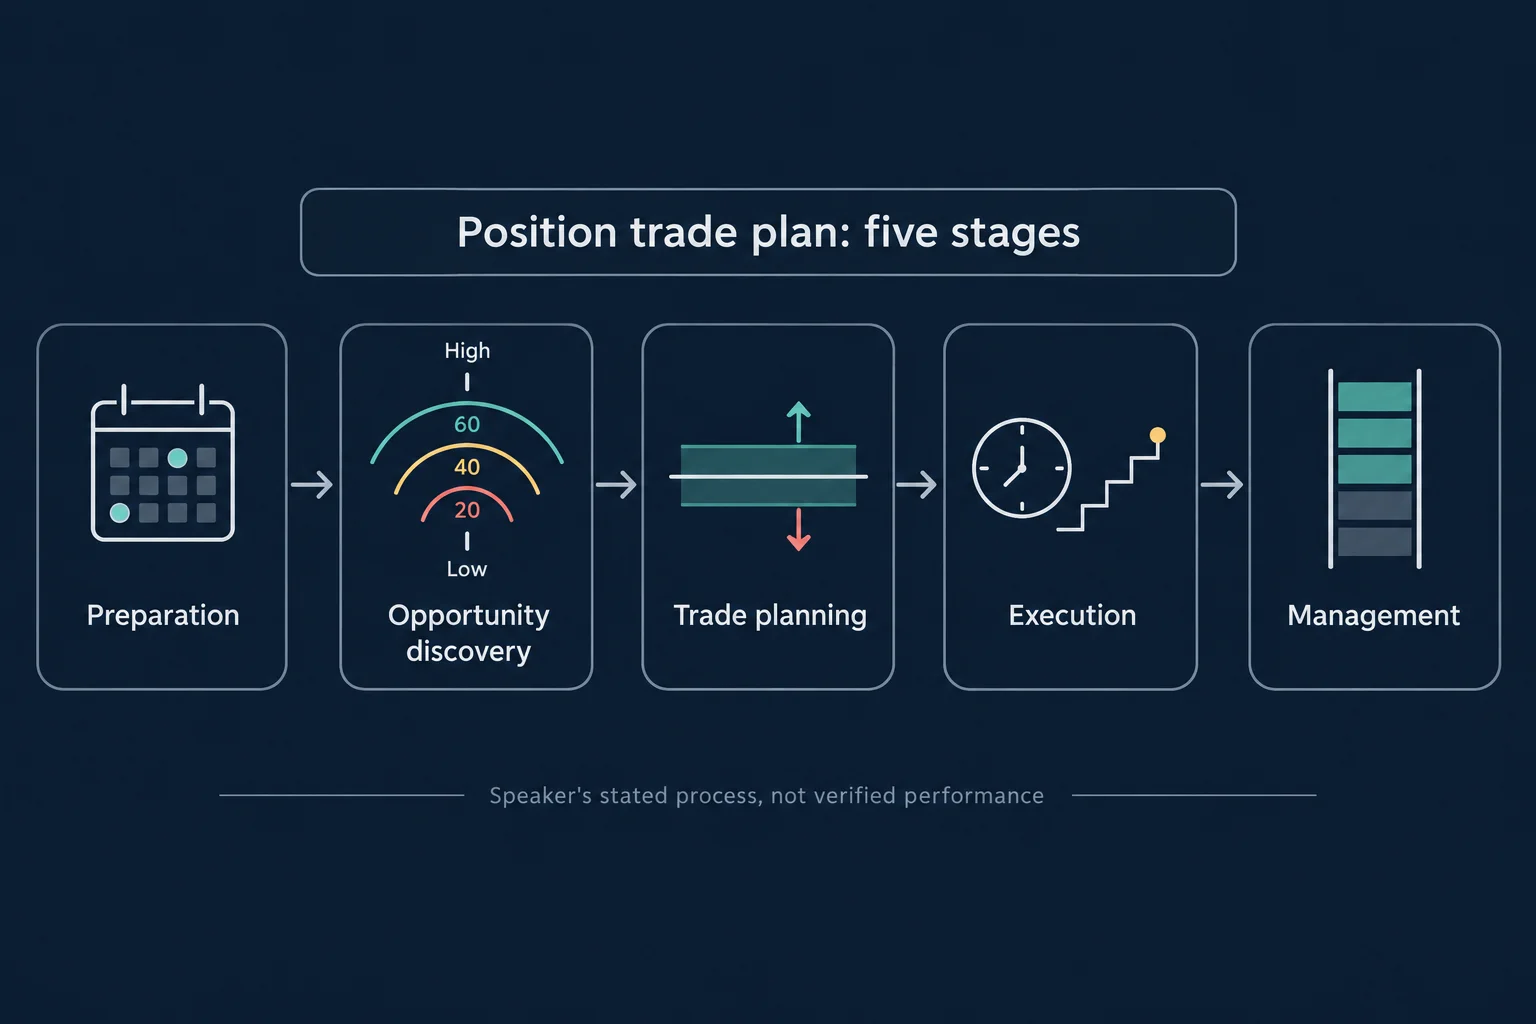
The architecture is the same five-stage sequence he says he has walked through three times before, and it is worth naming because the rest of the lesson is hung on it: preparation, opportunity discovery, trade planning, trade execution, trade management (0:37; 0:48). He adds that the shorter-term swing, short-term and intraday models he has already published can be plugged into this higher-time-frame plan, and that the twelve models are meant to be interwoven rather than used in isolation (1:50; 2:45).
ICT Trade Plan Preparation With the Economic Calendar
Preparation still begins with the coming week’s economic calendar. He notes every medium- and high-impact event for the markets a trader follows and considers how those events might combine with existing market structure into a weekly profile (1:02). For this model the frame is primarily the monthly chart and its seasonal tendencies, and he describes the calendar’s volatility injections as a possible smokescreen that facilitates the manipulation he says starts these longer trades (1:21). That is his interpretation of why price moves the way it does, not a mechanism the recording demonstrates.
The second half of preparation is mechanical. He directs students to determine what the automatic transcript renders as the “IPTA” data range over the previous 20, 40 and – for position trading specifically – 60 trading days, counting no Sundays, and then to mark the highest high and the lowest low in each of those three lookbacks (3:00; 3:12). Together those extremes define the current dealing range, and 60 days is as far back as the exercise goes (3:27; 3:43). The recording never expands the acronym – it is heard as “IPTA” at 3:00 and again at 3:39 – so readers who meet the same idea spelled differently in his course material should treat the name as unresolved here rather than assume the transcript settled it.
Inside that dealing range he looks for the next draw on liquidity: an old high, an old low, a fair value gap or a liquidity pool. The stated filter is size. He says the focus is a minimum of 500 pips, which is why the 60-day range is often the one that gets reached for, and he wants a premium array when the monthly bias is bullish or a discount array when it is bearish, aligned with a day and an economic event on the calendar (4:08; 4:18; 4:33).
ICT Model 4 Seasonality Filters and Limits
Seasonal tendencies carry the load in Model 4. His instruction is to review markets and identify their strongest seasonal windows across the calendar year, then, during the Christmas break or the first weeks of January when he says he generally is not trading anyway, plan month by month which market he anticipates moving (5:51; 5:57; 6:15). The relevant seasonals are the ones for the month ahead or the next quarter (7:45).
He is unusually explicit about the limits. At 6:22 he calls a seasonal tendency “just a roadmap. It’s not a panacea”; at 6:52 he says seasonals are useful but “not always perfect or accurate”; and at 6:56 he states plainly that there are many times they are not going to pan out, which is where risk is incurred – the reason the plan carries stops and refuses to over-leverage (7:02). Read in general educational terms, seasonality here is a hypothesis generator: it narrows when a market may deserve attention, and it does not establish what the next move will be. The recording supplies no seasonal dataset, sample period, calculation method or test, so the claim itself is not checkable from this source.
The horizon is then named. At 7:50 he calls the plan “a quarterly shift model,” and at 7:57 says it is designed for moves around two months or longer. The setup he wants is the highest-probability seasonal that could deliver 500 pips or more, framed on the monthly and weekly charts (8:08; 8:19; 8:29).
ICT Trade Bias and Price Array Checklist
A slide sequence walks the directional inputs. He says to identify discount arrays beneath the 20-, 40- and 60-day range when the bias is bearish, and premium arrays inside the range when the Commitment of Traders hedge program is bearish, and to expect monthly range expansion down; the bullish side reverses both (8:46; 8:54; 9:12; 9:19). Two things are worth separating here. First, he leans on commercial positioning from the CFTC’s Commitments of Traders report as a directional input, calling it a “hedge program.” Second, the transcript does not supply enough methodology to reproduce that program – the six-month lookback he mentions later is the only parameter given – and the wording of those four statements is loose enough that it is not resolvable from audio alone whether “inside the range” and “beneath the range” were meant as precisely as they sound. That passage should be read against his slides, not from this transcript.
ICT Trade Entries With Four-Hour Fair Value Gaps
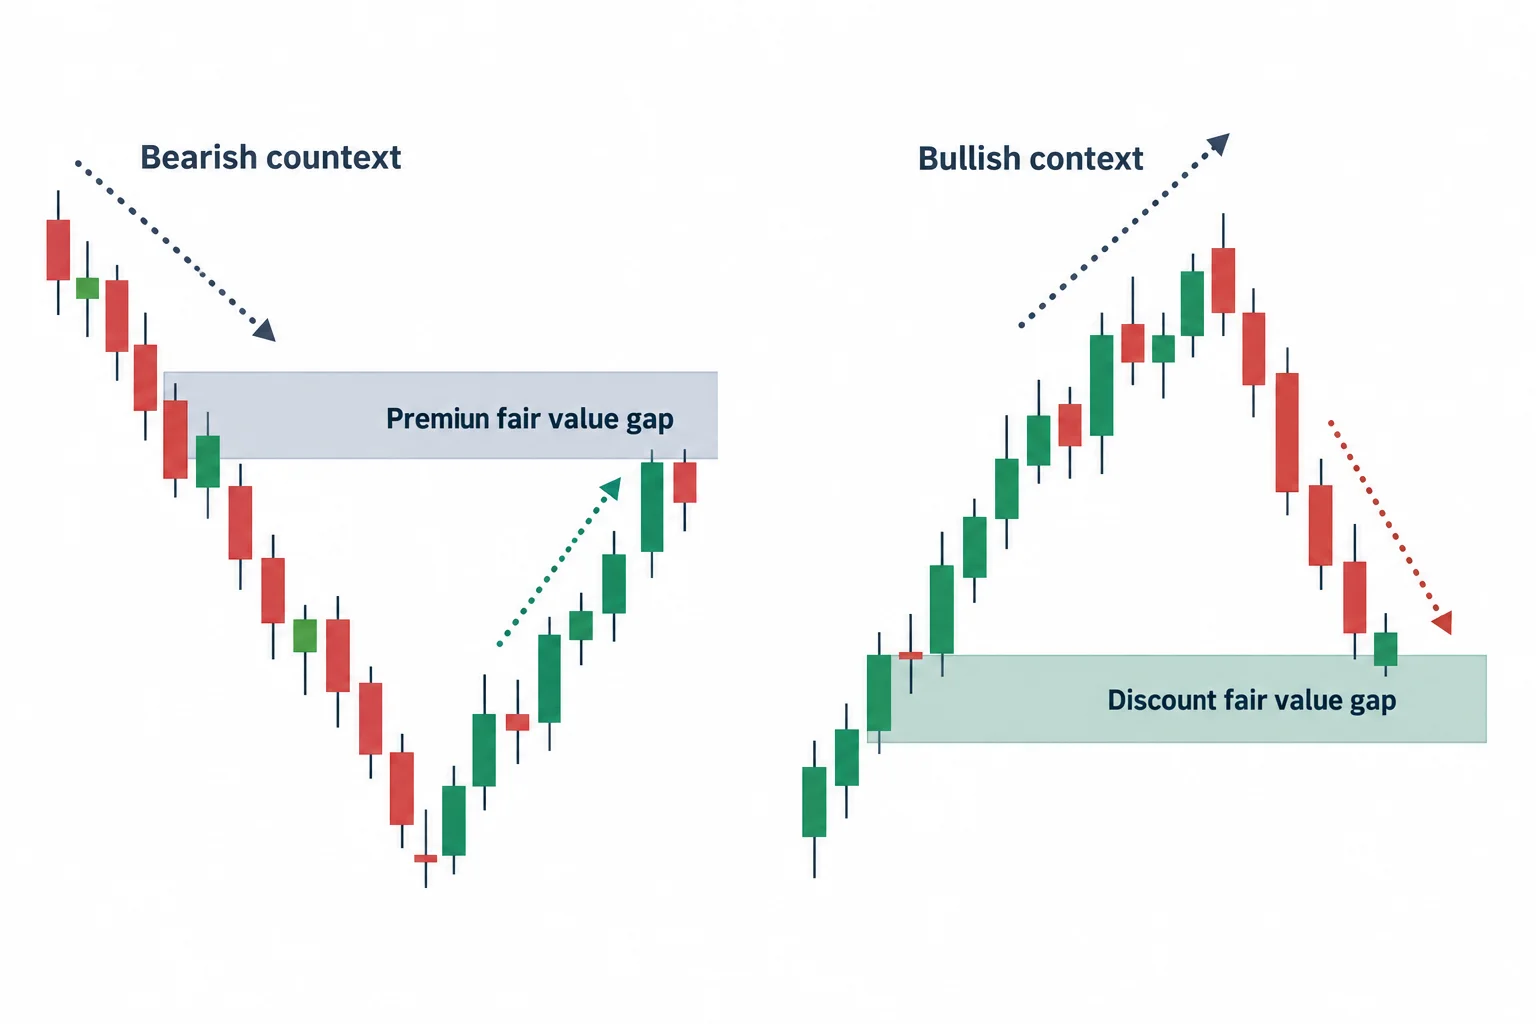
When the market is “primed,” he wants a convergence of manipulation and price moving against his bias at a moment when the calendar suggests a volatility injection (9:34). The general rule is to short premium fair value gaps and buy discount fair value gap setups (9:50). The specific conditions are stated for both directions:
- Bearish entry. Frame a short when price has moved up into a four-hour premium fair value gap that converges with a standard deviation of no more than plus three, during the London or New York open (9:59).
- Bullish entry. Frame a long when price has moved down into a four-hour discount fair value gap that converges with a standard deviation of no more than negative three, during the London or New York open (10:41).
- Bearish objective. Target sell-side liquidity below any old daily or weekly low, or a discount fair value gap inside the 20-, 40- or 60-day range, using the one that frames at least 500 pips as the initial objective (11:07; 11:19; 11:26).
- Bullish objective. Target buy-side liquidity above any old daily or weekly high, or a premium fair value gap inside the same range, again selecting for at least 500 pips (11:38).
He then adds two filters. The first is the European opening price: for longs on Tuesday – and he says the day could just as easily be Monday or Wednesday, because he is describing a window in which the weekly low forms between Monday and Wednesday’s New York open – he filters longs at or below that price where it overlaps the four-hour discount gap; for shorts he uses Monday, Tuesday or Wednesday and filters shorts at or above that price where it overlaps the four-hour premium gap (12:13; 12:20; 13:26; 14:14). The second is an entry trigger: a 15-minute “institutional order flow” entry inside a retracement during the London or New York kill zones, or a stop order – a sell stop into weakness for shorts, a buy stop into strength for longs (13:54; 14:31).
One number in that section should be flagged rather than repeated. At 12:47 he says there is a 70% chance that Tuesday creates the low of the week when the market is bullish. No dataset, sample or test is offered for that figure anywhere in the recording, so it belongs in the category of his claim rather than a measured probability. He also acknowledges the filter can cost a trade: if the Monday attempt is stopped out, he goes back in on Tuesday, and if Tuesday fails and the setup still looks valid, Wednesday is usable (13:00).
ICT Trade Execution and Management Rules
The order mechanics are stated for both directions and are executed, in his words, on a demo account. For shorts he places sell limit orders at the standard-deviation and PD array convergence minus five pips, with every order sharing that entry price; for longs he places buy limit orders at the convergence plus five pips, again with a single shared entry (14:47; 14:54; 16:14; 16:22). The exits are then spread across several orders rather than one position:
- 100 pips on one order, taken as a plain limit exit regardless of how fast price is moving (15:09; 17:06).
- 250 pips on a second order (15:14; 17:17).
- The 500-pip objective on the third, at which point 80% of the remaining exposure across all orders is closed and only 20% of that last portion is left working in case price has more room to run (15:27; 17:29; 17:46).
- A fourth order, if used, is left to run with roughly 400 pips locked in and about 100 pips of open profit exposed (18:24).
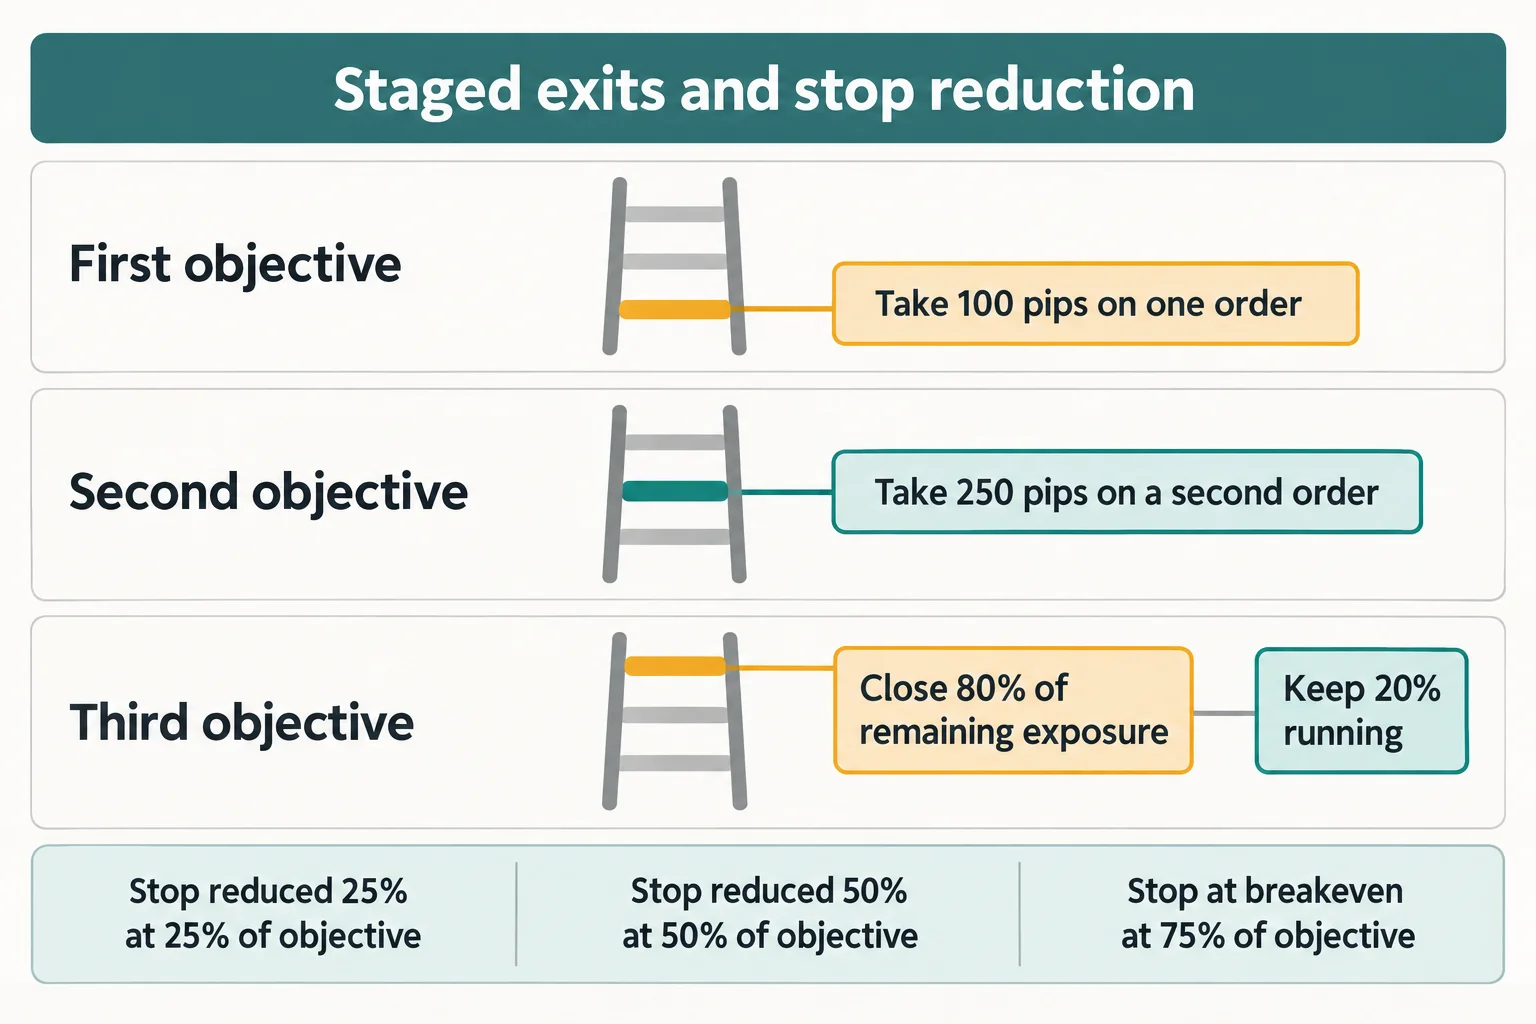
Protective stops are placed beyond the referenced swing by 25 pips – above the high plus 25 for shorts, below the low minus 25 for longs – and he says to re-enter if the trade stops out and to monitor for a secondary entry, because position trades may require multiple attempts (15:58; 18:50; 16:02; 16:07). The stop then ratchets as the trade progresses: reduced by 25% once the position is 25% of the way to its expected objective, by 50% at the halfway point, and moved to breakeven at 75% (19:14; 19:21; 19:27). He gives the reasoning as well: taking partials is how he avoids strangling a trade, while the stop manages the worst case (19:33).
He is also clear about what that cannot do. At 19:48 he warns that markets can gap beyond a stop loss, and that at that point nothing can really save the position. That is the honest limit of any stop-based framework, and it is his own caveat rather than an addition by this article.
Position sizing gets a specific treatment. He notes that the slides being shown were built around a 20-pip stop and that the math has to be redone for the 25-pip stop this model uses (20:10). On the risk percentage he says he personally thinks 1.5% is a little too high for long-term position trading, because a trader does not want to be wrong multiple times at that level, and he prefers to start at 1% (20:32; 20:44). The drawdown rules are stricter than the entry rules: after a loss taken at the full risk percentage, cut the risk by half and stay reduced until the loss is half recovered; if the reduced-risk trade also loses, halve it again; and, less conventionally, halve the risk percentage after five consecutive winning trades (21:07; 21:20; 21:29). His stated purpose is equity levelling and a smoother curve rather than a jagged one (21:34; 21:43).
ICT Algorithmic Theory EUR/USD Trade Walkthrough
The last third of the recording applies the framework retrospectively. He switches to EUR/USD using an interactive chart he says came from barchart.com and his own hedging program built off the Commitments of Traders report, showing commercials only and looking back six months, and reads the trend of that data as bearish foreign currencies and bullish the dollar (22:06; 22:17; 22:21; 22:28; 22:42). He then points to the Eurodollar seasonal study from his own month-five material, which he says shows April tending to make a high and trade down into May, and treats that as confirmation of the directional read (24:01; 24:19). The seasonal PDF itself is not in this recording, so its contents are reported here only as something he says it shows.
From there the walkthrough is a 2022 sequence. He describes the March 2022 monthly candle, says he had been expecting lower prices in 2022, and frames the goal as anticipating which way the next monthly candle expands – his answer being lower (25:12; 25:27; 25:40). He says April then delivered a run into sell-side liquidity as expected (26:15), and notes that the approach here mirrors the YouTube model he numbers as Model 13, then brings in the three-drives pattern he attributes to the Street Smarts material (26:54; 27:20).
The entry he describes is mechanical and worth restating exactly, because it differs from the slide-based rules above. He wants to see an old high violated while bearish, then puts a sell stop at the order-block opening price; when price rallies and comes back down to the opening price of the up candle that took out the previous high, the stop fills him short, and the protective stop goes at that candle’s high plus one – not plus 25 pips (27:41; 27:54; 29:25; 29:32; 29:43). Both the 25-pip rule and the “high plus one” instruction come from the same speaker in the same recording about the same model, and the discrepancy is left standing here rather than smoothed over. He also stresses the order sits on the account waiting to be triggered rather than requiring screen time, and that the target is the old monthly low (30:06; 30:47).
Two additional tools enter at this point. The first is SMT divergence against a correlated pair – euro against pound – where pound fails to make the higher high euro makes, which he reads as bearish divergence (30:52; 31:02; 31:10). The second is offset distribution, which he defines on the chart as finding a low and then waiting for price to go below it once more: the short-term low becomes visible, stops accumulate beneath it, the algorithm pauses or retraces, and then attacks the freshly engineered sell stops. He says the four-hour chart can be used for this, but that the daily gives the best value (31:54; 32:09; 32:23; 32:38; 33:06). “Offset distribution” is his term; the article reports his usage of it rather than endorsing the mechanism as described.
He then states his numbers. The stop loss is given as 1.11850 and the entry as 1.10865, which he acknowledges looks large and says is scaled to the account if 2% is being risked on a hypothetical paper trade (31:24; 31:36; 31:48). He describes euro creating one more higher high in April, dropping, and taking out the old monthly low, with the target set below at the 1.04 figure, and reports a seven-to-one reward-to-risk on the idea over roughly a month to a month and a half, which he converts to about 14% on a trade risking 2% (34:44; 35:05; 35:20; 35:30; 35:38). He frames the result as approaching half of a fund manager’s year, and says finding one more trade like it would beat most fund managers on the planet (35:56).
Those figures are the weak point of the lesson as evidence. No fill, spread, slippage, position size, account balance or statement appears in the recording; he explicitly calls the exercise a hypothetical paper trade; and the chart markings, the swing he selected, the entry and the target were all chosen and annotated by the speaker himself. A seven-to-one reward-to-risk ratio is a comparison of two distances he picked on a chart, not a realised return, and a retrospective walkthrough of a completed move cannot show that the same setup would have been identified and held in real time. Nothing here establishes the approach as profitable, and it should not be read as a recommendation to copy.
When to Use the ICT Trade Plan
The recording closes on the seasonal calendar rather than on the trade. He says spring and fall are the two seasons to work hard, warns against working so hard in January and December, and advises scaling back around July and August because of what he calls the summer doldrums, arguing the markets are easiest between those two peak seasons (36:35; 36:48; 36:56). That is study-and-effort advice tied to his seasonal thesis, and it rests on the same untested seasonal premise as the rest of the model.
One limitation belongs to this article specifically. The transcript used here is a local automatic speech recognition of the recording’s comp