
Key takeaways
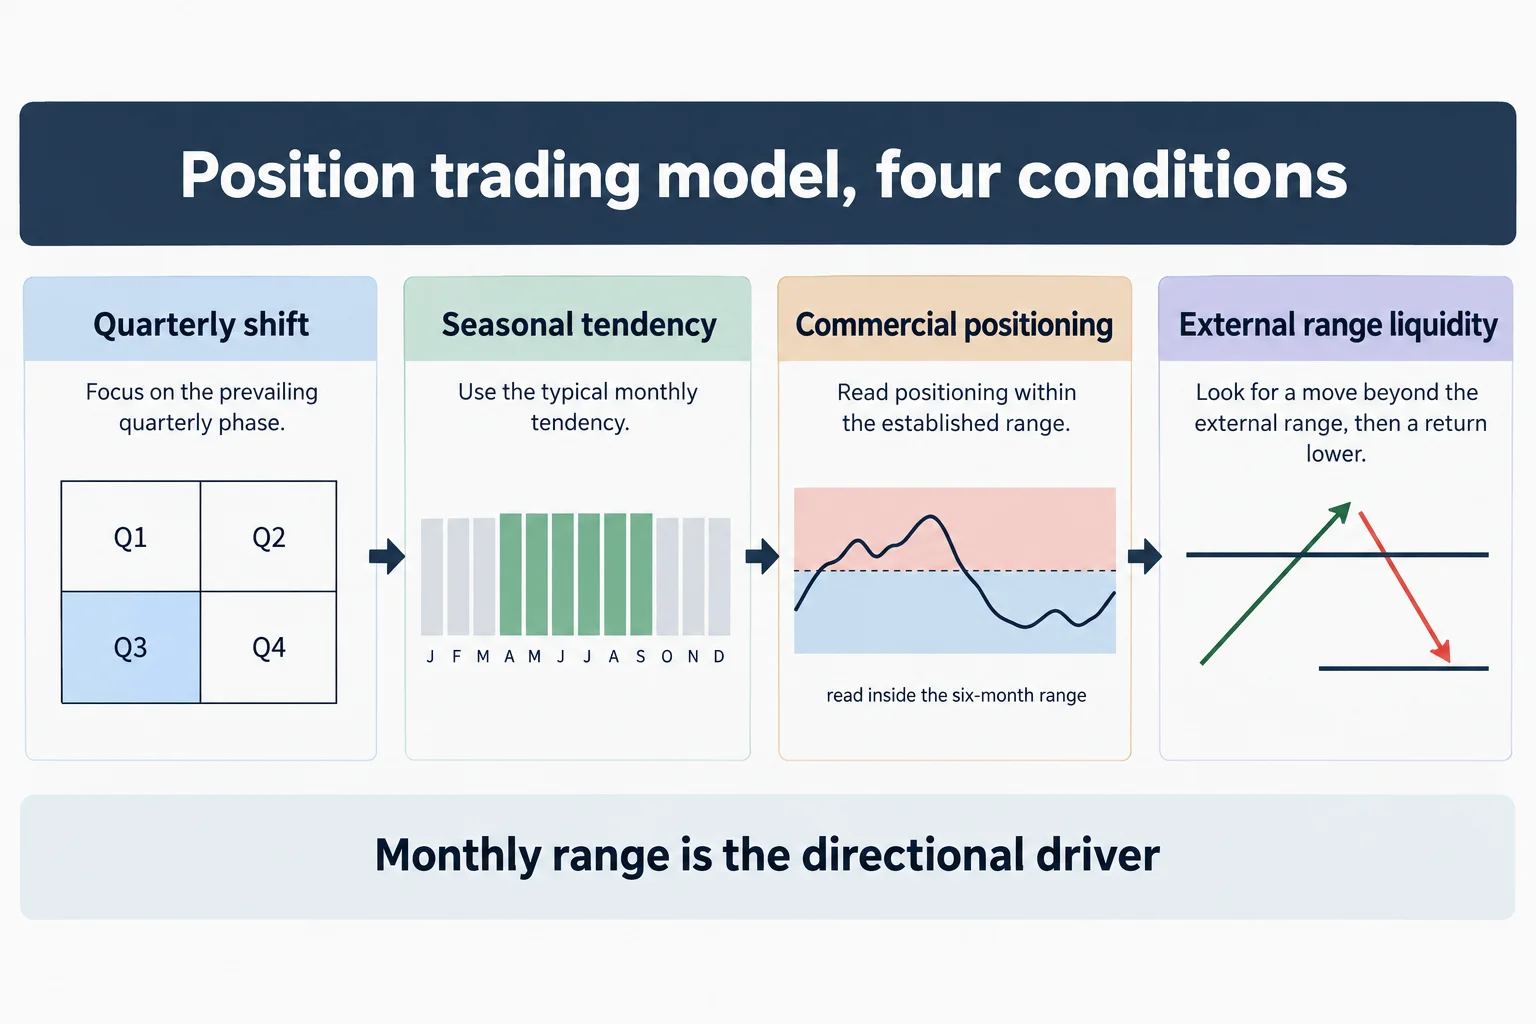
ICT Position Trading Model #4 from The Inner Circle Trader on YouTube is a long-term setup for trades lasting several weeks to several months, combining an anticipated quarterly shift, an aligned seasonal tendency, commercial positioning within its own six-month Commitment of Traders range, and a run on external range liquidity.
Read the full summary
ICT Position Trading Model #4 from The Inner Circle Trader on YouTube is a long-term setup for trades lasting several weeks to several months, combining an anticipated quarterly shift, an aligned seasonal tendency, commercial positioning within its own six-month Commitment of Traders range, and a run on external range liquidity. The bearish process uses the monthly range as the directional driver, screens a 20-, 40- or 60-day daily lookback for an older high, waits for price to exceed it by at least one pip while a correlated market or the US Dollar Index fails to confirm the move through SMT divergence, then places a sell stop at the open of the last up-close daily candle, described as a bearish order block. The worked British pound futures example uses the transcript-rendered B6M18 contract from 2018, a preferred seasonal window from mid-April through the second week of June, commercials interpreted as excessively net short, an entry rendered as 142.48, 130 pips of risk, an initial old-low target described as 5-to-1 reward-to-risk, and an eventual move described as 8-to-1. The bullish version reverses the structure by taking an old low and forming a lower low. Target management blends time and price, with an objective reached early in the seasonal window allowing possible continuation and the same objective reached near the window’s end suggesting termination. Published 10 January 2024 and running about 13 minutes 35 seconds, the recording presents one demo-account historical example with no backtest, win rate, sample size, audited fills, drawdown, commissions, or failure analysis. All terminology, levels, pip counts, and ratios come from automatic speech recognition without visible charts, so transcript renderings including IPTA data range, PDR8 matrix, B6M18, 142.48, and 137.12 are not independently verified.
How we researched this article
BestProps used document-based research from primary firm sources, checked September 24, 2026. The complete source list, scope, limitations, and commercial-state record appear near the end of this article.
What the ICT Position Trading Model Covers
At 0:10 the speaker frames the session as “quarterly shifts and seasonal tendencies”, and at 0:34 he states the model outright: anticipate the effects of a quarterly shift in the majors overlapping with a seasonal tendency. At 0:39 he names the setup as a combination of SMT divergence and what the transcript renders as a “commutator’s hedging program”, and at 0:45 he names the pattern as external range liquidity. Two of those phrases need care: the transcript’s “commutator” is almost certainly its rendering of “commercials”, the trader category the same passage goes on to discuss, and “SMT” is the speaker’s own abbreviation for a divergence between correlated markets.
He is explicit that this is a position-trading model rather than a frequent-entry setup. At 4:10 he says a position trade can run from several weeks to several months, and at 9:20 he says the point of the lesson is that the same liquidity concepts can be traded without intraday execution. At 9:58 he says a trader following it does not need to watch kill zones or minute-by-minute movement. Those are his characterisations of the approach, not measured outcomes.
He also points back to an earlier release. At 1:48 he directs viewers to January 2017 long-term position-trading content, and at 13:18 he says further examples will be covered across the twelve models in his post-mentorship material. The upload date and the example are separate facts: the watch page records the recording as published 10 January 2024, while the chart he works through is a British pound futures contract he identifies at 4:43 by the symbol as rendered in the transcript, “B6M18”.
Four ICT Position Trading Model Components
At 0:55 he describes the sequence as “what I see internally”, which is a useful frame for what follows: this is a stated decision order, not a validated system.
- A quarterly shift. At 0:30 he describes the stage as anticipating the effects of a quarterly shift in the majors. “Quarterly shift” is his term of art; he does not define it numerically in this recording.
- A seasonal tendency. At 4:10 he narrows the example to the shorter side of the pound’s seasonal pattern, and at 4:20 says he is focusing on the last week or so of April going down into the June lows. At 6:08 he gives the window he prefers: about mid-April to the second week of June.
- Commercial positioning. At 1:20 he says the Commitment of Traders net position on the commercials is read over the last six months, and at 5:28 he calls this his hedging program as taught in the mentorship.
- External range liquidity. At 1:26 he looks for an old high to be run out with a higher high, and at 1:32 he expects SMT divergence forming at the same time, with either a correlated pair or the US Dollar Index.
At 2:51 he states the hierarchy plainly: the monthly range is the primary driver. At 3:28 he says the example market is the British pound, and at 4:51 he notes the bullish March-to-May seasonal scenario is available but says he is deliberately not using it this time. At 3:08 he says the bullish version of the model simply reverses the whole structure.
ICT Price Action at the Daily Range High
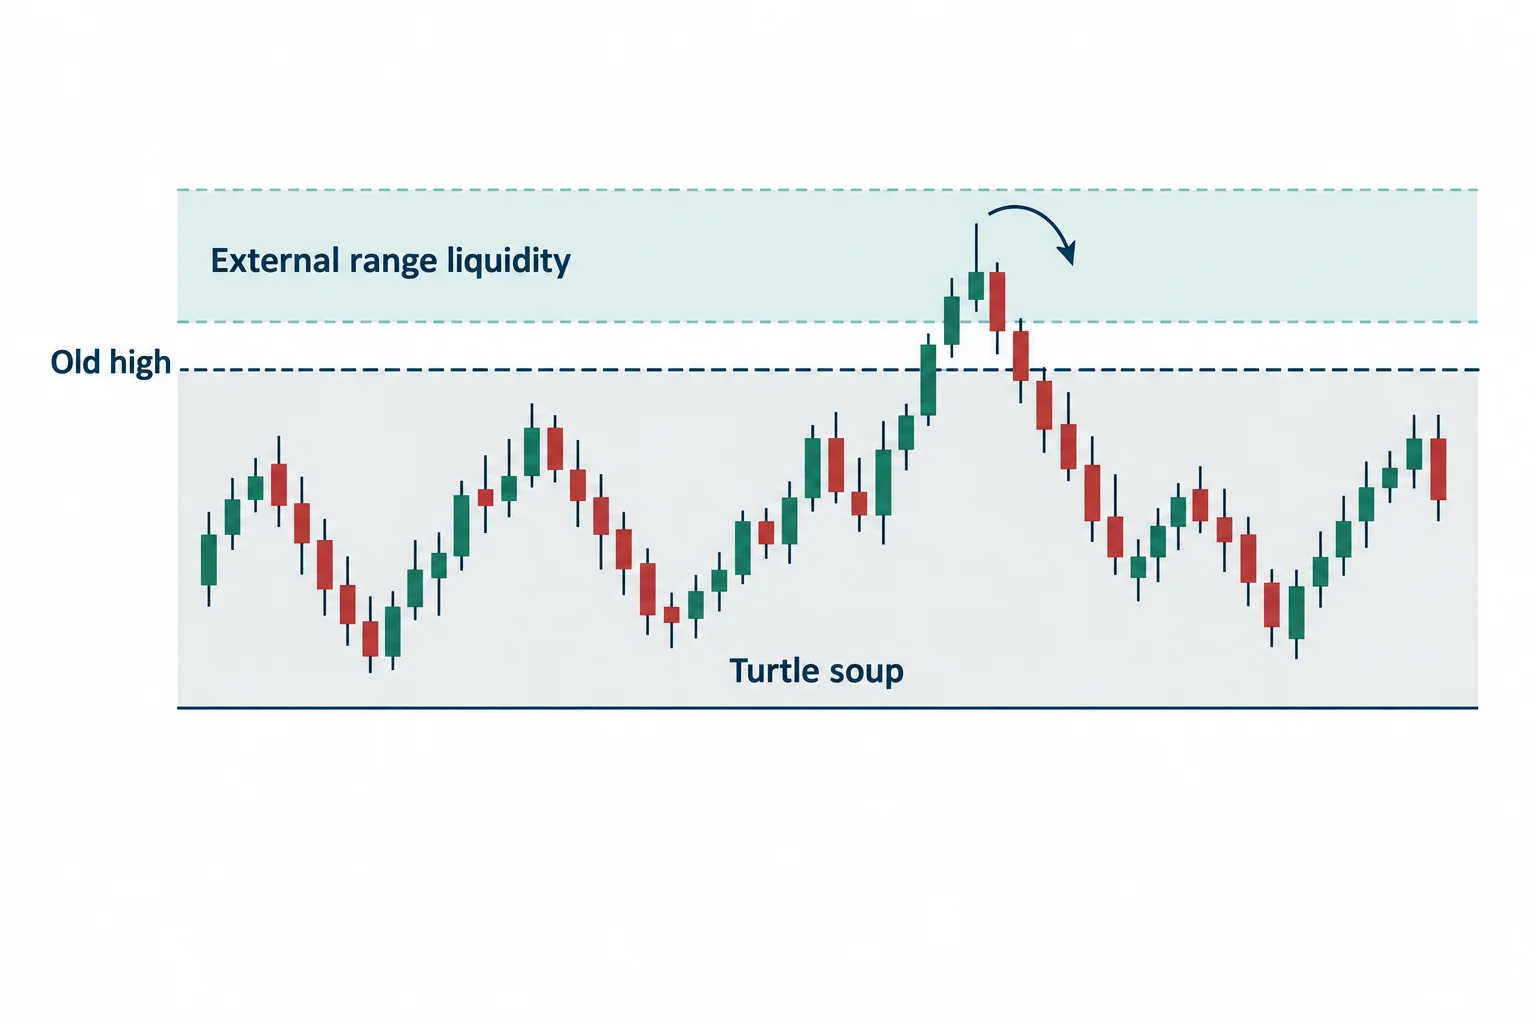
At 1:02 he describes a lookback of 20, 40 or 60 days on the daily chart, rendered in the transcript as an “IPTA data range”. That acronym is not resolved in the recording. It is close to “IPDA”, the price-delivery vocabulary used elsewhere in this body of work, but the transcript cannot settle it, so the term is reported as it was rendered rather than corrected. The practical instruction attached to it is clear enough: examine a defined daily lookback and identify an older high or low that could act as external liquidity.
For the bearish case he wants price to trade above that old level and print a higher high. At 8:45 he identifies the old high in the example as one from January 2018, and at 8:51 he says the break only needs to trade through it by one pip. At 9:09 he describes what he wants to see as a “turtle soup” scenario, which he immediately rephrases as a run on external range liquidity. At 0:22 he covers the mirror case: everything is reversed for bullish scenarios, where an old low is taken out and a lower low forms.
One more condition sits on top of the price structure. At 9:04 he refers to an orange shaded area on his seasonal chart that he defines as the mid-point of April, and says he expects weakness to arrive inside it. That shading is a drawn feature of a slide this source cannot see, so it is reported as his description rather than as a checked chart annotation.
ICT Position Trading With Six-Month Commercial Data
At 4:43 he opens a Commitment of Traders chart, at 5:08 he says the commercials line is the one he focuses on, and at 5:12 he says he is not interested in the small-speculator or public-trader lines. At 5:42 he ties the six-month window to the seasonal criteria: because May is the bearish month, the lookback reaches as far back as November of the previous year. At 6:33 he says the April-to-May stretch shows a heavy net short position by the commercials under his own application of the tool, and at 6:51 he describes the highest and lowest six-month readings as the range he delineates.
At 7:04 he states the logic as a sequence: a seasonally bearish May, a hedging-program reading that reflects what he calls an excessive net short held by the commercials, and a quarterly shift anticipated in the majors. At 7:12 he uses the phrase “excessive net short” directly. This is his own interpretation of a public dataset, not a rule the data itself supplies: the official reports classify a trader as commercial by hedging purpose rather than by market view, and nothing in the recording tests whether a six-month range reading has predictive value. For a reader who wants to check the underlying series, the CFTC publishes the reports and their classification notes; both are linked below.
ICT Price Action Entry Rule for the Pound
The entry rule is stated twice. At 7:48 he says he would short the open of the last up-close candle on a stop, and at 9:26 he repeats it as using the last up-close candle’s open to sell on a stop. At 9:34 he explains the mechanic: look at the previous day, take its open, and if the old high gets run, use that opening price as the resting order level. At 9:41 he calls that candle a bearish order block. The order would sit in a demo account according to 9:48.
He then narrates the outcome. At 10:04 he says the market made a higher high than the January high, and at 10:13 he describes the divergence: the dollar index was unable to make the lower low he would have expected while the pound made a higher high. At 10:32 he gives the entry level the transcript renders as 142.48, at 10:45 a stop he describes as 130 pips, and at 10:49 he pre-empts the objection that the stop is wide by pointing out this is a position trade.
Targets are the discount-side liquidity below. At 10:56 he says he is looking at old lows as the discount array, at 11:00 the transcript renders “PDR8 matrix” on the daily chart, and at 11:28 he puts the first run to the old low at 5-to-1 against the 130-pip risk. At 11:55 he says the move ultimately reached 8-to-1. At 11:12 he adds that this is the same model behind levels he says he called live each week.
Those numbers are reported here because he said them, not because they are checkable. The levels come from a slide this source cannot see, the entry is described as a demo order, and there is no account statement, no fill confirmation, no slippage or commission treatment and no sample size. A transcript figure like “142.48” is also exactly the kind of value speech recognition can misplace, so it is quoted as rendered rather than treated as a level. Nothing in the recording establishes that the reported reward-to-risk was realised in a funded account.
Blending Time and Price in the ICT Model
The closing concept is the part of the lesson with the least to do with entries. At 12:49 he says that if the decline had taken much longer and reached what the transcript renders as 137.12 only in the first week of June, he would have judged that to be the end of the major move. At 13:01 he describes time and price meeting at a terminus, which he ties to the sell stops below and the length of the seasonal window running into June. At 12:39 he reduces the idea to a sentence: you are blending time and price.
Read plainly, the argument is about holding rather than entering. A target reached early in the window leaves room for continuation, and the same target reached as the window closes looks like the end of the move. The seasonal window is a date range the speaker drew on a chart, so the reader should treat the timing rule as his judgement rather than a measured expiry. There is no statistical work in the recording on how often a seasonal tendency begins or ends on schedule, and he says at 5:56 that these tendencies are not locked to a calendar day.
ICT Position Trading Model Checklist
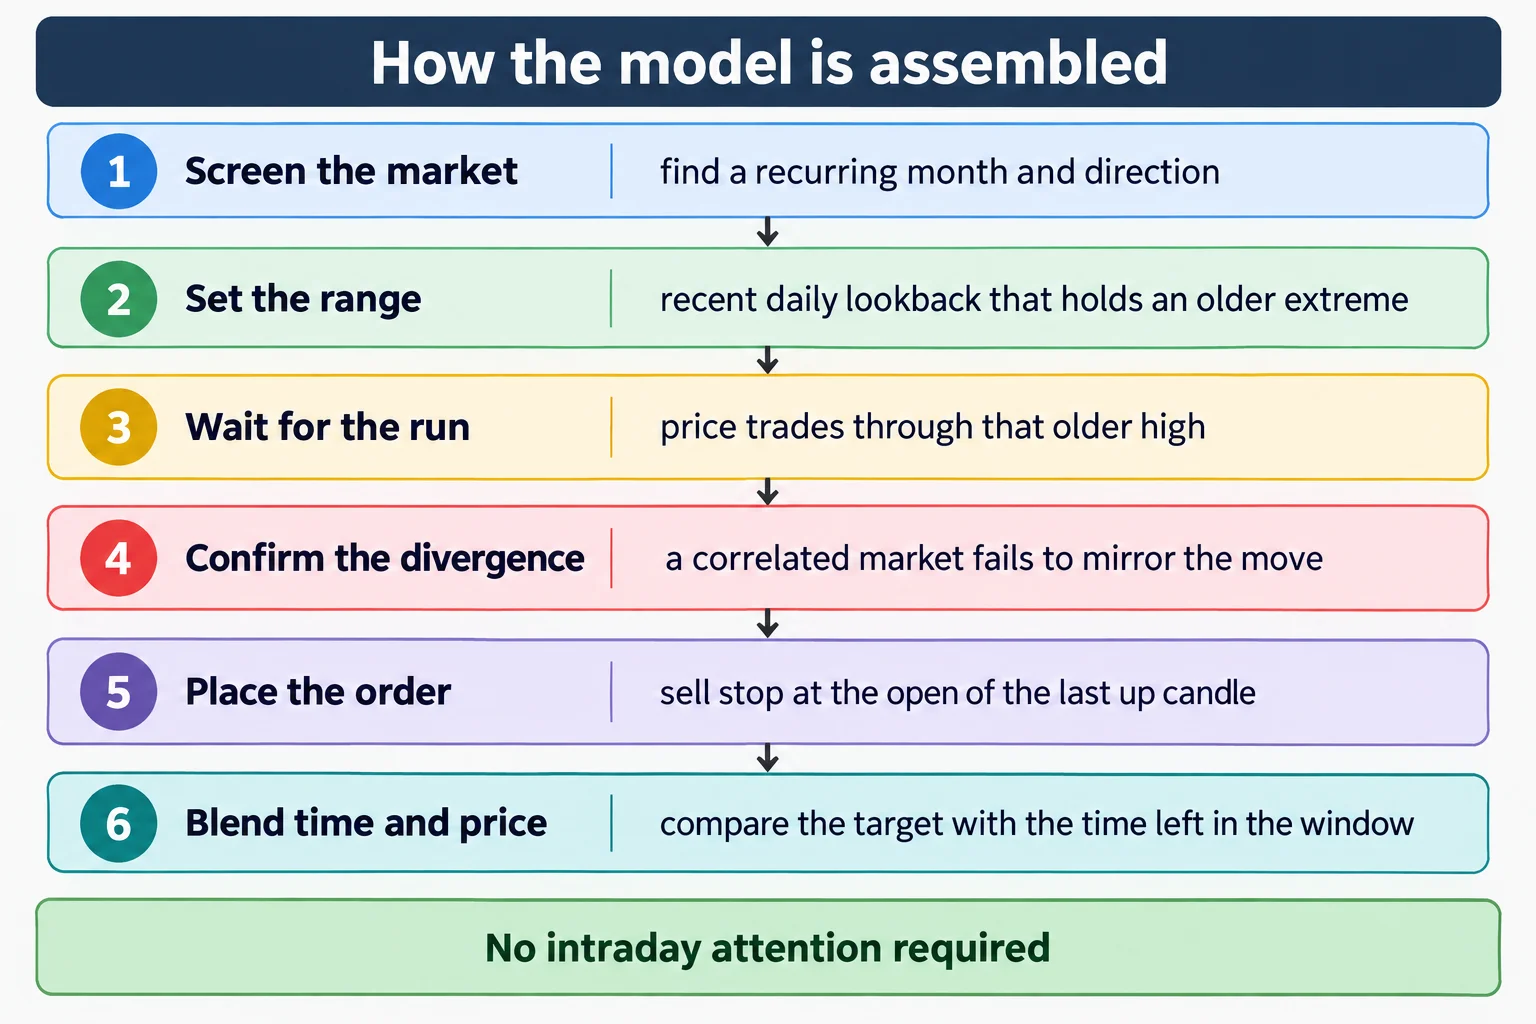
- Screen for a quarterly shift and a seasonal tendency in the same direction (0:34).
- Set a 20-, 40- or 60-day daily lookback and locate an older high or low inside it (1:02).
- Read commercial positioning across the same six months, using his own range-based interpretation rather than the zero line (5:42, 6:51).
- Wait for price to trade through the old extreme while a correlated market or the Dollar Index fails to mirror the move (1:26, 10:13).
- Place a stop order at the open of the last up-close daily candle and accept a wider stop as the cost of a long-term position (9:26, 10:49).
- Compare the objective with the time remaining in the seasonal window before deciding whether the move is finished (13:01).
This checklist restates the lesson. It is not a tested system and it is not advice. The video supplies no backtest, no win rate and no audited fill record, and the one worked example is a single historical chart.
Limits of the ICT Position Trading Recording
The source used for this article is automatic speech recognition of the recording’s audio, not human-checked captions, and no chart in the video was seen. That has two consequences worth stating plainly. First, the technical vocabulary may be misrendered – the transcript returns “commutator’s hedging program”, “SMD divergence”, “IPTA data range” and “PDR8 matrix”, and only some of those can be resolved from context. Second, every level, pip count and ratio in this article is the speaker reading from a slide the reader cannot see, so none of it is independently verified here.
Several things a reader might want are absent. There is no statement of how many times the model has been traded, no performance record, no drawdown and no treatment of what happens when the seasonal tendency fails to arrive. The example is described as a demo order, and the seasonal chart is a visual pattern rather than a tested probability. The speaker’s own framing at 0:55 – what he sees internally, how he internalised the setup – is a description of a personal process, and it is reported here on those terms.
Watch the Original ICT Position Trading Recording
The recording runs about 13 minutes 35 seconds and is the only primary source used here. The channel is The Inner Circle Trader on YouTube. Because the lesson is delivered over slides, watching it is the only way to see the charts, the seasonal shading and the levels discussed above.
ICT Position Trading Model Resources
These are the sources checked for this article. The CFTC and CME material is the official publication and classification background for the data the lesson reads, plus two general investor-protection pages on systems sold online and on retail forex fraud. None of it is an assessment of ICT, of Price Action Model 4 or of anything said in the recording. Copies, notes, indicator bundles and second-hand summaries of this charter lesson circulating elsewhere are unofficial and untested here.
- [1] ICT Charter Price Action Model #4 Position Trading – The Inner Circle Trader (primary source; watch page read 15 September 2026, 13M35S)
- [2] CFTC – Commitments of Traders reports (official publication of the weekly data the lesson reads, including the six-month history; read 15 September 2026)
- [3] CFTC – Commitments of Traders explanatory notes on commercial and non-commercial traders (how a trader is classified as commercial by hedging purpose; read 15 September 2026)
- [4] CFTC – Fraud advisory on commodity trading systems sold on the internet (hypothetical and simulated results; read 15 September 2026)
- [5] CFTC Learn & Protect – Forex Frauds (investor-protection context for leveraged currency trading; read 15 September 2026)
This is independent educational commentary on one charter lesson. It is not official ICT material, it is not a tested trading system, and it is not investment advice. The worked example in the recording is described there as a demo account, and the levels, pip figures and reward-to-risk ratios are the speaker’s own statements rather than verified results. Leveraged and futures trading involves substantial risk and is not suitable for everyone.