
Key takeaways
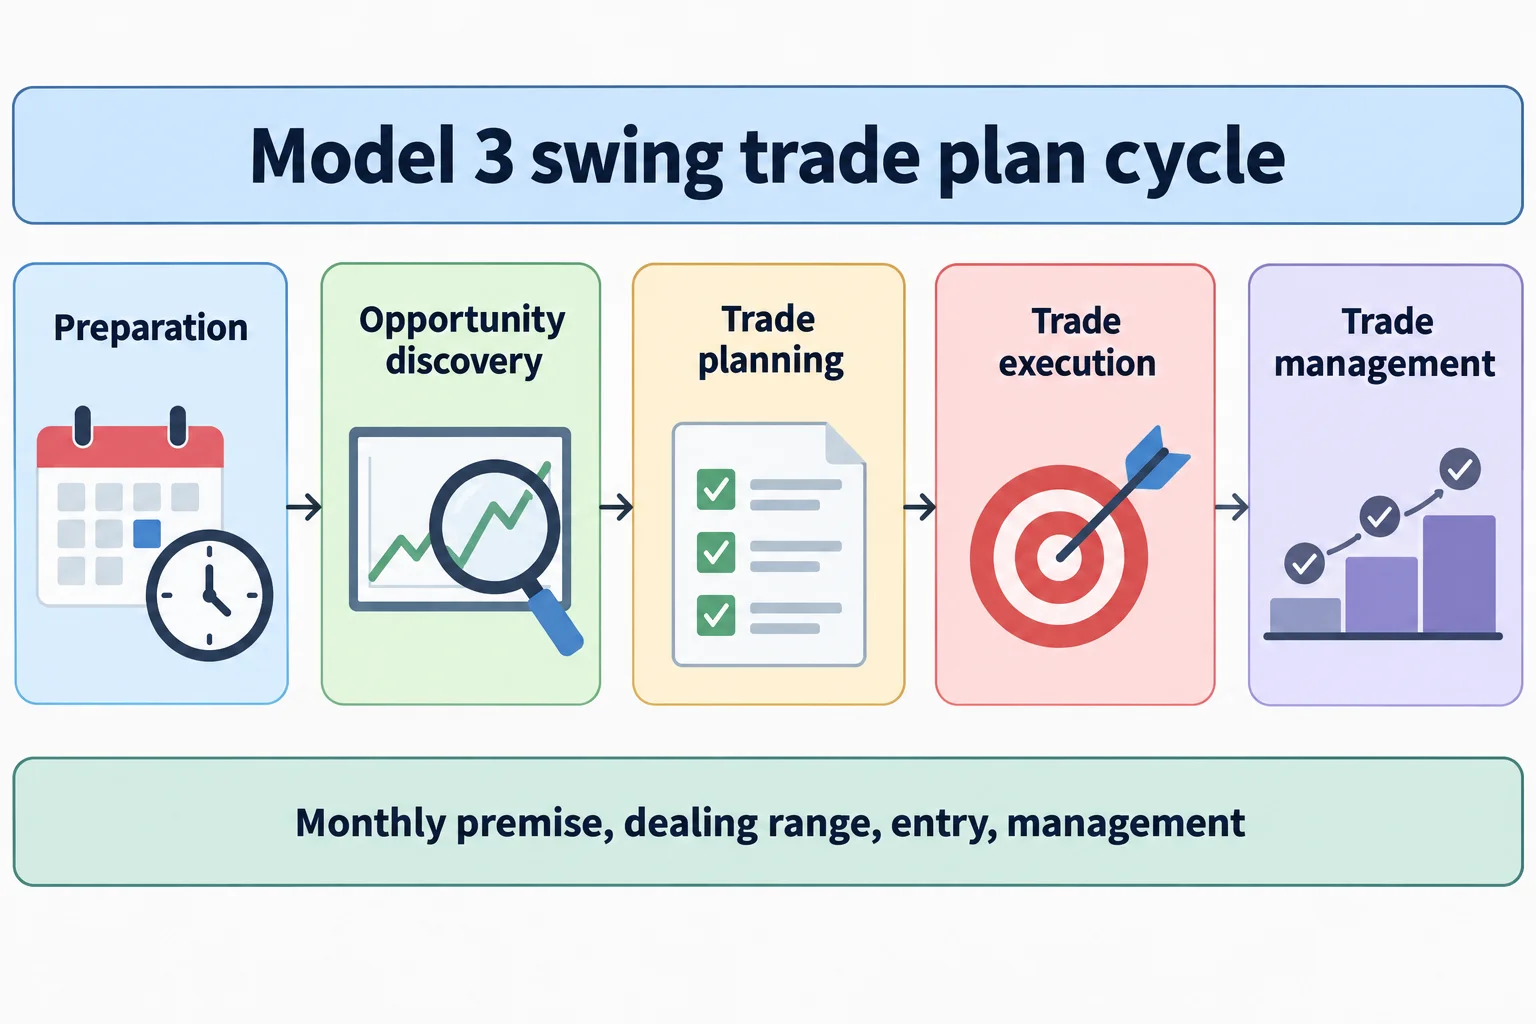
In ICT Charter Price Action Model 3: Trade Plan & Algorithmic Theory (posted 5 January 2024), ICT sets out Model 3 as a swing-trading plan built on the five-stage trade-plan cycle he uses across his models: preparation, opportunity discovery, trade planning, trade execution and trade management.
Read the full summary
In ICT Charter Price Action Model 3: Trade Plan & Algorithmic Theory (posted 5 January 2024), ICT sets out Model 3 as a swing-trading plan built on the five-stage trade-plan cycle he uses across his models: preparation, opportunity discovery, trade planning, trade execution and trade management. Its stated objective is moves of 100 to 300 pips. The framework layers a monthly directional premise, a 20-, 40- or 60-day dealing range, seasonal tendencies, his own reading of commercial positioning in Commitment of Traders data, a 15-minute entry filtered at the 62% retracement and inside three standard deviations of a session range, and a staged stop-management schedule. The closing section is a worked example he says is May 2022 on GBP/USD against a bullish dollar index. Every level, pip figure and outcome in the recording is spoken over slides that this article cannot see, and no fill, statement or sample size accompanies them.
How we researched this article
BestProps used document-based research from primary firm sources, checked September 24, 2026. The complete source list, scope, limitations, and commercial-state record appear near the end of this article.
ICT Model 3 Five-Stage Trade Plan
At 0:11 ICT states the objective as trades of 100 to 300 pips, and at 0:30 repeats that framing and says he has already flagged it in the two previous trade plans. That is a model specification, not evidence that such moves are typical or achievable in a given market.
His organising idea is modularity. At 1:24 he describes the models as modular, available individually or as a set, and at 3:28 says the full series runs to twelve price action model trade plans. At 4:58 he justifies that approach by saying price action is fractal, and at 50:48 he returns to the same phrase when explaining why a missed high or low does not necessarily invalidate a swing idea. He says at 7:19 that the algorithmic principles are applied on top of the core content rather than replacing it.
He also asks the reader to self-select. From 2:44 he distinguishes scalping, day trading, short-term, swing and position trading and says at 2:57 that whether a trader remains in a given classification is an individual matter, not something to force.
ICT Model 3 Preparation With Calendar, Range, and Liquidity
At 9:54 and 10:01 ICT gives the recurring cycle as preparation, opportunity discovery, trade planning, trade execution and trade management. Model 3 applies that sequence to a swing horizon: the monthly range supplies the directional premise, longer timeframes define context and objectives, and intraday charts are reserved mainly for refining an entry.
ICT Model 3 Trade Direction and Opportunity Discovery
Preparation begins with the economic calendar. At 10:14 he says he always refers to the coming week’s calendar, at 10:27 he asks the reader to study the coming week’s events against current market structure, and at 15:03 he frames medium- and high-impact events as a possible smoke screen rather than a standalone signal. At 10:53 he notes the monthly range still has to be fleshed out with four weekly candles.
The lookback window expands for this model. At 11:07 he moves into what the automated transcript renders as “IPTA data ranges”, and at 11:21 explains that where the earlier models looked back 20 days, this one brings in the full 20-, 40- and 60-day set because swing trading requires a larger degree of price and duration. That interval becomes his dealing range, and at 24:26 he places premium arrays inside the 20-day range when the hedge-program reading is bearish, and inside the 20-, 40- or 60-day lookback when it is bullish.
One term needs flagging rather than quiet correction. The transcript renders the lookback term as “IPTA data ranges” and never expands the acronym in this lesson; it is left as the automated transcript has it rather than guessed at here.
ICT Trade Planning and Lower-Timeframe Execution
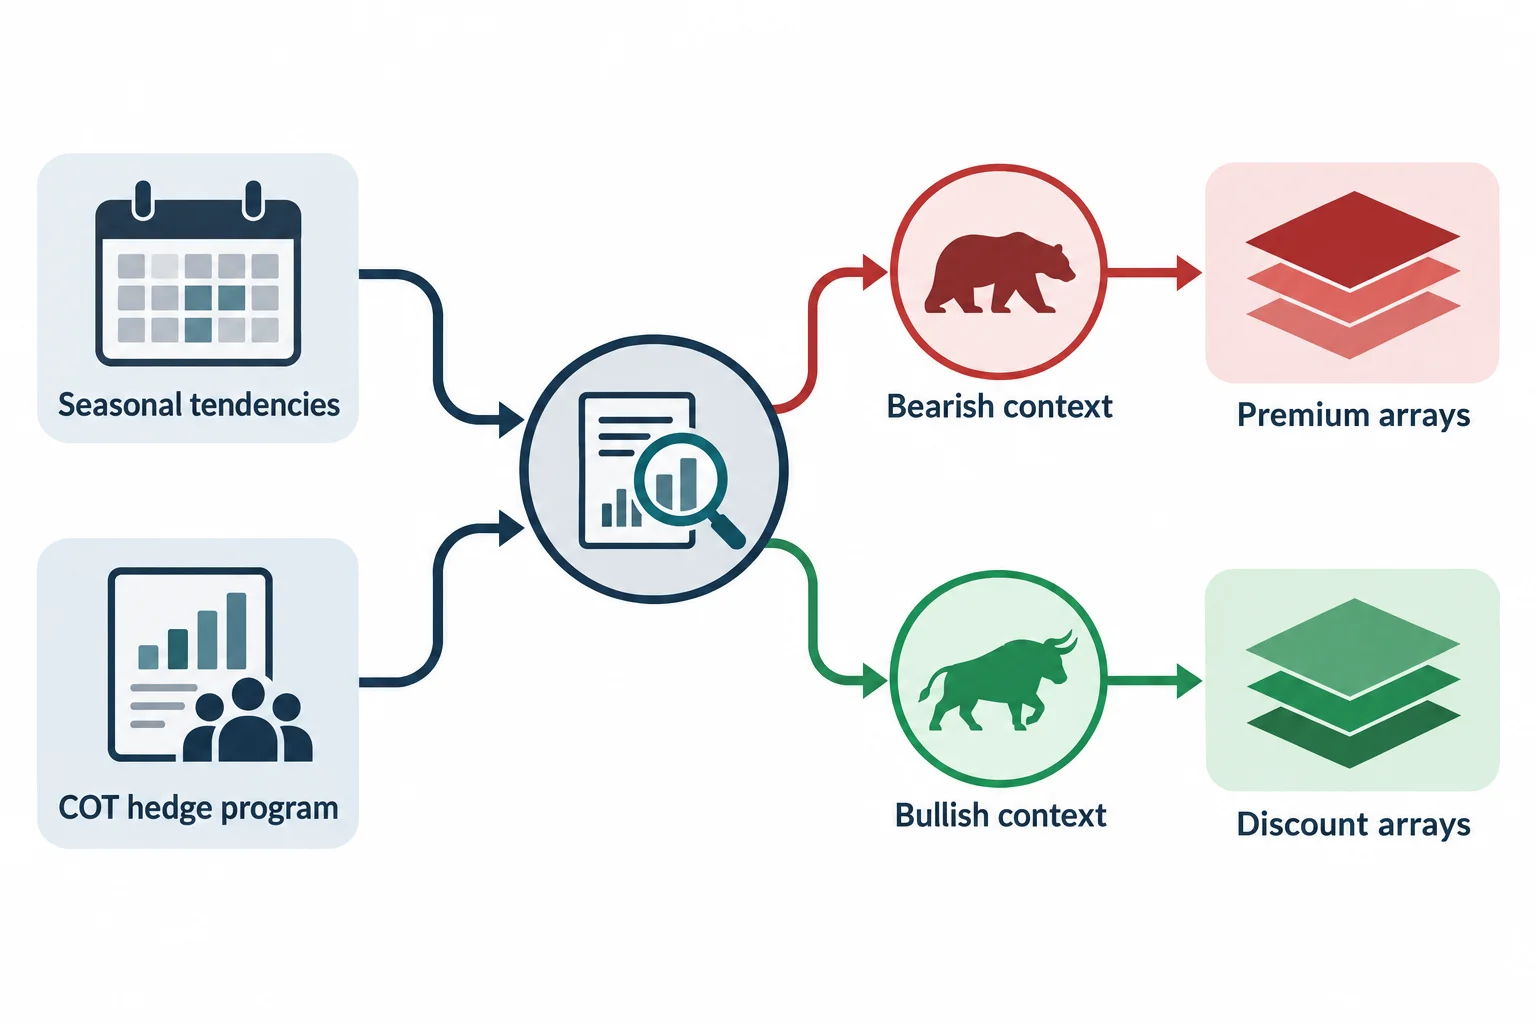
At 15:18 ICT turns to opportunity discovery, adding seasonal tendencies. At 16:46 he describes looking ahead to what seasonal tendencies are likely for the coming months, and he says seasonality is not a reason to enter on its own. At 20:31 he explains why he uses a twelve-month lookback for the positioning work that follows.
The other filter is what he calls the COT hedge program. At 18:02 he introduces it as his way of interpreting Commitment of Traders data using the commercials only, and at 24:51 describes splitting the last twelve months of commercial activity at its midpoint. At 25:07 he gives the directional convention: when the hedge-program reading is bullish on a twelve-month lookback the market has come down, and the reverse. A bearish reading is paired with premium arrays and an expected monthly expansion lower; a bullish reading with discount arrays and an expansion higher.
This is his stated proprietary interpretation of positioning data, not a tested rule. The recording offers no sample, no hit rate and no statistical validation for it, and the article does not treat it as established.
ICT Model 3 Entry Filters and Standard Deviation
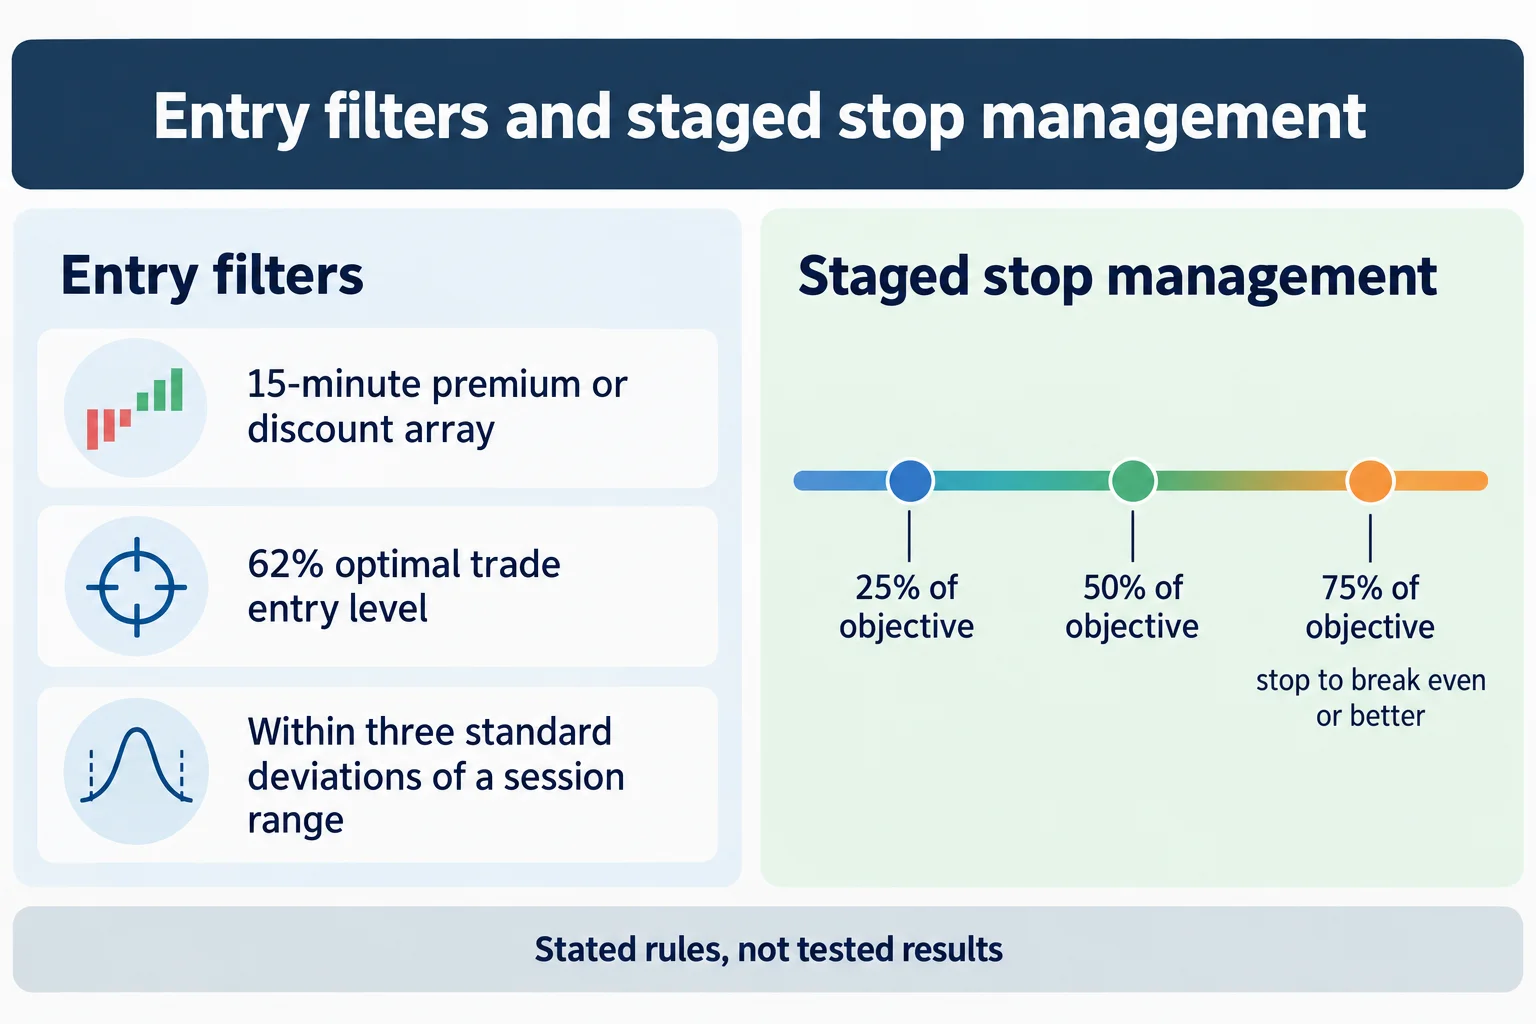
The execution rules are the most specific part of the lesson. At 27:32 ICT describes waiting for price to move temporarily against the intended direction near a scheduled volatility event. At 28:02 he states the entry should converge at no more than plus three standard deviations, with the standard deviations drawn from the Asian range, the Central Bank Dealers range or what the transcript renders as “FLOUT”; at 28:23 he places the entry at the 62% level of the optimal trade entry during the London or New York open, and at 28:30 requires the 62% and the standard-deviation level to converge within five pips of each other. The bearish mirror of the same rule is at 29:18.
“FLOUT” is the term that cannot be resolved from the audio. It appears three times in the transcript, at 28:09, 29:24 and 30:13, always in the same list alongside the Asian range and the Central Bank Dealers range. The word is not definable from this source, so it is flagged rather than replaced with a plausible-sounding expansion. He says one- and five-minute setups can refine an entry once the higher-timeframe conditions are met.
Targets come from old daily highs or lows and fair value gaps inside the dealing range. At 34:00 he says the range chosen should frame the potential for at least 100 to 300 pips, and he prefers objectives visible on the daily chart rather than improvising an exit from intraday noise. At 41:48 he describes 300 pips as the ideal while leaving room for a partial exit earlier, and at 42:00 he says a monthly expansion could open up much more.
ICT Model 3 Trade and Risk Management
The management instructions are stated as rules. At 38:31 he describes placing limit orders across several positions executed on a demo account, at 38:21 gives short-side placement relative to the Asian range high and the European opening price, and at 39:01 and 42:07 pairs the entry with standard-deviation and array convergence.
The stop schedule is the clearest numeric rule in the recording. At 51:07 he says that at 25% of the expected objective the stop can be reduced by 25%; at 51:22 that at 50% of the objective it can be reduced by 50%; and at 51:28 that at 75% of the objective the stop must be at break even or better. He warns against tightening a stop so aggressively that an ordinary retracement closes the position.
On sizing he describes reducing risk after losses. At 56:38 he works through a run of three losses starting from 1% and at 57:04 says that after two losses at a quarter of 1% the account is down about 1.5%; at 57:17 he describes dropping the risk amount by half after a loss and restoring it as the previous loss is recovered, and at 1:02:59 he says the reduction applies after five winning trades. At 55:01 he frames the whole discussion as taking place on a demo account, and at 58:24 uses a Euro-Australian example with a 25-pip stop to illustrate the arithmetic. These are his educational examples. The recording does not establish that the schedule prevents substantial losses, and the article does not present them as advice for any individual.
ICT Model 3 GBP/USD Trade Case Study
The closing lecture is the algorithmic-theory case study. At 1:06:39 ICT introduces a lecture on algorithmic theory for Model 3, and at 1:06:44 says he wants to walk through what has recently transpired. At 1:07:14 he builds it on the Commitment of Traders premise with seasonal tendencies added, and at 1:07:22 says that at the time of the recording it is May 2022, that he had been bullish on the dollar index, and at 1:07:31 that the counterparty read was bearish on foreign currency, specifically the British pound.
He then works the example forward. At 1:07:38 he introduces the pound chart, at 1:07:50 says he used April with a twelve-month lookback for the high and low, and at 1:11:27 states the expectation as a monthly candle expansion reaching for a liquidity pool. At 1:12:37 he reviews a Monday in April and describes shorting Monday to Wednesday for 100 to 300 pips, and at 1:12:56 to 1:13:02 reads levels off the chart, which the automated transcript renders as approximately 131 and 130.80 down toward 126.80.
Those numbers are the weakest part of the source and are not presented as verified here. They are the speaker’s reading of levels on a chart that is not visible in the audio; the transcript itself garbles the phrasing, and the recording contains no fill confirmation, no account statement and no outcome beyond his own characterisation of how the move developed. The transferable element is the workflow he demonstrates, not the specific levels or the reported result.
How to Study the ICT Model 3 Trade Plan
At 1:06:07 ICT tells students to collect a month or two of sample sets with the trade plan, at 1:06:26 says he will provide sample sets himself, and at 1:06:20 says revisiting the ideas resets how they are understood. At 1:06:07 that instruction is paired with the caution at 1:06:35 not to rely on him or wait for his examples. He also points at 1:10:53 to the same material as additional self-study, and at 1:18:10 suggests a euro study as a further case to work through.
What This ICT Model 3 Lesson Does Not Establish
The lesson is delivered over slides, and the source here is the audio. Nothing in this article is drawn from a chart that was seen, and the transcript is automatic speech recognition rather than human-verified captions, so terms and numbers may be misrendered. Three terms are affected: “IPTA data ranges”, “FLOUT”, and the chart levels quoted in the case study.
Several things a reader might expect are absent. There is no win rate, sample size, backtest, drawdown figure or account record. There is no statement that any example was a real-money fill – the execution discussion is explicitly framed as demo-account orders at 55:01. The 100-to-300-pip objective is a model specification rather than a measurement. The COT hedge-program method and the standard-deviation entry filter carry no validation study in the recording, and the stop-management percentages are educational examples he gives, not personalised guidance.
ICT Model 3 Practical Takeaways
- Work the five-stage cycle in order: preparation, opportunity discovery, planning, execution, management (9:54).
- Screen by season and by the positioning reading before looking for an entry (15:18, 24:51).
- Enter on the 62% level only where it converges with a session standard deviation, in the 15-minute frame (28:23, 28:30).
- Manage the stop in stages at 25%, 50% and 75% of the objective (51:07, 51:28).
- Treat the demo-account sizing discussion and every pip figure as the speaker’s examples, not as verified results or advice (55:01).
Watch the original recording
The recording runs about 79 minutes and is the only primary source used for this article. The channel is The Inner Circle Trader on YouTube.
Resources
These are the sources checked for this article. The CFTC and Investor.gov pages are general regulator and investor-education material – on the official publication of the Commitment of Traders data the lesson interprets, on trading systems sold online, on retail forex fraud, and on leverage. They are not assessments of ICT, of Model 3 or of anything said in the recording. Copies, notes, indicator bundles and second-hand summaries of this paid charter lesson circulating elsewhere are unofficial and untested here.
- [1] ICT Charter Price Action Model 3 \\ Trade Plan & Algorithmic Theory – The Inner Circle Trader (primary source; watch page read 15 September 2026, 79M25S)
- [2] CFTC – Commitments of Traders reports (official publication of the data the lesson reads, read 15 September 2026)
- [3] CFTC – Fraud Advisory: Commodity Trading Systems Sold on the Internet (read 15 September 2026)
- [4] CFTC Learn & Protect – Forex Frauds (read 15 September 2026)
- [5] Investor.gov – Leverage (read 15 September 2026)
This is independent educational commentary on one paid charter lesson. It is not official ICT material, it is not a tested trading system, and it is not investment advice. The speaker frames the execution discussion in the recording as demo-account work. Leveraged and futures trading involves substantial risk and is not suitable for everyone. No performance figure quoted here is verified.