
Key takeaways
ICT Charter Price Action Model 1 is a rule-based scalping plan targeting 15 to 20 pips per trade through preparation, opportunity discovery, trade planning, execution and trade management, with its algorithmic theory restating the rules as an if and then checklist rather than an automated system.
Read the full summary
ICT Charter Price Action Model 1 is a rule-based scalping plan targeting 15 to 20 pips per trade through preparation, opportunity discovery, trade planning, execution and trade management, with its algorithmic theory restating the rules as an if and then checklist rather than an automated system. Preparation uses Forex Factory to track medium- and high-impact events, a 20-trading-day dealing range excluding Sundays, or 40 days when needed, and liquidity above old daily highs, below old daily lows, or within premium and discount arrays to establish bias. Entries use a five-minute chart from seven a.m. to ten a.m. New York time, exceptionally extending to eleven a.m. for later news, with Monday through Wednesday preferred, Thursday allowed only before the relevant previous high or low is reached, and Friday excluded. Long entries use the 62% retracement plus five pips and shorts use it minus five pips. Session-based stops sit five pips below the lowest low for longs or above the highest high for shorts, while the later checklist references the Fibonacci anchor low or high. A stop-out triggers the One and Done rule with no re-entry that day. Exits target 15 pips and 20 pips, with an optional third position for a longer objective, while checklist exits use the anchor high or low, a previous swing or Fibonacci extension, and the symmetrical swing extension. Total risk is divided among all positions. Stops may be reduced 25% after reaching 25% of the objective, 50% after reaching 50%, and moved to break-even including spread and commission at 75%. Position size equals account equity multiplied by risk percentage and divided by stop distance in pips. A $20,000 account risking 1.5%, or $300, with a 20-pip stop yields 150 micro lots, 15 mini lots or 1.5 standard lots, rounded down to one standard lot when only full lots are available. After a full-risk loss, the next trade risk is halved until 50% of the loss is recovered, with another loss causing another halving. Risk is also halved after five consecutive wins. The speaker recommends back-testing one or two months of samples, uses demo-account orders, disclaims guaranteed profitability and presents no verified performance results.
How we researched this article
BestProps used document-based research from primary firm sources, checked September 24, 2026. The complete source list, scope, limitations, and commercial-state record appear near the end of this article.
What the ICT Charter Price Action Model 1 Covers
At 0:05 the speaker opens by naming the recording “price action model number one, introduce scalping trade plan”, and at 0:14 he states the objective: to capture 15 to 20 pips per trade. He turns a directional scalping concept into a rule-based workflow covering preparation, opportunity discovery, trade planning, execution, management, and a later “algorithmic theory” section that restates the model as a sequence of conditional decisions.
He is explicit from the start that the material is written for students who have already worked through the prerequisite content. At 1:01 he says the plan is written with the perspective of mentorship students who have participated for at least a calendar year, and that a reader who simply obtains the plan without studying the price action models will not get the same benefit from it. He also warns that interpretation differs between students, that losses are possible, and that he does not promise profitability or a perfect strike rate. At 6:03 he states that each student is responsible for their own actions and that he is not responsible for anyone placing a live trade. At 6:33 he gives the reason he teaches through a demo account as the medium, and the model’s execution slides later say outright that the orders are placed in a demo account.
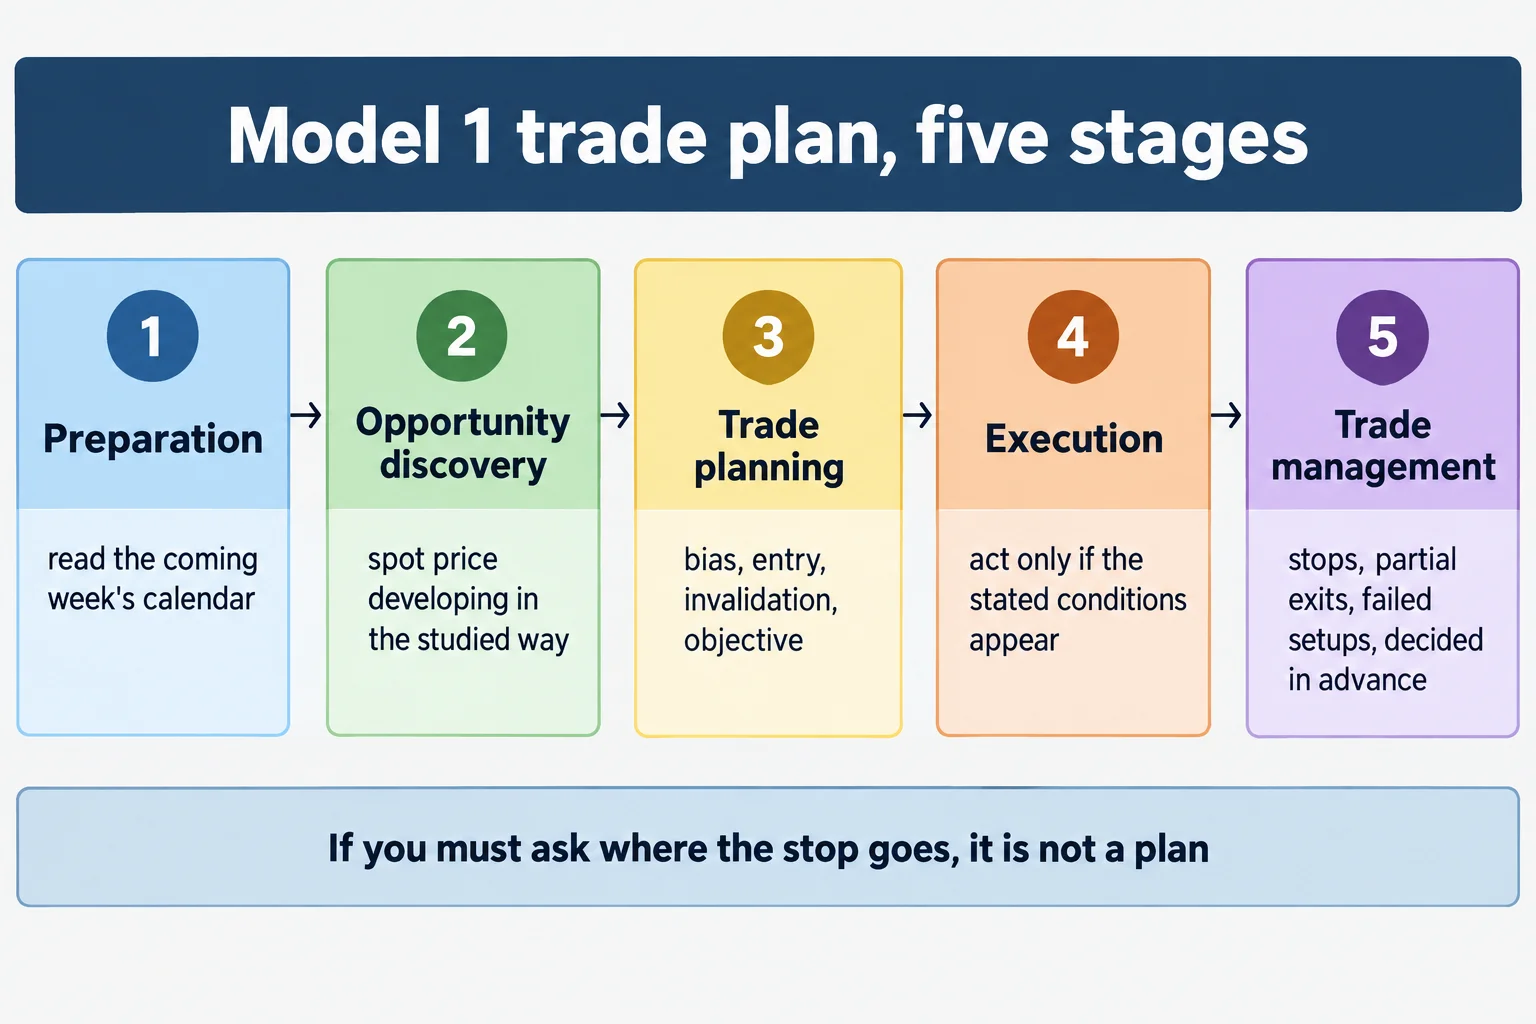
Five Stages of the ICT Trade Plan
At 8:32 he introduces the recording as a scalping model trade plan and says there are essentially five steps to every trading plan. He works through them in order from 9:05:
- Preparation: decide what markets and scheduled events require attention.
- Opportunity discovery: recognise whether price is developing in a way that fits the previously studied model.
- Trade planning: define the directional thesis, entry conditions, invalidation and objective before acting.
- Execution: act only if the specified conditions appear.
- Trade management: predetermine how stops, partial exits and failed setups will be handled.
His broader point, made at 9:56, is that an entry pattern alone is not a trade plan. He describes students emailing him after entering a trade to ask where to put the stop and where to take profit, and says that if he has to supply those answers the trade was never theirs. From 16:52 he adds that the framework is a template – students can build their own model on it, and the fewer moving parts the better.
ICT Trade Plan Preparation and Directional Bias
The preparation stage begins at 11:08. He says to refer to the economic calendar for the coming week and note all medium- and high-impact events for the markets being followed, using filters to reduce the number of events and markets so the focus stays narrow. He points out that the calendar is published ahead of time and names Forex Factory as the calendar he uses. The calendar is treated as a way to know when volatility may be injected, not as a guarantee of direction or result.
At 12:12 he defines the lookback: determine the range of the last 20 trading days, and do not count Sundays. The highest high and lowest low inside that range are all the model requires. At 13:11 he allows one refinement – if price is in a genuinely tight consolidation whose structure reaches beyond the last 20 days, consider a 40-day lookback, while acknowledging that this changes the model’s scope.
At 13:35 the next task is to identify what he calls the next draw on liquidity inside that dealing range: is price reaching for a liquidity pool, or rebalancing at a particular array. This supplies the bias. At 17:44 he states the rule that follows: if there is no obvious one-sidedness in the market, sit on your hands and wait. He repeats at 18:43 that nothing in trading is certain and he is not describing a 100% outcome.
How Liquidity Shapes the ICT Trade Plan
At 18:19 he lists what gets marked inside the 20-day lookback:
- For a bearish bias, the liquidity pools below old daily lows.
- For a bullish bias, the liquidity pools above old daily highs.
- For a bullish bias, the discount arrays inside the range; for a bearish bias, the premium arrays.
Terms such as “PD array”, “institutional order flow”, “premium” and “discount” belong to his own teaching framework. The recording assumes prior familiarity and does not fully define them in isolation; the article uses them because the model does.
ICT Trade Planning and New York Execution
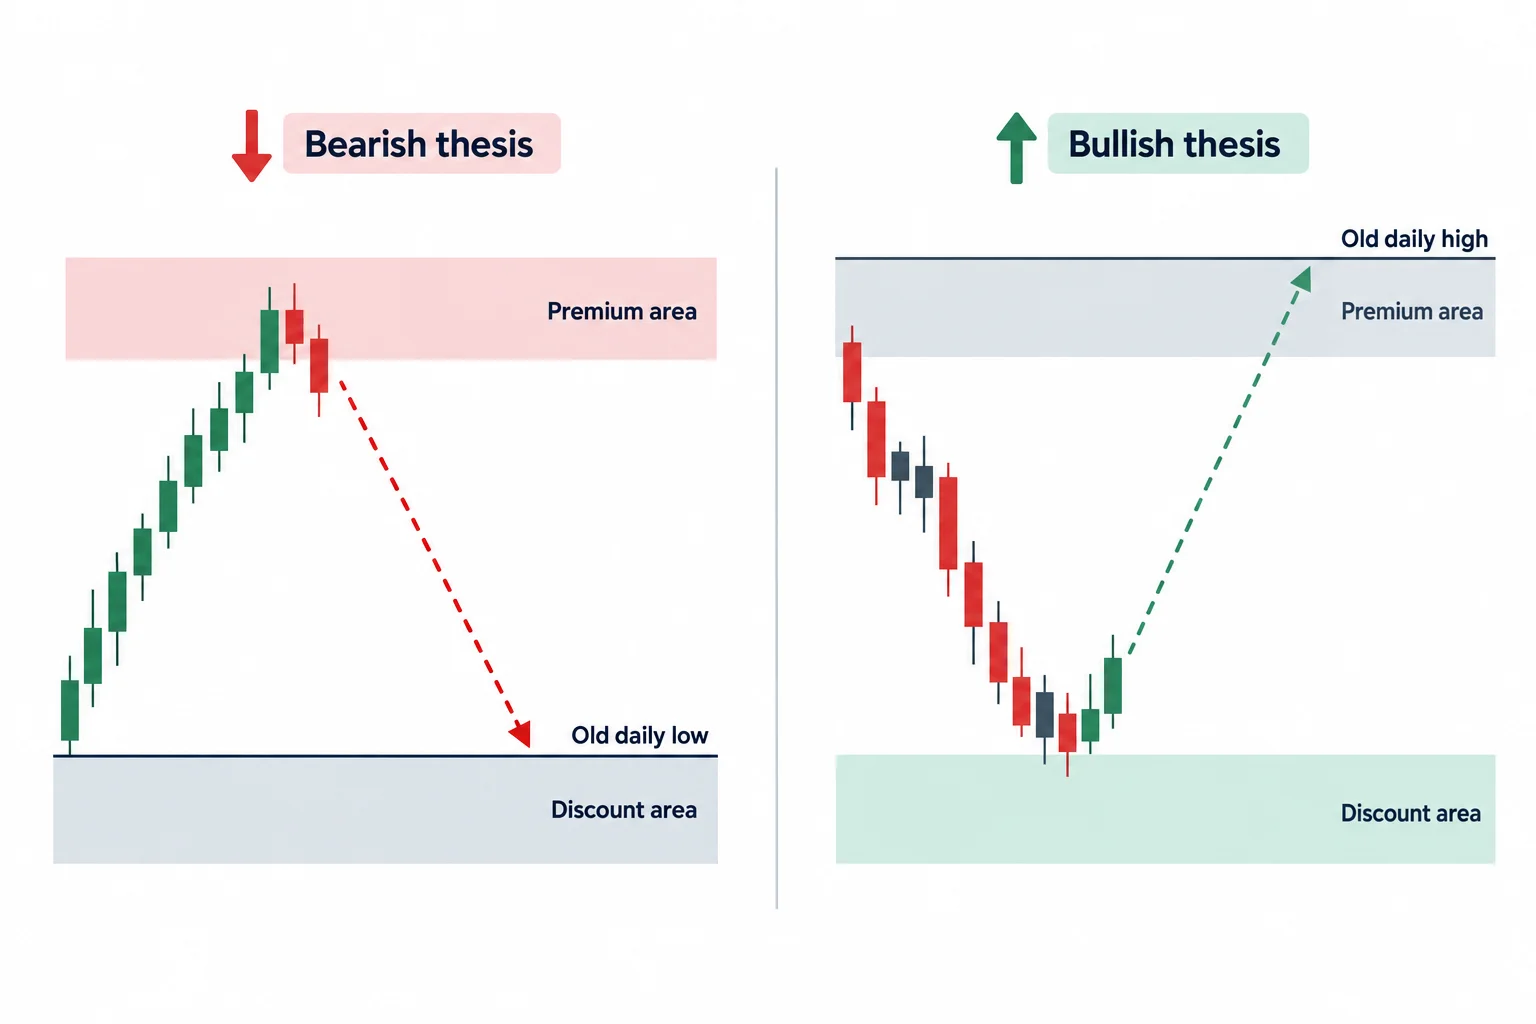
At 19:15 he moves to the trade planning stage. He describes waiting for convergence of two things: a move in price against the intended direction at a time the economic calendar suggests volatility may arrive, and the market being primed to expand. In his framing, the counter-move is what supplies liquidity for the trade in the opposite direction. For a bearish thesis he wants price to move up into a premium area and then trade lower; at 22:31 the bullish case is the mirror image – price moves down into a discount area, trades higher, then retraces.
The objective is the next logical old daily high for a bullish setup, or the next logical old daily low for a bearish setup, chosen so that the distance can accommodate the stated 15 to 20 pips. He notes at 23:37 that there will usually be several old daily highs or lows inside the range and that the relevant one is the one framing that potential. No chart prices or completed trade results are recoverable from the spoken source, so the lesson supports the rules – not evidence that any particular setup was filled or profitable.
Execution is narrowed at 24:00 to a specific window: 7:00 a.m. to 10:00 a.m. on a clock set to New York local time, which he calls the New York session kill zone. At 24:25 he says it can extend to 11:00 a.m. on days when a release such as a crude oil inventory number at 10:30 or another news item pushes it later, but that 7:00 to 10:00 is the primary window. From 24:53 he specifies a five-minute chart and expects an optimal trade entry to form inside a retracement – lower for a bearish setup, higher for a bullish one.
ICT Trade Entries Stops and Staged Exits
The model’s entry convention uses the 62% retracement level adjusted by five pips: five pips lower for a short and five pips higher for a long. At 25:33 he gives the short side – sell limit orders at that adjusted level, with all positions using the same entry price. At 28:00 he gives the long side in the same terms, using a buy limit order at the 62% level plus five pips.
Objectives are staged. From 26:00 he describes a limit order taking 15 pips on one position and a second taking 20 pips, with an optional third position for a longer-term objective. At 26:29 he is careful about what that means for risk: whatever risk percentage is chosen is divided across however many orders are used, so three positions on one idea each carry a third of the total allowance rather than tripling it.
Stops are placed beyond the session extreme plus or minus five pips. At 27:20 the short-side rule is the highest high of the 7:00 to 10:00 a.m. New York window plus five pips; at 28:45 the long-side rule is the lowest low of that window minus five pips. Both sides carry the same prohibition: if the trade stops out, no re-entry is taken that day. He calls it “one and done”, and at 27:53 explicitly rules out revenge trading.
At 29:10 he sets out stop-loss management as the trade progresses. When the position is 25% of the way to the expected objective, the stop can be reduced by 25%; at 50% of the objective, by 50%; and at 29:45, once the position reaches 75% of the expected profit objective, the stop must be at break-even. He notes that the break-even level has to cover transaction costs, including spread and commission, for traders using a commission-based broker. These are his proposed controls, not independently tested performance findings.
ICT Trade Plan Position Sizing and Loss Management
At 30:08 he gives the position size formula as account equity times risk percentage, divided by the stop distance in pips. He then works three examples, all on a $20,000 account risking 1.5% – a $300 allowance – with a 20-pip stop. At 32:09 that yields 150 micro lots at 10 cents per pip; at 33:25, 15 mini lots at $1 per pip; and at 34:23, one and a half standard lots at $10 per pip, which he says must be rounded down to one lot where the account only trades full lots. He adds that the 20-pip stop in the examples is a theoretical figure and the actual stop could be 15 or 30 pips – the formula is what stays constant.
Loss handling is prescribed rather than discretionary. At 34:43 he says that after a trade loses the full risked amount, the next trade drops the risk percentage by 50%, and the full allowance is only restored once half of the loss has been recovered. If the reduced-risk trade also loses, the next one is halved again, and that level is held until the prior loss is 50% recovered. At 35:34 he extends the same idea to winning: after five consecutive winning trades he also drops the risk percentage by 50%, on the argument that a loss is eventually likely and this levels the equity curve. He frames the goal as a smooth, stair-stepping equity curve rather than deep drawdowns, and says he personally uses five wins as the trigger, though he acknowledges he sometimes has losing streaks.
How ICT Algorithmic Theory Guides the Trade Plan
The second half begins at 43:23. At 43:28 he defines an algorithm as a set of instructions designed to perform a specific task or solve a problem, using everyday analogies such as a cooking recipe. He is using the term in that general sense – ordered instructions – and the recording offers no evidence that an automated trading program is operating. The model becomes an if/then checklist in which each condition either advances, pauses or rejects the setup; he says at 47:35 that each question lets you pause, negate the idea, wait for more information, or move to the next step.
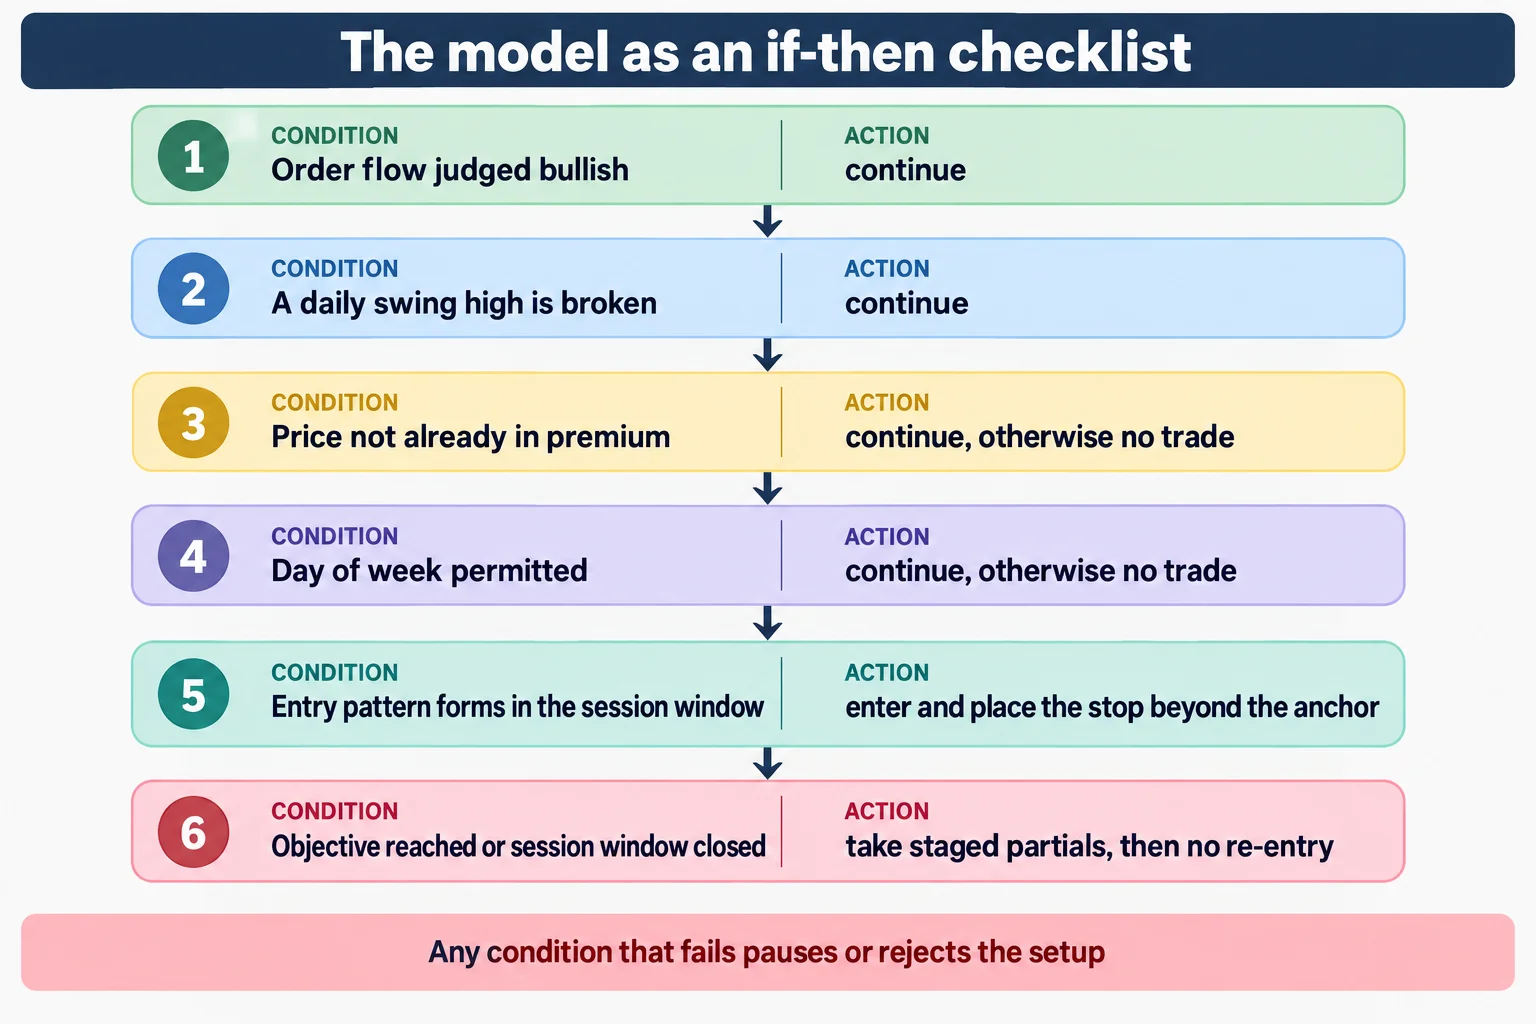
The bullish checklist starts at 47:01. The bearish version at 52:47 is, in his words, everything reversed. Read together, the two lists share this structure:
- Directional condition. Order flow judged bullish for the long version, bearish for the short.
- Structure condition. A daily swing high broken for the bullish checklist, a daily swing low broken for the bearish one.
- Location filter. If price is already in premium, the bullish checklist says there is no trade; the bearish checklist applies the same rule to discount.
- Day-of-week filter. Monday, Tuesday and Wednesday are the ideal days. Thursday is allowed only if price has not yet traded up to a previous high on the bullish side, or down to a previous low on the bearish side. Friday is excluded.
- Time filter. The entry pattern must form in the 7:00 to 10:00 a.m. New York window on a five-minute chart. After 10:00 a.m. the checklist states there is no trade.
- Entry and stop. At 49:38 the bullish entry is the 62% level plus five pips, with the initial stop five pips below the anchor low the Fibonacci was drawn from; at 54:13 the bearish entry is the 62% level minus five pips, with the stop five pips above the anchor high. Stopped out again means no re-entry that day.
- Exits. From 50:26 the first partial comes at the optimal trade entry anchor high, after which the protective stop moves up to lock in 5 to 10 pips; a second partial comes at the previous high or a Fibonacci extension; and the balance is closed at the symmetrical swing extension, which he describes as the same range used for the optimal trade entry, doubled.
At 56:40 he summarises where the model concentrates: primarily Monday, Tuesday and Wednesday setups in the New York open kill zone, with the conditional Thursday allowance, and no trades on Friday. He closes by telling students there is now no reason they cannot go and find setups meeting the criteria, and says that a diligent student of his earlier free material would have arrived at something close to this model. Earlier, at 38:33, he had given the practical next step: go back-test, collect a month or two of sample sets with the plan, and rewatch the lessons rather than waiting for sample sets from him.
Limits of the ICT Price Action Recording
Two limits follow from what this source actually contains, and both matter to how the model should be read.
First, the spoken source carries the rules but not the evidence. It names 15 to 20 pips as an objective, 62% and five pips as an entry convention, and one and a half percent as an example risk figure, but it contains no chart coordinates, no entry or exit prices, no fill records and no outcome for any specific setup. His references to finding “consistency” at 57:26 and his statement that the model is “very consistent” at the close are his own claims about his own teaching. They are reported here as his claims. Nothing in the recording independently tests the model, and the orders it describes sit in a demo account.
Second, the recording is presented over slides and charts, and those charts are not visible in this source. The structural names in the model – old daily highs and lows, liquidity pools, premium and discount arrays, order blocks, breakers, fair value gaps – are defined by their position relative to the 20-day range the student is told to mark, not by any level named in the audio. A reader who wants the worked illustrations has to watch the recording. It is also worth separating the two kinds of claim in the lesson: the position-sizing formula and the staged-risk reduction schedule are arithmetic that can be checked on paper, while the directional bias, the choice of the next draw on liquidity and the reading of institutional order flow are his interpretation of price delivery and remain part of his framework rather than established fact.
Watch the ICT Charter Price Action Model 1 Recording
The recording runs about 58 minutes 47 seconds and is the only primary source used here. It comes from the channel The Inner Circle Trader on YouTube. Because the model is presented on slides and the second half walks the checklist, watching it is the only way to see the levels and arrays named above.
ICT Price Action Model Resources
These are the sources checked for this article. The Federal Reserve calendar is the official publication of one of the scheduled-event sources the preparation stage depends on, and the CFTC pages are regulator and investor-educatio