
Key takeaways
ICT Charter Price Action Model 8 is a rules-based trading framework targeting 25 pips per week and 6% per month as unverified aspirations through five stages covering preparation, opportunity discovery, trade planning, execution, and management.
Read the full summary
ICT Charter Price Action Model 8 is a rules-based trading framework targeting 25 pips per week and 6% per month as unverified aspirations through five stages covering preparation, opportunity discovery, trade planning, execution, and management. It defines the dealing range from the highest high and lowest low of the previous 20 trading days excluding Sundays, uses scheduled medium- and high-impact events, market structure, liquidity draws, and PD arrays to frame weekly range expansion, then seeks bearish entries at premium fair value gaps or buy stops and bullish entries at discount fair value gaps or sell stops. Execution uses five-minute retracements during London Open or New York Open kill zones, one position, limit entries adjusted by 5 pips around PD-array convergence, and a 25-pip objective. After 50% of the objective, stop distance may be reduced by 25%, while at 75% the stop apparently moves to break-even, though the transcript wording requires video confirmation. Position sizing uses account equity multiplied by risk percentage and divided by stop loss in pips, with the worked example using $20,000 equity, 1.5% risk, a 15-pip stop, and $300 risk before rounding lot size down. After a full-risk loss, risk is halved until half the loss is recovered, another reduced-risk loss triggers a further cut, and five consecutive wins also trigger halved risk. The model can translate forex pips into futures handles or ticks, pursue one weekly setup or split a 25-unit objective into daily targets, and optionally skip Monday before considering Tuesday or Wednesday. EUR/USD and GBP/USD examples incorporate higher-time-frame imbalance, displaced price action, liquidity references, a five-minute fair value gap, and US Dollar Index comparison, but they are narrated illustrations rather than verified trades. ICT recommends demo execution, one qualified setup followed by no more trades that week, backtesting, multiple sample sets, chart annotation, journaling, and rule compliance rather than assuming a proven edge.
How we researched this article
BestProps used document-based research from primary firm sources, checked September 24, 2026. The complete source list, scope, limitations, and commercial-state record appear near the end of this article.
In ICT Charter Price Action Model 8 – Trade Plan & Algorithmic Theory, ICT presents a rules-based framework built around seeking a limited weekly price objective. The lesson describes a five-stage planning process, a 20-trading-day dealing range, calendar-driven volatility, five-minute execution patterns, and predefined trade management.
The stated aspiration is 25 pips per week and 6% per month. At 12:49 he adds that such a monthly return would double an account over the course of a year. Those figures are ICT’s targets for the model, not verified results or assurances. The transcript also repeatedly directs students toward demo execution, backtesting, sample collection, and discipline rather than frequent live trading.
Five ICT Model 8 Trade Plan Stages
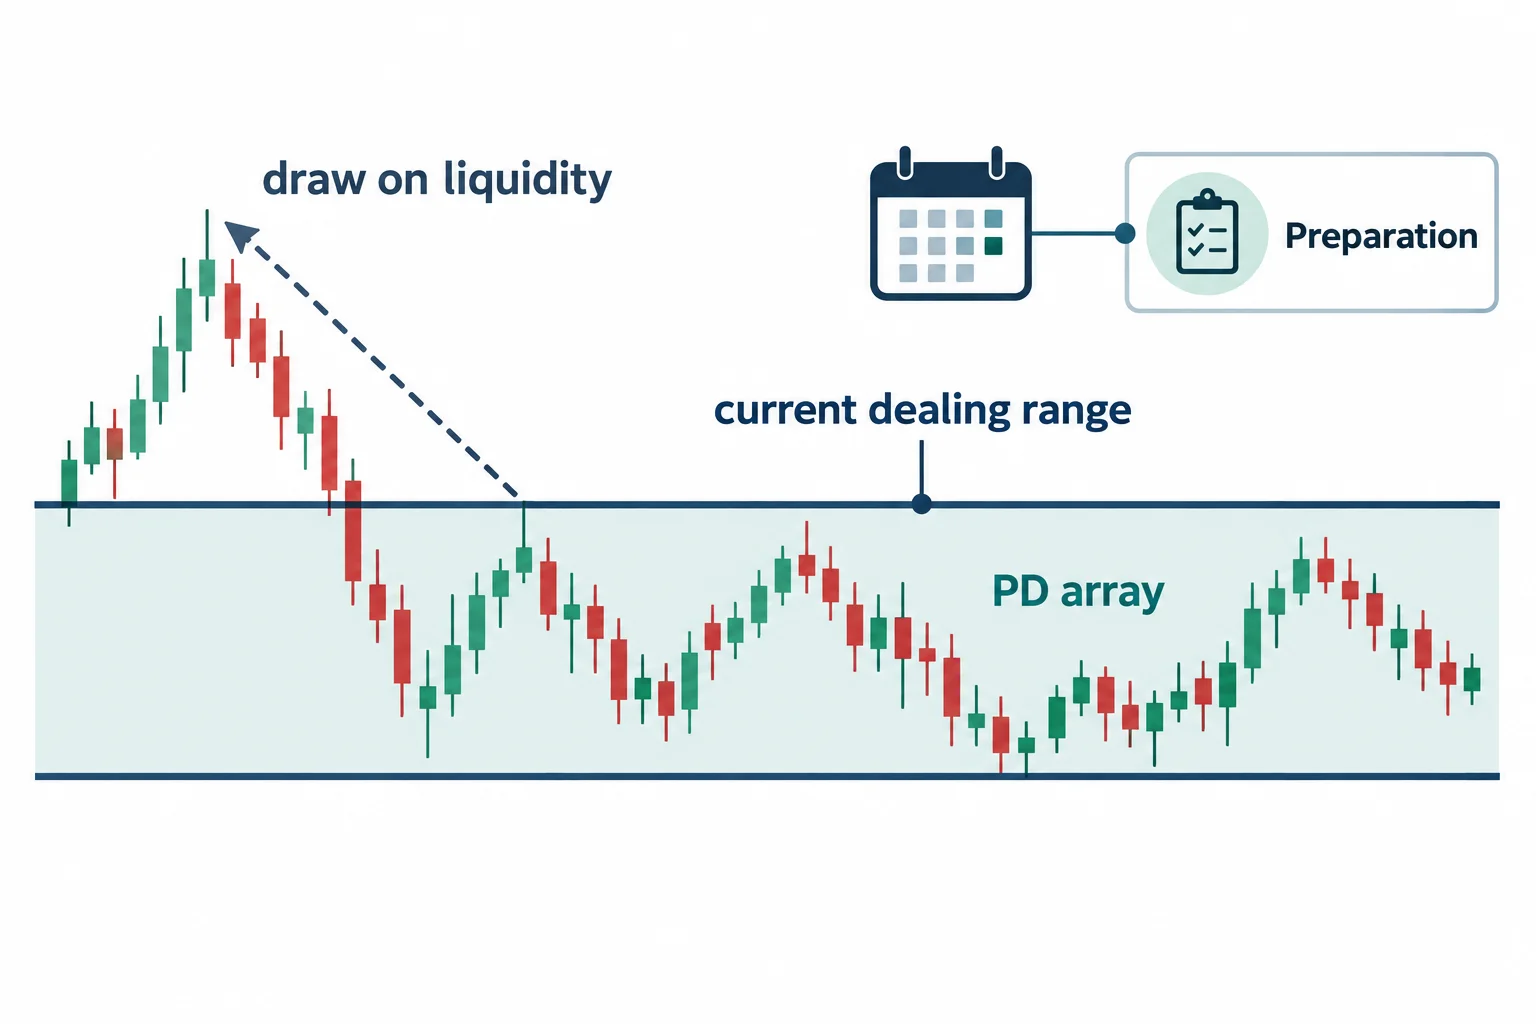
ICT introduces the framework through five stages of trade-plan development:
- Preparation
- Opportunity discovery
- Trade planning
- Trade execution
- Trade management
Prepare the ICT Trade Plan
Preparation begins by recording medium- and high-impact calendar events for the markets under review. ICT proposes comparing those events with current market structure to form an expectation about where the coming week’s range might expand.
At 1:05, he limits the analysis to the previous 20 trading days, excluding Sundays. The highest high and lowest low establish what he calls the current dealing range. Within it, the analyst looks for a possible “draw on liquidity,” such as an old high or low that price might approach.
The next step is to identify a “PD array” consistent with the proposed weekly bias. This is ICT terminology for a price-delivery reference used within his methodology. The plan then waits for a scheduled event that might introduce volatility and support movement toward that reference — at 2:01 he calls that the volatility injection the model waits for. This is a conditional interpretation, not proof that calendar events mechanically determine direction.
Find the Model 8 Price Range
During opportunity discovery, ICT looks for a range capable of delivering approximately 25 pips toward buy-side liquidity under a bullish reading or toward sell-side liquidity under a bearish reading. At 2:27 a fifteen-minute diagram is used to show the scale of that target, and he then refers to his own view of the pair at the time the material was recorded.
Two limits apply here. The transcript alone cannot verify the diagram’s levels, because the chart itself was not examined for this review. The automatic transcription renders the instrument in that passage as the euro; a confirmed pair label, and whether the diagram is spot foreign exchange or a eurodollar contract, cannot be established from the audio, so the instrument is not asserted here.
The central exercise is to train the eye to recognise a logically framed, limited move rather than trying to capture an entire weekly range.
Execute the Model 8 Trade Plan
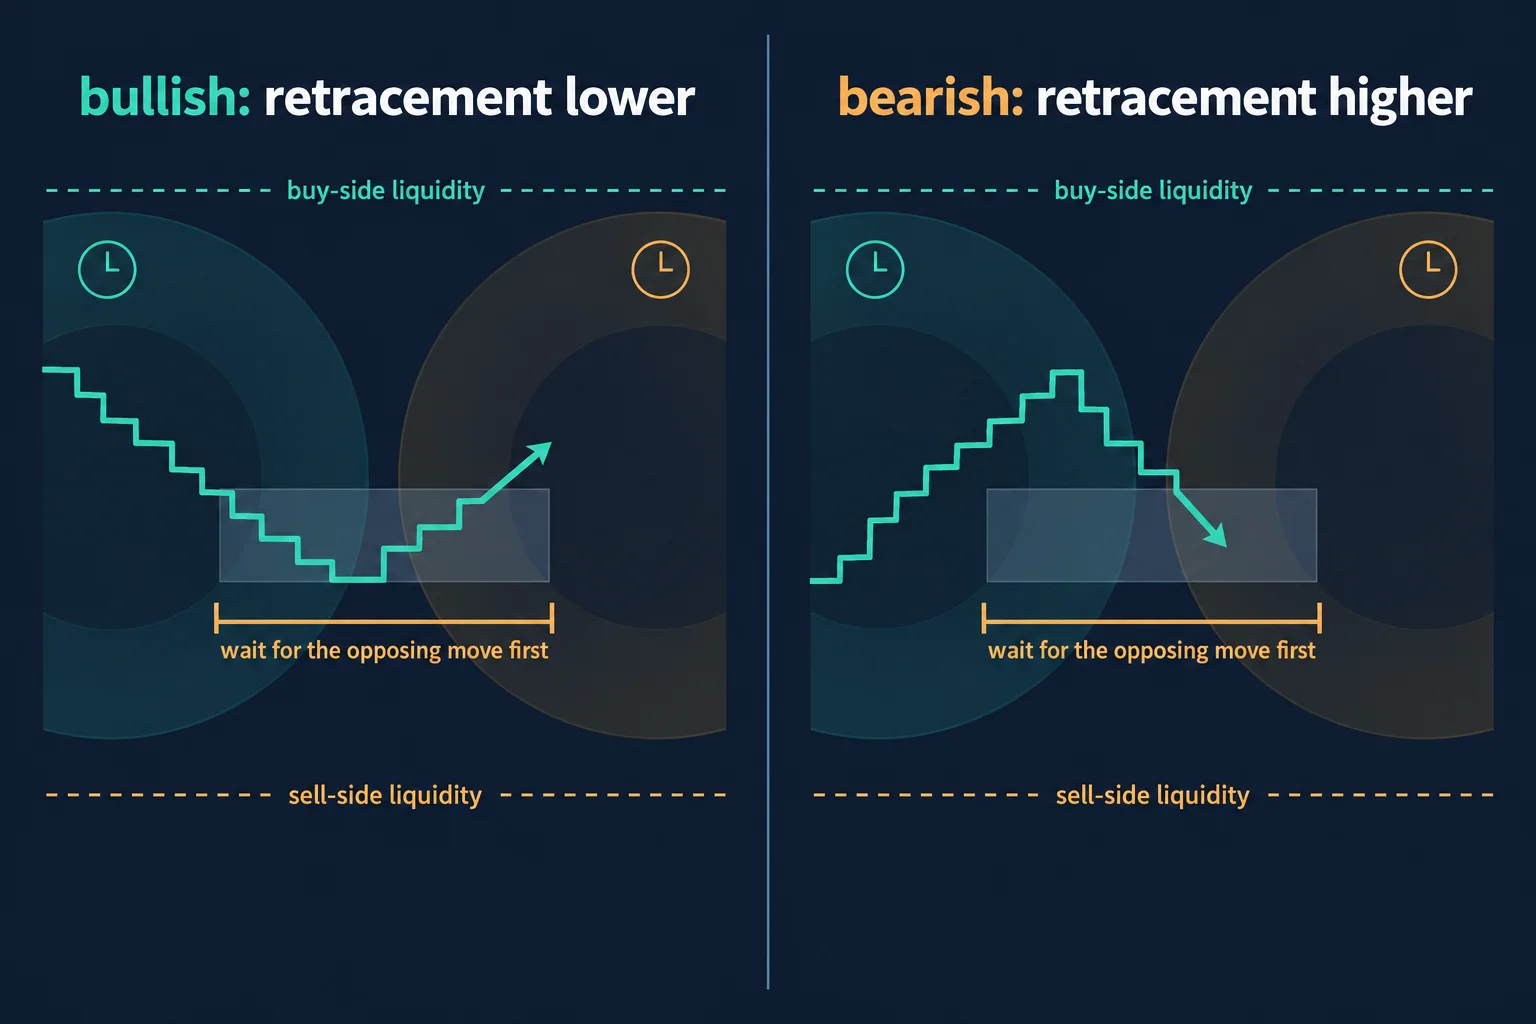
For a bearish plan, ICT wants price to move temporarily against the intended direction as a volatility event approaches. At 3:33 he describes the setup as a convergence of manipulation and price opposite to the trade bias at the time the calendar suggests a volatility injection, then selling at a premium fair value gap or around buy stops during what he calls stage-one or stage-two redistribution. The bullish version reverses that logic: buying at a discount fair value gap or around sell stops during reaccumulation.
Execution moves to the five-minute chart. At 4:19, ICT says a bearish entry would ideally form during a retracement higher in the London Open or New York Open “kill zone.” A bullish entry would form during a retracement lower in one of those periods. “Kill zone” is ICT’s term for a designated session window, not a guarantee of elevated opportunity.
Manage Model 8 Trades and Stops
The model uses one position and a 25-pip objective. At 5:05 and again at 5:23 ICT describes limit-order entries adjusted by five pips around the identified PD-array convergence — minus five pips for a sell limit, plus five for a buy limit — although the precise application depends on direction and chart context. At 5:38 he sets the objective as a single position closed by a 25-pip limit order, after which the trader waits for another opportunity. He instructs students to conduct these exercises in a demo account.
The stop-management section says that after reaching 50% of the expected objective, the stop distance can be reduced by 25%. At 75%, the rule as delivered is that the stop loss can be reduced by break-even. That is how the automated transcript renders the phrase, and it is not the wording the same rule takes in the neighbouring model; the transcript is therefore reported as transcribed rather than recast, and the intended mechanics of that step should be confirmed against the video.
ICT Model 8 Trade Sizing and Risk
ICT gives the following sizing relationship:
Position size = account equity × risk percentage ÷ stop loss in pips.
His worked example uses $20,000 of equity, 1.5% risk, and a 15-pip stop. That produces $300 of stated risk, which he converts into contract sizes between 7:44 and 8:37: 200 micro lots at ten cents a pip, 20 mini lots at a dollar a pip, or two standard lots at ten dollars a pip, always rounding down. He notes that earlier models in the series used a 20-pip stop and that this one uses 15 because it works from a five-minute chart. The example is educational arithmetic; actual contract specifications, pip values, costs, leverage limits, and order execution can differ by instrument and provider.
At 8:42, ICT adds an unusual adaptive-risk rule: after a full-risk loss, cut the risk percentage in half and restore it only after recovering half of the loss. Another loss at the reduced amount triggers a further reduction. At 9:09 he also proposes halving risk after five consecutive wins, reasoning that a losing stretch is likely eventually and that the adjustment keeps the equity curve smooth. The transcript supplies no test results establishing how these rules perform.
ICT Model 8 Weekly Price Example
ICT says the fixed objective can be translated from forex pips into futures handles or ticks. At 10:40 he illustrates that in index futures, describing a 25-handle weekly objective split into roughly five handles per session from Monday through Friday, with the trader leaving the screen once the daily objective is captured. He presents that as a way to keep the weekly threshold low rather than as an equivalent risk profile. He also offers either pursuing one weekly setup or dividing a 25-unit weekly objective into smaller daily objectives; these are conceptual alternatives, not equivalent risk or return profiles.
A notable part of the lesson is the option to let Monday trade without participation. Monday’s action can provide more information before considering Tuesday or Wednesday, which he names as the days he favours. The intended forecast is not the weekly closing price; it is the side on which meaningful range expansion appears more likely.
ICT later discusses the British pound against the US dollar using a higher-time-frame imbalance that he dates to 26 April 2022, displaced price action, liquidity references, a five-minute fair value gap, and an intermarket comparison with the US Dollar Index that he calls SMT at 20:13. He frames a hypothetical short and a hypothetical $5,000 account risking 1%, and describes a target roughly twenty pips below the entry plus spread; the automated transcript’s rendering of the figure he states for the return on that hypothetical is unclear, so no percentage or dollar result for it is asserted here. Because the recording’s charts cannot be examined from its audio, and because spreads, fills and what followed are outside the transcript, this should be read as ICT’s narrated illustration, not a verified trade record.
Build ICT Model 8 Trade Discipline
The most transferable theme is behavioural restraint. From 22:23 onward, ICT encourages students to practice finding one qualified demo setup and then stop executing for the week. Chart study and review may continue, but repeated button-pushing would defeat the exercise. At 22:37 he adds that a trader who does only that would outperform the fund managers held up as the upper echelon; the recording offers no evidence for the comparison and it is reported here as the speaker’s assertion.
Along the way he also comments on audience expectations, citing an informal poll of his own social-media following in which most respondents reported earning less than $50,000 a year while expecting very large trading returns. That is his characterisation of his own audience, not a controlled survey, and it appears here only because it frames why he argues for a modest weekly objective.
He closes by recommending backtesting, multiple sample sets, chart annotation, and journaling. A general educational interpretation is that Model 8 functions as a constraint-based research routine: define context, wait for specified conditions, cap the objective, standardise risk, and record whether the rules were actually followed. That process can be evaluated without accepting the claimed monthly target or assuming the model has a proven edge.
Watch the original recording
The video mapped to this article is ICT Charter Price Action Model 8 – Trade Plan & Algorithmic Theory, a public upload on the channel The Inner Circle Trader. Its watch page records an upload date of 5 February 2024 Pacific time, which falls on 6 February 2024 in UTC — the later of the two is the date carried in this campaign’s inventory — and a running time of about 28 minutes 55 seconds. Every timestamp link above points into that recording. The transcript used for this guide was produced by local automatic speech recognition of the complete original audio rather than from YouTube captions, so its wording, instrument names and numbers should be treated as automated. The recording’s charts and on-screen annotations were not examined by this review.
Reference sources and provenance
These references support specific points in the guide above. None of them is an ICT publication, none endorses or tests the approach, and none is offered as evidence for the statements made in the recording.
Scheduled releases as timing, not direction
Model 8 pairs a weekly directional bias with a scheduled event and treats that release as the volatility injection it waits for. Firms that fund traders commonly restrict what may be held through those same windows: BestProps’ own news-trading rules page documents, among others, an FTMO rule requiring targeted instruments to be flat from two minutes before a scheduled release until two minutes after it, and records that a stop or target triggering inside that window is treated as a breach of the account agreement.[2] That page is BestProps’ own rules documentation, cited for the constraint rather than as an endorsement or a test of the model.
Why a pip objective is not a performance record
A stated weekly target of 25 pips, and the monthly percentage built on it, describe an intention rather than a measured result. Investor.gov, the U.S. Securities and Exchange Commission’s investor education site, describes day trading as “extremely risky” and states that it “can result in substantial financial losses in a very short period of time”.[3] That framing is quoted as general risk context for a plan built around frequent intraday participation; it makes no claim about the speaker or his statements.
Base rates in the market the examples use
The worked sizing example and the case study are both currency pairs, so the Commodity Futures Trading Commission’s retail foreign-exchange material is relevant context: the agency states that two out of three retail foreign exchange traders lose money each quarter.[4] The lesson itself reports no independently verified result for any of its demonstrations.
Hypothetical and demo performance
The recording repeatedly specifies demo execution, and its sizing and management passages are worked examples rather than an audited account history. U.S. rules on the presentation of simulated or hypothetical trading performance require disclosure that such results “have certain inherent limitations” and that simulated programs “are designed with the benefit of hindsight”.[5] That rule governs advertising by regulated advisers, not a YouTube lesson, and is cited here only to explain why a demo-account illustration is not evidence of a repeatable edge.
Source, method and limits
This article is grounded in the full timestamped transcript of the mapped upload, identified in the article metadata by video ID F-8hPvSyIB4 and by that transcript’s SHA-256. The transcript was produced by local automatic speech recognition of the complete original audio and is not human-reviewed captioning. The recording’s charts and on-screen annotations were not examined by this review, and nothing on this page asserts an account size, balance, fill, position size or net result for any real trade. Where the automatic transcription is ambiguous — the break-even stop wording at 6:23, the instrument name in the opportunity-discovery diagram, and the figure stated for the GBP/USD illustration — the ambiguity is recorded rather than resolved by guesswork. YouTube’s own help documentation explains the embedding setting that determines whether the player above is playable on an external site.[6]
Sources
- [1] Primary source: ICT Charter Price Action Model 8 – Trade Plan & Algorithmic Theory (The Inner Circle Trader)
- [2] BestProps: Prop firm news trading rules
- [3] Investor.gov (U.S. Securities and Exchange Commission): Day Trading
- [4] U.S. Commodity Futures Trading Commission: Forex frauds
- [5] 17 CFR 4.41: Advertising by commodity pool operators and commodity trading advisors
- [6] YouTube Help: Embed videos & playlists
Any ICT, smart-money or third-party indicator, script, transcript, note set, spreadsheet or social summary circulating outside the publishing channel’s own upload page is unofficial and untested here. Dealing range, draw on liquidity, PD array, fair value gap, kill zone, stage-one and stage-two redistribution, and SMT are the speaker’s own framework and terminology. No win rate, drawdown figure, fill, position size or account result is claimed anywhere in this article.
Leveraged foreign-exchange and futures trading carries substantial risk. A fixed 25-pip objective, a stop reduced by 25% at half the objective, a stop adjustment at 75% of the objective and a risk percentage halved after a full loss all change the distribution of outcomes, and none of them removes slippage or the possibility of loss. This article is educational commentary, does not provide individualised financial advice, and reports no outcome from any session or account.