
Key takeaways
ICT Charter Price Action Model 7 is a bearish price-delivery framework for identifying sell-side low-resistance liquidity runs across position trading, swing trading, short-term trading, day trading, and scalping, without claiming a verified edge.
Read the full summary
ICT Charter Price Action Model 7 is a bearish price-delivery framework for identifying sell-side low-resistance liquidity runs across position trading, swing trading, short-term trading, day trading, and scalping, without claiming a verified edge. The sequence starts with a monthly, weekly, or daily downside liquidity objective such as equal lows, treats the distance to it as the range of opportunity, waits for a rally into buy-side liquidity or a premium array, identifies the highest relevant reaccumulation swing low, and requires a break below that specific low for a qualified bearish market structure shift. After sell stops are taken, price may retrace toward fair value defined here as prior down-close candle bodies, a fair value gap, or another premium or discount array before seeking the original downside objective. Analysis can refine through four-hour, hourly, and 15-minute charts, but lower-timeframe fractals do not replace the higher-timeframe narrative. The retrospective USD/CHF walkthrough uses weekly liquidity and a bullish order block for context, a daily downside terminus and nested market maker sell models, then hourly balanced price ranges, breaks, and retracements to prior candle areas. ICT recommends mastering one model through repeated observation, waiting when the liquidity narrative is unclear, invalidating the profile if price continues through the level expected to contain it, and avoiding predictions about the bounce, consolidation, or continuation after the limited liquidity objective is reached.
How we researched this article
BestProps used document-based research from primary firm sources, checked September 24, 2026. The complete source list, scope, limitations, and commercial-state record appear near the end of this article.
In ICT Charter Price Action Model 7 – Universal Trading Model, ICT presents a framework for studying bearish price delivery and what he calls “sell-side low-resistance liquidity runs.” The lesson links higher-timeframe liquidity objectives, market maker profiles, market structure shifts, fair value, and lower-timeframe fractals. This guide follows the recording in order — the model’s definition, its structure criterion, the return to fair value, the liquidity distribution profile, the top-down refinement and the chart example — and then states plainly what the recording does and does not establish. Every timestamp below was matched to the timestamped transcript of that recording; the charts themselves were not examined.
The word “universal” refers to ICT’s view that the framework can be applied across position trading, swing trading, short-term trading, day trading, and scalping. It does not mean that every market produces the setup at all times, nor does the transcript establish that the model has a verified trading edge.
ICT Price Action Model 7 Core Idea
ICT introduces the model at 0:14 as a universal trading model, applicable in his words to position trading, swing trading, short-term trading, day trading and scalping. Its first step is identifying a higher-timeframe draw on liquidity below the current market. The distance between the observed price area and that downside objective becomes what he calls the “range of opportunity.” Equal lows are one example he uses for a potential pool of sell-side liquidity, given at 2:42.
At 1:03 he notes that there are two market maker profiles, a buy model and a sell model, and that both contain a sell-side delivery — “the portion of the model or profile that goes lower seeking liquidity” (1:13). Model 7 works that portion only. The lesson examines bearish delivery within both of those templates:
- A market maker sell model can enter a distribution phase after price has rallied toward higher-timeframe liquidity.
- A market maker buy model can still contain a sell-side leg as price seeks a discount-area objective before any possible bullish phase develops.
Thus, Model 7 is not simply a claim that price must remain bearish indefinitely. It isolates the portion of a larger profile in which ICT expects price to seek lower liquidity. He repeatedly says that the subsequent bounce, consolidation, or continuation need not be predicted. The pattern he wants in return is fair value, which he treats as his default reference after a liquidity run, and at 1:01:09 he restates the same span as a sequence: an area of accumulation, a first redistribution, a second redistribution, and a sell-side liquidity pool where offsetting would occur.
One qualification matters and he gives it explicitly at 4:26: on lower timeframes such as an hourly or 15-minute chart, price does not necessarily have to return to every one of those levels. If it skips one, he says the following opportunity can produce a wider price swing rather than a smaller one. That is his expectation about the profile, not a measured relationship.
ICT Price Action Market Structure Rules
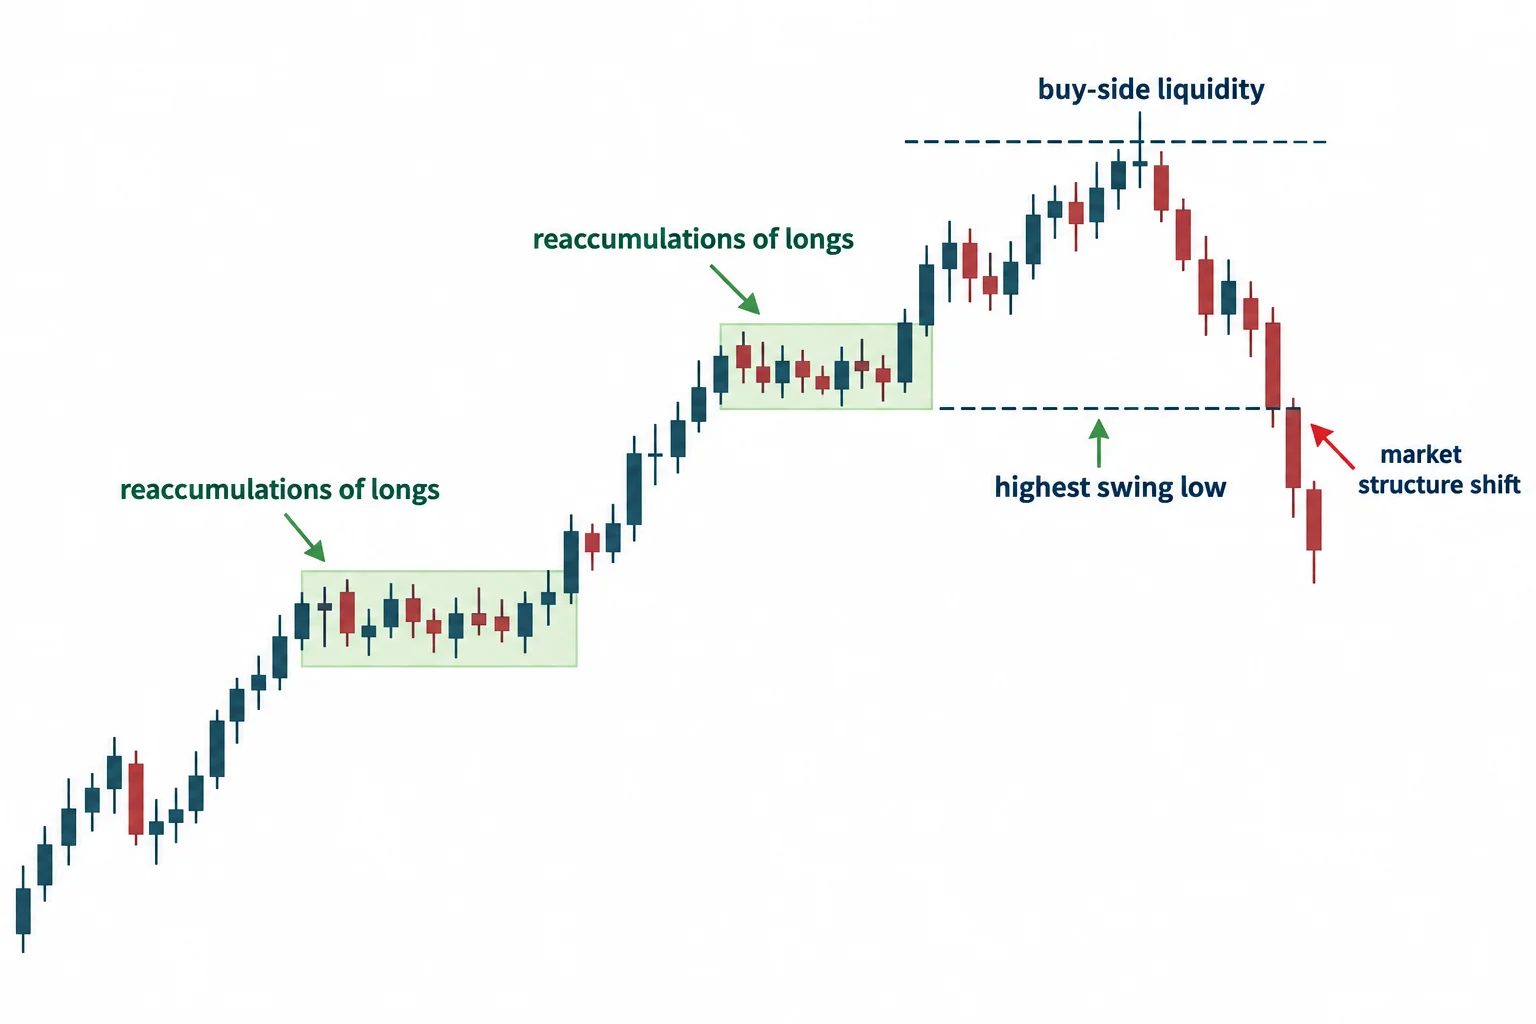
A central part of the lesson is ICT’s distinction between an ordinary stop run and a qualified bearish market structure shift, and the clearest statement of it comes at 12:45. A rallying structure is made up of an initial consolidation followed by one or more “reaccumulations of longs.”
Under his framework, the significant reference is the highest swing low associated with those reaccumulations before price reaches the anticipated buy-side liquidity or premium objective. After that upper liquidity event, ICT wants to see price break below this particular swing low. He emphasizes at 13:14 that the break is defined relative to a specific price point rather than to any broken high or low, and at 16:32 he puts it bluntly: if a candidate break does not fit his criteria, then it is not a break in market structure.
If price then runs sell stops and retraces, ICT looks for a return to what he calls fair value. At 12:20 the sequence is stated plainly: once the sell stops are taken below the swing low, “then we wait for fair value to be traded back to.” In this lesson that may mean the bodies of down-close candles around the earlier swing low, a fair value gap, or another relevant premium/discount array, and he treats the return as the point where he pairs an order for a short. These are ICT-specific interpretations rather than universally accepted definitions of market structure or fair value. He is also explicit that identifying the turning point in advance takes experience and declines to teach it: at 11:21 he says the low-risk entry requires a high level of experience.
Why the ICT Model Sequence Matters
- Form a higher-timeframe bearish narrative and identify the downside liquidity objective.
- Allow the preceding rally to reach buy-side liquidity or another premium array.
- Watch the highest relevant reaccumulation swing low.
- Require a break below that level before treating the move as ICT’s qualified structure shift.
- After sell-side liquidity is taken, observe whether price retraces toward the identified fair-value area.
- Use the original downside liquidity draw as the limited objective of the model rather than assuming the next market phase.
ICT also argues that a move which breaks through deeper reaccumulation levels may indicate a larger distribution leg. That is his market interpretation, not an outcome demonstrated statistically in the recording.
The lesson also presents a weekly liquidity distribution profile at 5:59 as the tool that pairs previous buy-side and sell-side delivery, with a vertical line marking the midpoint of the overall expected price swing; he had already described drawing that midpoint out through the curve at 4:00. He calls it the bridge that made sense of Wyckoff for him at 19:25, while insisting the comparison is not apt: in his words at 19:35, Wyckoff “never got this close.” At 13:36 he describes this profile as something that will not be shown by anyone else — a claim about his own material, reported here as such, since the recording contains no comparison against other published work.
ICT Price Action Model Across Timeframes
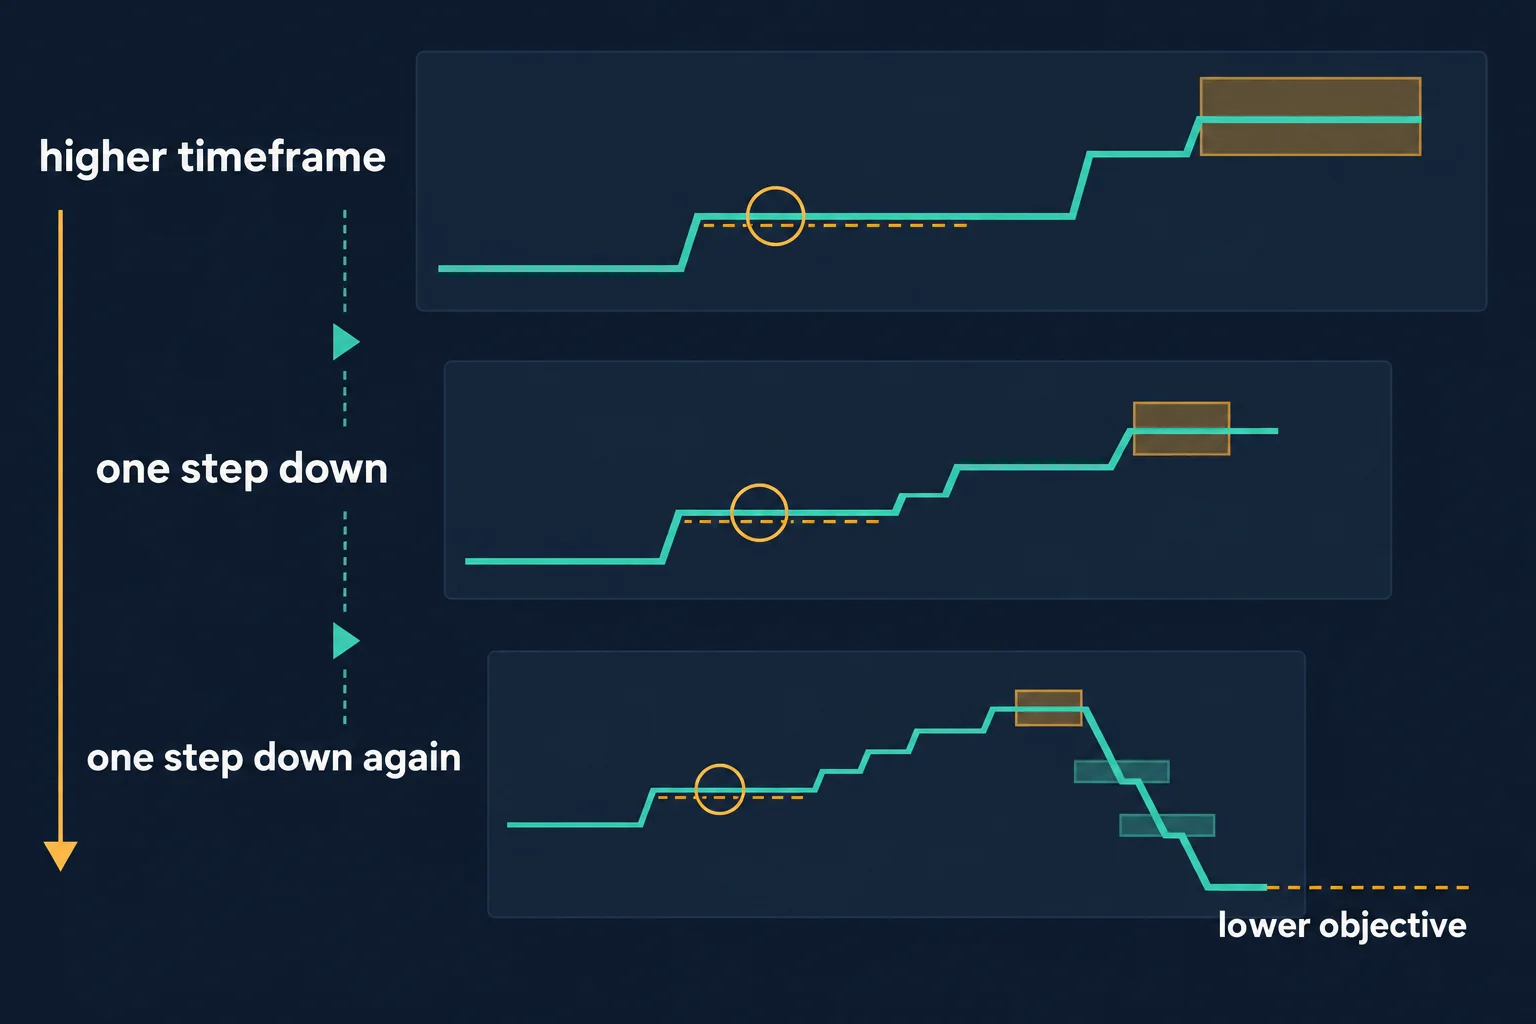
At 28:33, ICT moves from the weekly framework to daily and intraday charts. His proposed workflow starts with a monthly, weekly, or daily narrative, then refines the same structure on four-hour, hourly, and sometimes 15-minute views.
The refinement step itself is described at 28:48, where the range of opportunity shifts down to the four-hour and 60-minute charts, and at 29:01 simply as refining the fractal. The lower timeframe is not supposed to replace the higher-timeframe premise. Instead, it supplies a more detailed version of the same sequence: consolidation, liquidity run, distribution or redistribution, retracement, and another attempt toward sell-side liquidity. ICT cautions that lower-timeframe moves can be short-lived — at 27:09 he calls the liquidity runs seen there sporadic and very short term in nature — and gives priority to the higher-timeframe context.
ICT Price Action Trade Walkthrough for USD/CHF
The chart example begins at 1:02:19 with a weekly chart of the pair he calls the dollar–Swiss — conventionally USD/CHF, the U.S. dollar against the Swiss franc, though the recording never names the franc. ICT describes both a completed buy-side profile and a sell-side profile, then identifies equal highs, a weekly bullish order block, and lower liquidity references. The transcript records several quoted levels, but the chart itself is not available for independent visual confirmation here.
On the daily chart, ICT grades successive areas of distribution and defines a downside “terminus” that he says is predetermined rather than identified after the fact — an assertion about his method, not something the recording demonstrates. At 1:16:57, he characterizes several smaller swings as nested market maker sell models. On the hourly chart at 1:22:12, he points to repeated reactions around what he calls a balanced price range, followed by breaks and retracements toward prior candle areas, and at 1:23:12 he flags a rally that he says was outside his model and would have stopped a short taken earlier.
Several levels are quoted as he works down the timeframes. On the weekly chart he reads the relevant open as 95.47 at 1:04:55 and calibrates the bullish order block to 95.40 at 1:07:19; he also names 95.45 as a specific price point on that order block at 1:11:53. On the daily chart he identifies a down-close candle whose lowest close is 95.42 and forms a rejection block from 95.40 to 95.42 at 1:12:27, then points out at 1:15:04 that the low on that chart was in fact 95.42.
The structure criterion reappears in the example at 1:23:25: three successive reaccumulations are counted, the highest is identified at 1:23:32, and its break is called the market structure shift at 1:23:34, with the rally afterwards marked as the low-risk entry at 1:23:39.
He then returns to the daily chart at 1:26:47, reads a short-term low as 95.78 and rounds it to 95.75 at 1:26:54 and 1:27:08, and grades 10, 20 and 30 below that as 95.65, 95.55 and 95.45 at 1:27:27, noting at 1:28:02 that price went three pips below that to 95.42. He later reads a balanced price range from a candle high at 97.24 at 1:18:28 and again as delineated by 97.47 and 97.23 at 1:19:13, then reads a daily candle high at 97.62 and a low at 97.68 at 1:29:05 and 1:29:25, notes they are six pips apart, and says the high came in at 97.67, one pip away from his predetermined fair value gap, at 1:29:53.
Two things can be said about those figures without leaving the source. First, they are internally consistent in a way that reduces the chance of a mis-transcription: the recording’s own grading from 95.75 down to 95.65, 95.55 and 95.45 proceeds in equal ten-unit steps, and its statement at 1:28:02 that price travelled three below 95.45 lands on 95.42, the same level it had already derived from the daily rejection block. Second, one discrepancy is left visible rather than smoothed over: the same range is read as 97.24 at 1:18:28 and as 97.23 at 1:19:13. Both readings are as spoken. A related grading convention appears twice in the lesson — at 1:21:46 he describes measuring 10, 20 and 30 below each new low to project how far price might reach toward its terminus. All of the figures above are reproduced exactly as the automatically transcribed recording renders them; the lesson quotes its levels in spoken shorthand, and the transcript does not establish the quote scale or the instrument convention behind them, so no level here is restated as a currency price.
The educational takeaway is the nesting process: a weekly objective supplies context, the daily chart defines the broad opportunity range, and four-hour or hourly structures are used to inspect redistribution within that range. Because this is a retrospective chart explanation, the transcript alone cannot verify entries, fills, transaction costs, or what a viewer could have recognized in real time. The recording contains no statement, log or independent record of an entry, a fill, a stop, a target or a profit on this or any other market, so the arithmetic above checks the transcription of numbers the speaker said and says nothing about whether the method works.
Practice the ICT Trading Model With Restraint
ICT repeatedly discourages trying to master every model simultaneously. At 45:08, he recommends picking one model out of the twelve he says he has provided and concentrating on that one rather than applying all of them, and he describes his own path from one specific setup to a model he no longer needed indicators for. He also acknowledges failed scenarios: if price continues through the level that should contain it, the proposed profile is invalidated and the trader must reassess.
Another recurring theme is waiting. At 51:20 he describes the practical handling of uncertainty: if the things he is looking for materialise he engages, if they do not he waits for more information, and if the structure unravels the idea is over. He is equally clear about invalidation in two places — in the abstract discussion at 51:51, where a short that gets stopped out and a run back above the equal highs means the profile he was tracking was never there, and inside the example at 1:17:58, where he says a continuous rally would completely negate the whole profile and put it on the back burner. This is a useful general analytical principle independent of his terminology: a model should specify both what confirms its premise and what invalidates it. It should not be treated as certainty about the next price movement.
He also touches on method and provenance in passing. At 15:02 he recounts learning to read the tape as a commodity trader, watching a scrolling ticker for the bond and S&P markets — biography offered to explain how he internalised price delivery, and he says so himself (“I’m not saying you should be doing this”); it is not evidence about how markets behave.
Watch the original recording
The video mapped to this article is ICT Charter Price Action Model 7 – Universal Trading Model, a public upload on the channel The Inner Circle Trader. Its watch page records a publish time of 30 January 2024, 16:00 Pacific, which is 31 January 2024 in UTC — the reason the upload can appear under two different calendar dates depending on which one is quoted — and a running time of about 1 hour 32 minutes. It remains publicly available and playable in an embed. Every timestamp link above points into that recording. The transcript used for this guide was produced by local automatic speech recognition of the complete original audio rather than from YouTube captions, so its wording and numbers should be treated as automated. The recording’s charts and on-screen annotations were not examined by this review.
Reference sources and provenance
These references support specific points in the guide above. None of them is an ICT publication, none endorses or tests the approach, and none is offered as evidence for statements made in the recording.
What the recording does and does not establish
The lesson is an interpretation of historical charts, not a measured result. Investor.gov, the U.S. Securities and Exchange Commission’s investor education site, describes day trading as “extremely risky” and states that it “can result in substantial financial losses in a very short period of time”.[2] That is quoted as general risk context for a method built on intraday execution; it makes no claim about the speaker.
Why a retrospective chart walkthrough is not a performance record
The USD/CHF sequence is recounted from the speaker’s own annotations, and the recording supplies no account statement, trade log or independently verified fill. U.S. rules on presenting simulated or hypothetical trading performance require disclosure that such results “have certain inherent limitations” and that simulated programs “are designed with the benefit of hindsight”.[4] That rule governs advertising by regulated advisers, not a YouTube lesson, and is cited only to explain why a chart read aloud after the fact is not evidence of a repeatable edge.
Base rates in a currency example
The illustration is a currency pair, so the Commodity Futures Trading Commission’s retail foreign-exchange material is relevant context: the agency states that “two out of three retail foreign exchange traders lose money each quarter”.[3] Nothing in the recording reports a verified outcome for any session or account.
Source, method and limits
This article is grounded in the full timestamped transcript of the mapped upload, identified in the article metadata by video ID _7oZZ2bhEGU and by that transcript’s SHA-256. The transcript was produced by local automatic speech recognition of the complete original audio and is not human-reviewed captioning. Three limits follow. First, the recording’s charts and their annotations were not examined by this review, so range boundaries, candle bodies, rejection blocks, balanced price ranges and fair value gaps are reported as the speaker’s reading of those charts rather than as verified chart facts. Second, the quoted levels are reproduced as spoken shorthand without a scale the transcript establishes, and the internal discrepancy between 97.24 and 97.23 is left visible. Third, the speaker’s account of how the algorithm pairs previous levels of buy-side and sell-side delivery, his description of the liquidity distribution profile as unique to him, and his comparisons with Wyckoff are reported as his framework and his own claims, not as established fact. YouTube’s own help documentation explains the embedding setting that determines whether the player above is playable on an external site.[5]
Sources
- [1] Primary source: ICT Charter Price Action Model 7 – Universal Trading Model (The Inner Circle Trader)
- [2] Investor.gov (U.S. Securities and Exchange Commission): Day Trading
- [3] U.S. Commodity Futures Trading Commission: Forex frauds
- [4] 17 CFR 4.41: Advertising by commodity pool operators and commodity trading advisors
- [5] YouTube Help: Embed videos & playlists
Any ICT, smart-money or third-party indicator, script, transcript, note set, spreadsheet or social summary circulating outside the publishing channel’s own upload page is unofficial and untested here. Market maker profile, reaccumulation, redistribution, rejection block, balanced price range, fair value gap, premium array, discount array, sell-side liquidity run and range of opportunity are the speaker’s own framework and terminology. No win rate, drawdown figure, fill, position size or account result is claimed anywhere in this article.
Leveraged foreign-exchange and futures trading carries substantial risk. Identifying a liquidity objective below the market and waiting for a structure break does not remove slippage, timing error or the possibility of loss, and no chart sequence can be replayed with the certainty available when looking back at it. This article is educational commentary, does not provide individualised financial advice, and reports no outcome from any session or account.