
Key takeaways
ICT Charter Price Action Model 6 Amplified, framed as Model 6.1, teaches a probabilistic buy-side low-resistance liquidity-run framework that starts with a higher-time-frame premium objective or prior high, then nests stage, setup, and entry-pattern time frames such as weekly, daily, and 4-hour, daily with 4-hour or 60-minute, and 4-hour with 60-minute or 15-minute.
Read the full summary
ICT Charter Price Action Model 6 Amplified, framed as Model 6.1, teaches a probabilistic buy-side low-resistance liquidity-run framework that starts with a higher-time-frame premium objective or prior high, then nests stage, setup, and entry-pattern time frames such as weekly, daily, and 4-hour, daily with 4-hour or 60-minute, and 4-hour with 60-minute or 15-minute. Candidate entry structures include fair value gaps, filled liquidity voids, sell-stop sweeps, optimal trade entries, bullish order blocks, and market-structure breaks. ICT grades the projected origin-to-terminus range using a first reaccumulation near 20–30% and conceptual quadrants at 25%, 50%, 75%, and 100%, with possible 1.27 and 1.68 Fibonacci extensions. Higher-time-frame moves may show 2 reaccumulations while lower-time-frame moves may show 1, and consolidation within about 30 pips of the terminus generally suggests no separate second reaccumulation, alongside 10-, 20-, and 30-pip stop-sweep concepts intended mainly for forex. The lesson recommends redrawing multiple time-frame combinations and reviewing historical charts, but provides no verified profitability, statistical validation, visible chart levels, executions, or trade outcomes.
How we researched this article
BestProps used document-based research from primary firm sources, checked September 24, 2026. The complete source list, scope, limitations, and commercial-state record appear near the end of this article.
What the ICT Model 6 Amplified Lesson Covers
In ICT Charter Price Action Model 6 – Amplified Lesson, ICT revisits the initial Model 6 presentation and describes this installment as an addition (effectively “6.1”) rather than a separate model — at 0:16 he says plainly, “this is like 6.1.” The lesson focuses on the buy side of what he calls a low-resistance liquidity run: identifying a higher-time-frame objective, dividing the prospective move into smaller fractals, and pairing time frames to study possible long setups. He also says at 1:14 that this is his “go-to” model, and explains why at 1:22: he began in the commodity markets without understanding short selling, so he focused on buying only. He frames his reason at 2:26 as a view that markets are “predisposed to rally” because they attract participants who want to own them. That is his stated rationale rather than an established property of markets.
This is a conceptual lecture built around diagrams that are not visible in the transcript. Accordingly, the discussion below explains ICT’s stated framework without reconstructing unseen price levels, fills, or results. Every timestamp was matched to the timestamped transcript of the recording; the charts themselves were not examined.
ICT Model 6 Price Action Stages and Setups
The central organizational idea begins at 4:43. ICT says the analyst must first decide where price may be drawn on a higher time frame: “where is price right now and where is it most likely reaching up to?” The destination can be a targeted premium array or another area above the current market. The stage is a liquidity draw: the recording opens the review by saying the analyst has to know where price is reaching up to.
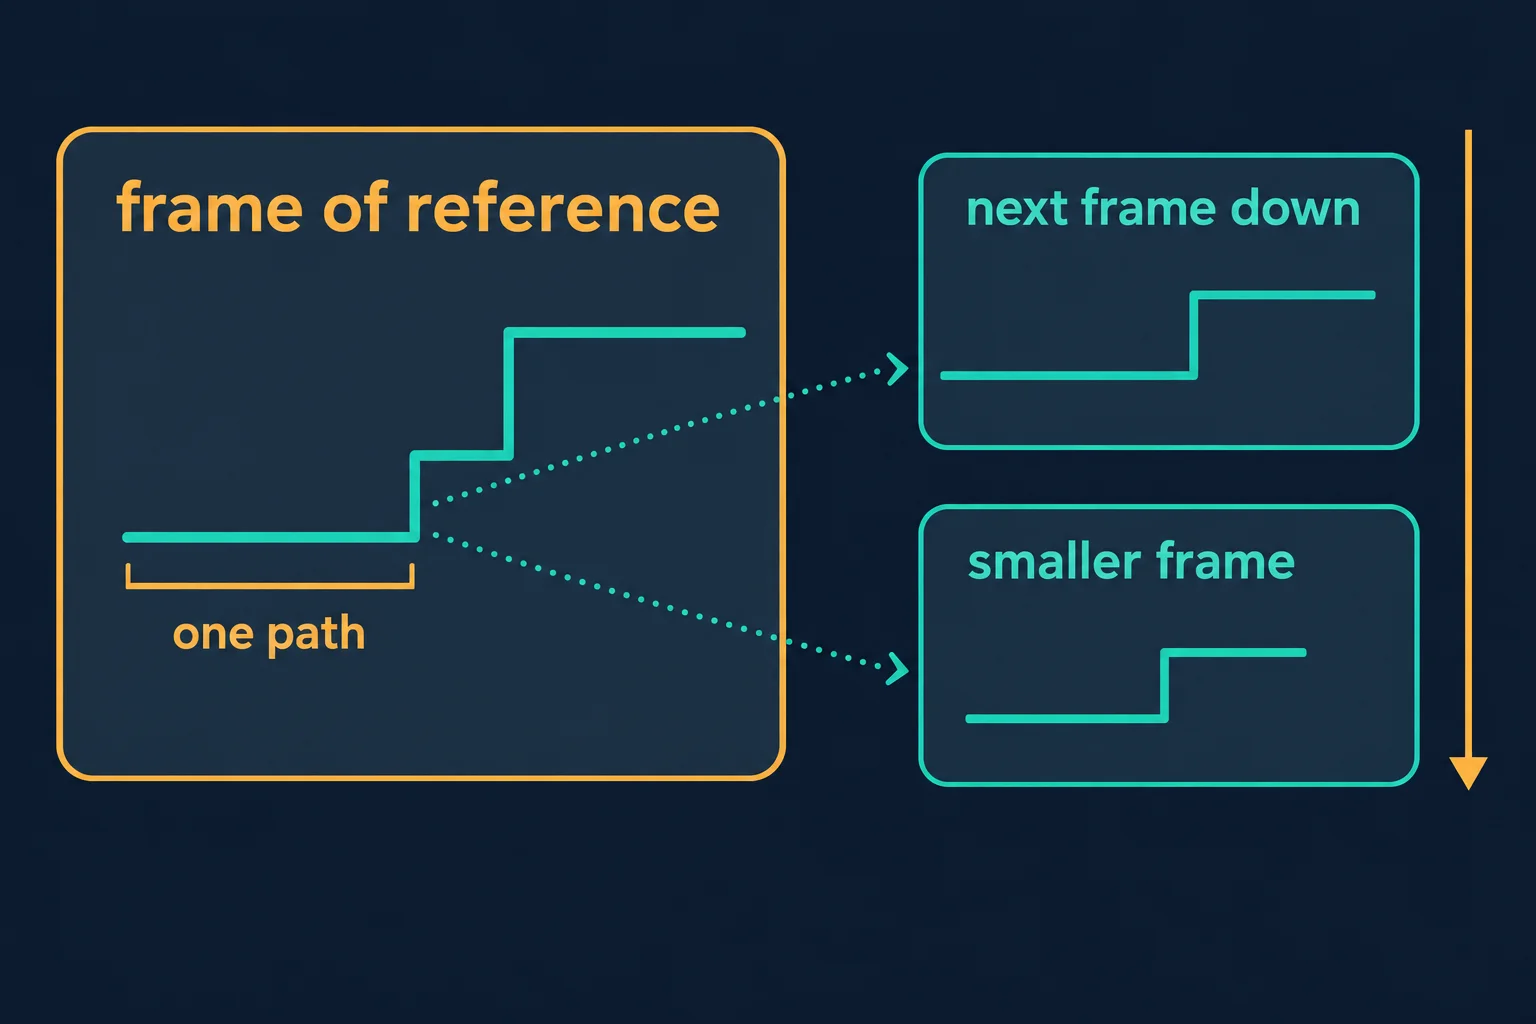
He then divides the analysis into three levels:
- Stage: the higher time frame establishes the proposed liquidity draw and overall range (5:27).
- Setup: the next lower time frame supplies the market maker profile or reaccumulation structure (5:47).
- Entry pattern: another step down provides the detailed pattern used to study an entry (5:52).
His worked example pairs a weekly stage with a daily setup and a four-hour entry pattern, and he says the setup itself is a buy-side liquidity draw — buy stops — within a market maker profile. At 6:16 he adds that the profile is classified generically in his diagram because he believes buy setups appear in both a market maker buy model and a market maker sell model. Later examples continue the same nested logic: a daily thesis is examined on four-hour or 60-minute charts, and a four-hour thesis on 60-minute or 15-minute charts.
ICT Fair Value Price Action Patterns
At 6:31, ICT states that the pattern he is looking for is fair value, and at 6:37 he lists three possible forms: a fair value gap, the filling of a liquidity void, or a run on sell stops. He calls all three fair value. Under his framework, not every setup must contain the same feature: at 7:04 he says the pattern is one of those three and that which one appears depends on what the chart offers, so if no gap or void is available he looks for the run on sell stops instead.
He also offers a stated tendency about which will appear, at 7:41: if a fair value gap is the pattern, he expects price to rebalance at the gap or void rather than continue below the low to take the sell stops, and he says a repeat run on stops is less likely especially when stops were recently taken. He qualifies it in the same breath — “can it happen? Sure it can” — and at 7:57 he is explicit that the ideas are not certain: “it’s not going to be 100%… we’re looking for high probability conditions.”
Trading the ICT Model 6 Buy Side
Much of the lesson examines a rally that ICT believes may eventually create a later selling opportunity. Model 6 isolates the portion before that anticipated reversal, the “buy side of the curve.” He is careful about the scope: at 8:40 he says he is only looking for the next most likely premium array, and at 9:16 that the analyst also has to know whether current price presents a discount array capable of propelling price up to that premium objective. Between those two points, he says at 9:35, he expects to be identifying one or two opportunities using the market maker sell model, and at 9:45 he restates the setup as that model read from its buy side.
The immediate task is not to predict the entire long-term path. At 14:28 he describes the structure as a price swing higher that will later go lower, and at 14:34 he compares it to a bell curve, saying he drew the graph to convey the internal dialogue he uses to see price swings. He applies it on a weekly basis in the lecture, with interest only on everything to the left of the reversal point.
He also describes the framework’s practical extensions. At 20:57 he suggests using the weekly premise to frame one-shot, one-kill buys on Monday, Tuesday and Wednesday while price sits between two given points. At 21:34 he describes pyramiding — buying, taking profit at the higher level, and adding again after a retracement — and at 21:50 illustrates position sizing with two standard lots on a currency pair, adding two more after the retracement. Those are hypothetical illustrations of how the framework could be applied, not reported executions.
ICT Price Objectives in the 20–30% Area
ICT introduces the price-grading concept at 16:35. After defining an anticipated range between an origin and a tentative terminus, he looks for the first reaccumulation opportunity anywhere from 20 to 30 percent into that range, restating the level at 17:07 and 17:14. He ties it back to the grading he taught elsewhere at 17:33, and at 17:45 describes dividing the range into four equal quadrants — 25, 50, 75, and 100 percent at terminus.
The terminus is not necessarily fixed. ICT says it may change as price develops, particularly if a second reaccumulation forms, and he calls that a “gray area” rather than a defect. He mentions Fibonacci projections at 18:46, referring to 1.27 and 1.68 extensions aligning with the premium array as a further reason to favour an entry. The transcript supplies no visible chart with which to verify the exact settings or their application.
One or Two ICT Model 6 Reaccumulations
The lesson returns several times to whether the move will retrace once or twice. At 10:21 he says higher-time-frame scenarios tend to offer two staged opportunities to go long before the premium array is reached, while lower time frames tend to go up in one move. He repeatedly qualifies this as a tendency drawn from reviewing examples rather than an invariant rule.
On shorter time frames he applies the stop-sweep concepts he taught elsewhere: at 26:00 he describes incorporating the 10, 20 and 30 pip stop sweeps once the analysis drops to the lower frames, which he says makes the work more precise. At 32:06 he adds that the final leg into terminus often takes less time than the earlier one, and at 32:23 that a second reaccumulation may not appear at all.
His stated filter sits at 32:36: if price rallies up and leaves 30 pips or less when it starts to consolidate below a predetermined terminus, he reads that as there being no separate second reaccumulation, and at 32:49 he says the sensible response is to do whatever the trade requires in that one entry. This distance-based discussion appears designed primarily for foreign-exchange examples, where pip conventions apply. It should not automatically be transferred to stocks, futures, or other instruments with different quotation and volatility conventions, and the transcript does not establish that these thresholds have been statistically validated.
Applying ICT Price Action Fractals to the Buy Model
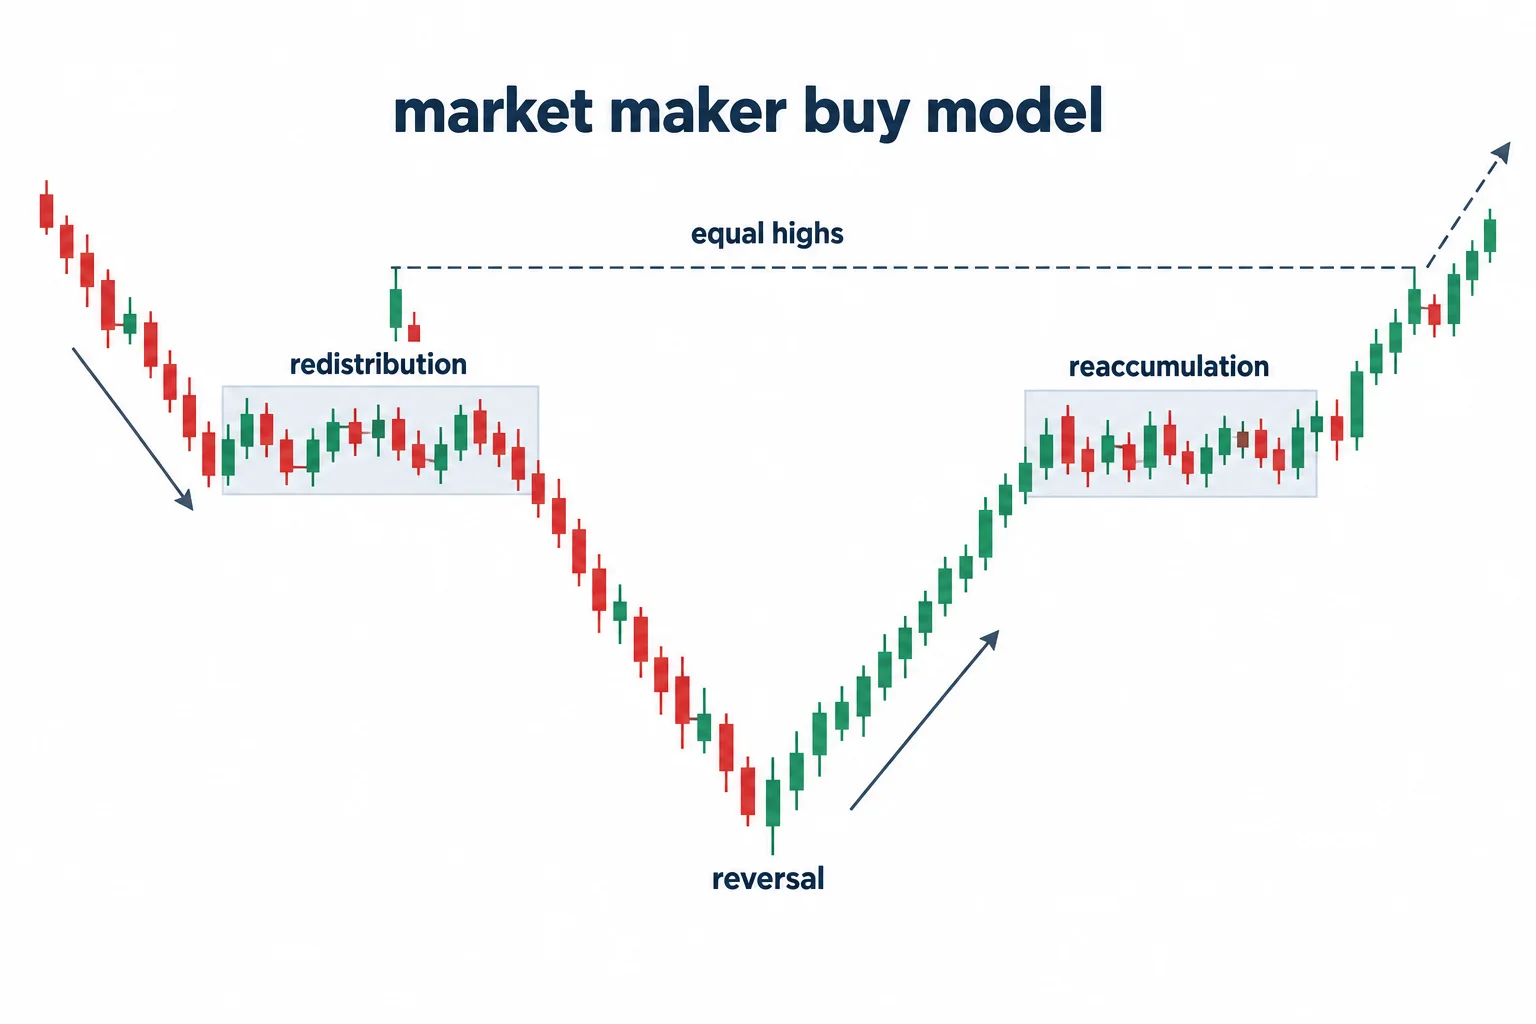
From 33:22, ICT applies similar reasoning to what he calls a market maker buy model. He begins with a decline into a discount area, waits for a reversal and market-structure break, and then studies the developing buy side toward liquidity resting above equal highs. At 33:45 he says to expect one or two staged reaccumulations, and he stresses that the analyst does not need to be positioned at the reversal itself.
The most concrete part of this section is the pairing he describes at 39:22: the curve is divided by the reversal point at the low, and at 39:47 he says to look directly across to where the redistribution area sat during the decline. At 39:53 he locates the buying opportunity in the up-close candles, and at 40:04 says those same up-close candles are the basis of the second stage reaccumulation. Asked at 40:13 what pattern to look for, he answers at 40:17 with an optimal trade entry, a fair value gap, a bullish order block, or the filling of liquidity voids; at 40:25 he adds that if no imbalance needs rebalancing, price will probably run back for sell stops instead, and at 40:38 to expect expansion back to the original consolidation.
He gives one dated illustration at 37:57, referring to the dollar–Swissy and saying at 38:08 that it is the 16th of a month he places in 2018, and that he would post it in the mentorship thread. He describes aiming for the initial consolidation high at 38:49, adding 10, 20 and 30 pips. Because the ASR does not render the month alongside that date, the specific calendar date is not restated here. The example is a retrospective reading of his own annotations; no fill or outcome is stated.
How to Study the ICT Model 6 Lesson
ICT closes with a chart-study exercise at 41:05. He asks viewers to redraw the conceptual model for several time-frame combinations, put it in their journal, and then search historical charts for comparable structures — at 41:54 he lists stocks, commodities, indices and Forex pairs. He says the point is to find the models in old data so the trader knows what to look for going forward.
For educational review, that exercise can be made more disciplined by recording the proposed stage, objective, lower-time-frame setup, invalidation condition, and outcome before evaluating the example. It is also useful to preserve examples that fail to match the model rather than selecting only visually persuasive cases afterward. This study suggestion is a general analytical interpretation, not a claim made or tested in the recording.
The main takeaway is organizational: ICT’s amplified Model 6 lesson begins with a hypothesized higher-time-frame destination and then uses nested time frames to classify possible reaccumulations on the way to it. The transcript teaches vocabulary and a chart-reading process; it does not demonstrate verified profitability, actual executions, or subsequent trade outcomes.
Watch the original recording
The video mapped to this article is ICT Charter Price Action Model 6 – Amplified Lesson, a public upload on the channel The Inner Circle Trader. Its watch page records a publish time of 24 January 2024, 13:22 Pacific, and a running time of about 42 minutes 51 seconds. It remains publicly available and playable in an embed. Every timestamp link above points into that recording. The transcript used for this guide was produced by local automatic speech recognition of the complete original audio rather than from YouTube captions, so its wording and numbers should be treated as automated. The recording’s charts, PDF slides and on-screen annotations were not examined by this review.
Reference sources and provenance
These references support specific points in the guide above. None of them is an ICT publication, none endorses or tests the approach, and none is offered as evidence for statements made in the recording.
What the recording does and does not establish
The lesson is a conceptual framework explained over diagrams, not a measured result. Investor.gov, the U.S. Securities and Exchange Commission’s investor education site, describes day trading as “extremely risky” and states that it “can result in substantial financial losses in a very short period of time”.[2] That is quoted as general risk context for a framework built on intraday execution; it makes no claim about the speaker.
Why a chart walkthrough is not a performance record
The dated dollar–Swissy reference and the position-sizing illustration are recounted from the speaker’s own annotations and hypotheticals, and the recording supplies no account statement, trade log or independently verified fill. U.S. rules on presenting simulated or hypothetical trading performance require disclosure that such results “have certain inherent limitations” and that simulated programs “are designed with the benefit of hindsight”.[4] That rule governs advertising by regulated advisers, not a YouTube lesson, and is cited only to explain why a modelled example is not evidence of a repeatable edge.
Base rates in a currency example
The pip-based discussion and the position-sizing illustration are both currency examples, so the Commodity Futures Trading Commission’s retail foreign-exchange material is relevant context: the agency states that “two out of three retail foreign exchange traders lose money each quarter”.[3] Nothing in the recording reports a verified outcome for any session or account.
Source, method and limits
This article is grounded in the full timestamped transcript of the mapped upload, identified in the article metadata by video ID fAcnhdaowME and by that transcript’s SHA-256. The transcript was produced by local automatic speech recognition of the complete original audio and is not human-reviewed captioning. Three limits follow. First, the recording’s charts, PDF slides and annotations were not examined by this review, so every reference to premium arrays, discount arrays, reaccumulation areas, order blocks and liquidity voids is reported as the speaker’s reading rather than as a verified chart fact. Second, the lesson’s dated example is not restated as a specific calendar date because the automatic transcription does not render the month alongside the day. Third, the Fibonacci settings, the 20–30% entry zone and the 10/20/30 pip thresholds are reported as the speaker’s stated conventions, not as validated parameters. YouTube’s own help documentation explains the embedding setting that determines whether the player above is playable on an external site.[5]
Sources
- [1] Primary source: ICT Charter Price Action Model 6 – Amplified Lesson (The Inner Circle Trader)
- [2] Investor.gov (U.S. Securities and Exchange Commission): Day Trading
- [3] U.S. Commodity Futures Trading Commission: Forex frauds
- [4] 17 CFR 4.41: Advertising by commodity pool operators and commodity trading advisors
- [5] YouTube Help: Embed videos & playlists
Any ICT, smart-money or third-party indicator, script, transcript, note set, spreadsheet or social summary circulating outside the publishing channel’s own upload page is unofficial and untested here. Market maker profile, low-resistance liquidity run, premium array, discount array, reaccumulation, redistribution, fair value gap, liquidity void, optimal trade entry, bullish order block, stop sweep and terminus are the speaker’s own framework and terminology. No win rate, drawdown figure, fill, position size or account result is claimed anywhere in this article.
Leveraged foreign-exchange and futures trading carries substantial risk. Framing a higher-timeframe objective and waiting for a lower-timeframe pattern does not remove slippage, timing error or the possibility of loss, and a conceptual range cannot be relied upon to terminate where it was projected. This article is educational commentary, does not provide individualised financial advice, and reports no outcome from any session or account.