
Key takeaways
ICT Charter Price Action Model 6.2 presents a bullish USD/CHF case by aligning Dollar Index and Swiss franc seasonality, Commitment of Traders positioning, and top-down price action across monthly, weekly, daily, four-hour, and hourly charts.
Read the full summary
ICT Charter Price Action Model 6.2 presents a bullish USD/CHF case by aligning Dollar Index and Swiss franc seasonality, Commitment of Traders positioning, and top-down price action across monthly, weekly, daily, four-hour, and hourly charts. The seasonal thesis looks for a Dollar Index low and Swiss franc high in the final week of September or early October using overlapping 15-year and 33-year averages. ICT evaluates Swiss franc commercial positioning within six-month and 12-month ranges, with two-year and four-year ranges for broader context, rather than relying on the net-zero line. Monthly and weekly analysis identifies discount pricing, swept sell-side liquidity, a bullish order block mean threshold, and equal highs as potential buy-side liquidity. Daily setups use order blocks, fair value gaps, imbalances, Power of Three expansion, partial profits near intermediate equal highs, and reassessment after retracements. Four-hour Turtle Soup longs require energetic movement after a low sweep, while hourly examples interpret Monday, Tuesday, and Wednesday declines as stop runs before rallies. The core rule is that lower-time-frame sweeps remain subordinate to seasonality, COT context, higher-time-frame structure, range location, and the intact liquidity objective, with no verified fills, proven edge, or guarantee of future performance.
How we researched this article
BestProps used document-based research from primary firm sources, checked September 24, 2026. The complete source list, scope, limitations, and commercial-state record appear near the end of this article.
In ICT Charter Price Action Model 6.2 – Amplified Lesson, ICT presents a top-down study of USD/CHF. The lesson combines seasonal tendencies, Commitment of Traders (COT) positioning and ICT-style price-action concepts to build a bullish narrative for the currency pair. It is a follow-up to his Model 6 lesson and he says at the close that Model 7 will show the opposite configuration on another pair (36:25).
The central idea is not to trade from one signal in isolation. ICT first forms a macro thesis, then looks for agreement from positioning data and higher-time-frame chart structure. He subsequently moves through monthly, weekly, daily, four-hour and hourly charts to illustrate how that thesis could frame shorter-term setups. He states the point of the exercise explicitly: he is looking for “a high probability condition that repeats just about every year” (12:34).
ICT Price Action Seasonality Windows
ICT begins with the Dollar Index and says its historical seasonal averages tend to show a low around the final week of September or the opening part of October (1:34). He compares 15-year and 33-year seasonal lines and says the correlation between those two averages is what he watches, adding that a strong turn shown by both “signifies something that warrants our attention” (2:14). He is candid that this is not a precise instrument: he calls seasonality something that is “not a panacea” but “very good roadmaps” (0:53).
He then narrows the date range in his own reading. On a stronger bullish year he suggests the low could form as early as the 20th or 21st of September (2:41), while on a weaker year it may take until mid-October (3:02). He immediately qualifies it: it is “not important that we split hairs about this specific date because it just gives us a window of opportunity to look for technicals to come in alignment” (3:16).
He contrasts that with a seasonal tendency for the Swiss franc to form an important high over roughly the same last-week-of-September into October period (3:42). His interpretation is that simultaneous dollar strength and Swiss-franc weakness would make USD/CHF a candidate for a rally — but, as he puts it, only after asking “what are the smart money traders doing” (4:42).
ICT Price Action COT Range Signals
5:17 begins the COT section. ICT walks through pulling the December Swiss franc futures contract and adding the COT study in a charting service, leaving only the commercial category visible. He takes the highest reading in the data over the last 12 months — which he puts at “about 67,800 and some” (6:27) — and the lowest reading over the same window (6:38), then plots the midpoint between them. He stresses that precision is not the point: “It doesn’t have to be perfect.” He also says he looks at 12-month, 6-month, 2-year and 4-year ranges, with the 12-month and sometimes the 6-month doing the near-term work (8:00).
Instead of relying primarily on whether commercials are above or below the conventional net-zero line, ICT treats the selected range somewhat like an overbought/oversold scale. He calls the zero line a “red herring” and argues that the traditional net-long/net-short framing is why retail traders get “whipsawed” (9:20). A movement from one end of that range toward the other is interpreted as a change in commercial behavior, even when the group remains net long or net short in absolute terms.
He explains his reasoning about the three tracked groups. In his words the small speculators are not his concern because they are “typically wrong”; the large funds are “classically right in trending moves, but they’re always wrong at the tops and the bottoms”; and it is the commercial traders who call the turns (11:25, 11:14). He adds that his focus on commercials gives him a “great deal of certainty, not absolution” that price action will be “more or less dictated” by their actions.
This is ICT’s own analytical interpretation, not evidence that commercial positioning mechanically predicts market turns. He explicitly encourages viewers to inspect the historical data rather than accept his view without review: “Don’t take my word on it. It’s much more powerful when you see it.” COT reports are also aggregated positioning data; the transcript does not establish the motives of individual participants or verify the institutional activity attributed to specific candles.
ICT Price Action and the USD/CHF Outlook
From the monthly chart, ICT reads price as having moved into a discount area, having already cleared sell-side liquidity beneath prior equal lows, and having reached the midpoint — the “mean threshold” — of a down-close candle he labels a bullish order block, with a low at 95.42 (14:45, 14:52). Equal highs above the market are then treated as potential buy-side liquidity and a longer-term objective, and he gives a rough rally target around the 95.45–95.50 area before describing a buy-side imbalance from the same candle at 95.84 (16:01, 16:25).
On the weekly chart he refines the area of interest to the opening price of a down-close candle that he labels a bullish order block — 95.47 in his reading — and he explains why he uses the body rather than the wick: the body is “the more focal point” because it is a single down-close candle before the market turns up (17:22, 18:28). He notes the subsequent weekly low came in at 95.42, “only off by 5 pips using a weekly chart” (20:38).
Those specific price levels are the speaker’s own reported reading of charts shown in the recording. They are not independently reproducible here from transcript text alone, and the transcript itself shows the ASR occasionally garbling adjacent words. The methodological point is the refinement process: begin with a broad monthly area, use the weekly chart to narrow it, and use lower timeframes to time entries.
ICT argues that an earlier sweep of lows changes how later declines should be interpreted. Rather than assuming every move beneath a short-term low is a bearish structure break, he evaluates it against the still-bullish seasonal, positioning and higher-time-frame narrative. He also describes a market maker sell model sequence — consolidation, rally away, return to the consolidation, reaccumulation, distribution, and then a longer-term correction — and says that in this case price “would not need to come down here to clear this original consolidation” because the equal lows had already been run (19:25).
ICT Price Action From Daily Charts to Entries
On the daily chart the discussion turns to equal highs, retracements into prior candles and what ICT calls Power of Three expansion. He presents pullbacks into selected order blocks or imbalances as possible opportunities within the larger bullish thesis, while the highs above remain the proposed draw on liquidity (21:57). He also states that he posted on Twitter at the time to look for those highs to be taken out, and that it happened the very day of the post (22:09). That self-reported social-media callout is a claim, not verification.
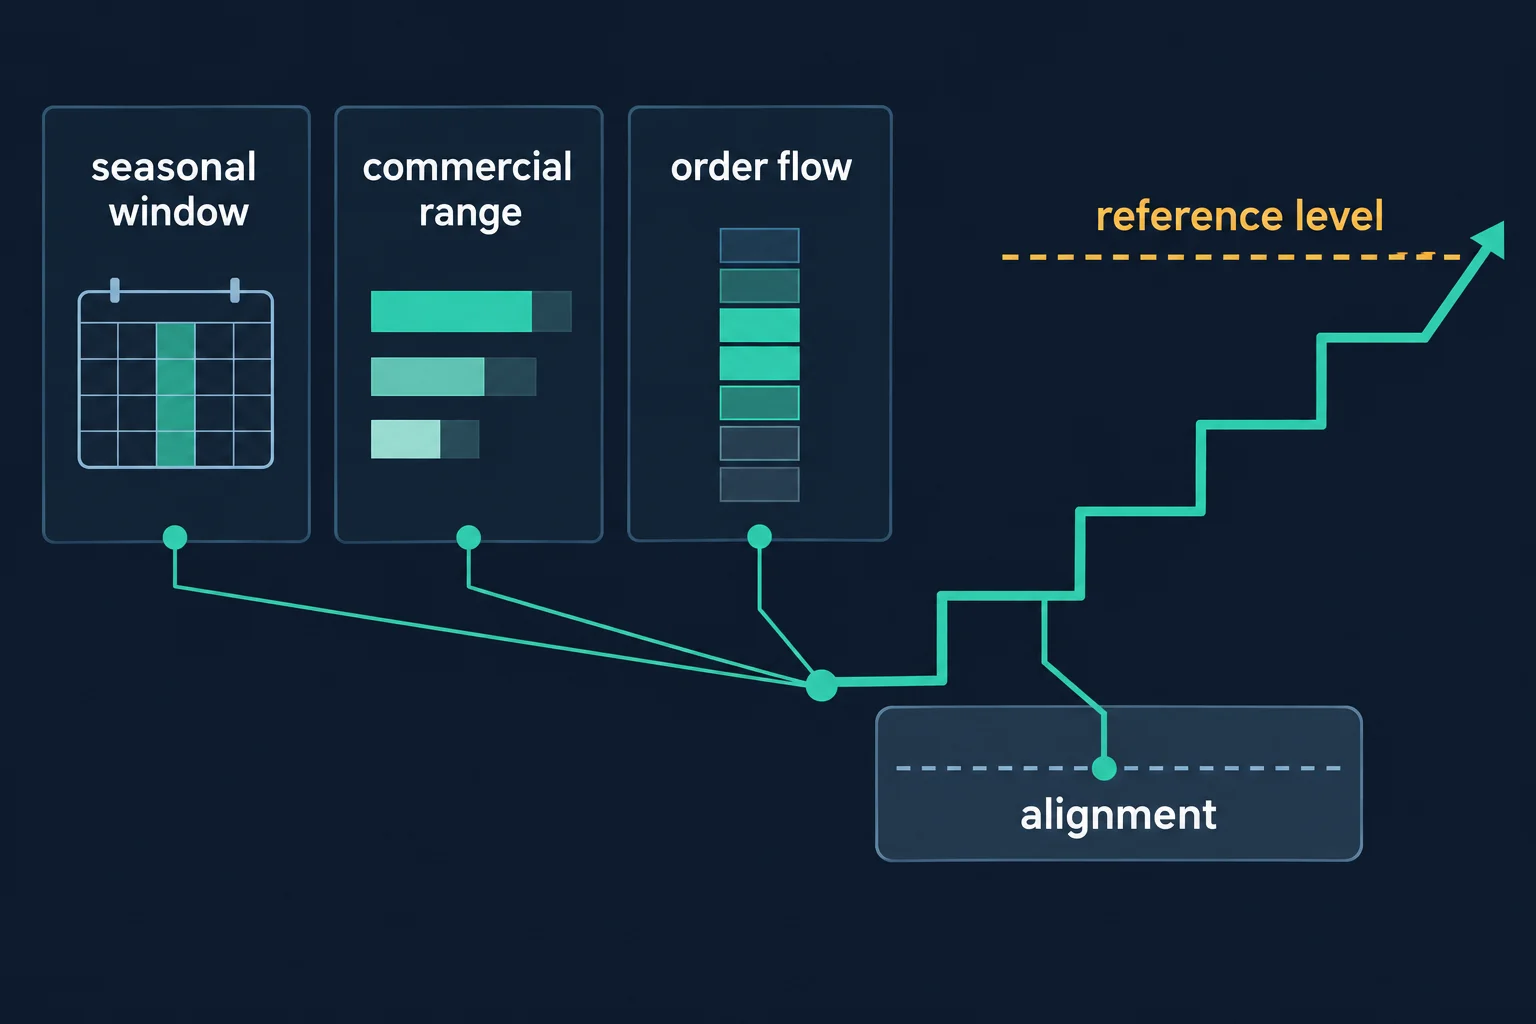
24:28 ICT marks an up-close candle and a fair value gap, describing a return into that area before another upside expansion. He also discusses taking partial profits near intermediate equal highs and reassessing after a retracement: “you take profits off here because you could be wrong” (24:44). These are illustrations of his trade-management framework, not documented fills or independently verified results.
On the four-hour chart, ICT describes dips beneath prior lows as “Turtle Soup” longs when they occur within the bullish narrative (32:20). On the daily view he frames the same idea as “buying range liquidity, buying up the sell stops on a turtle soup type move,” then letting price rally away, taking a little off at the equal highs and re-entering on the retracement (26:03). His expected confirmation is energetic movement away from the swept low. He also sets out a stop-loss convention: once a low has been defended, move the stop beneath it, because “if it trades back down to that level, it’s no good” (26:55).
The four-hour section adds a further refinement — a down-close candle with an open at 95.75 and a high of 95.78 that he says could serve as an entry area on a return, with a stop beneath the low and the same three-part narrative behind it (31:14). He then drops to the hourly chart, where the discussion becomes a timing study across days of the week: buying on Monday, Tuesday and Wednesday, with mid-week dips beneath Monday’s low read as stop runs rather than market-structure breaks (34:29). He says the same pattern repeated the following week when price dropped back into equal lows on a Monday (35:21).
ICT Price Action Model Alignment
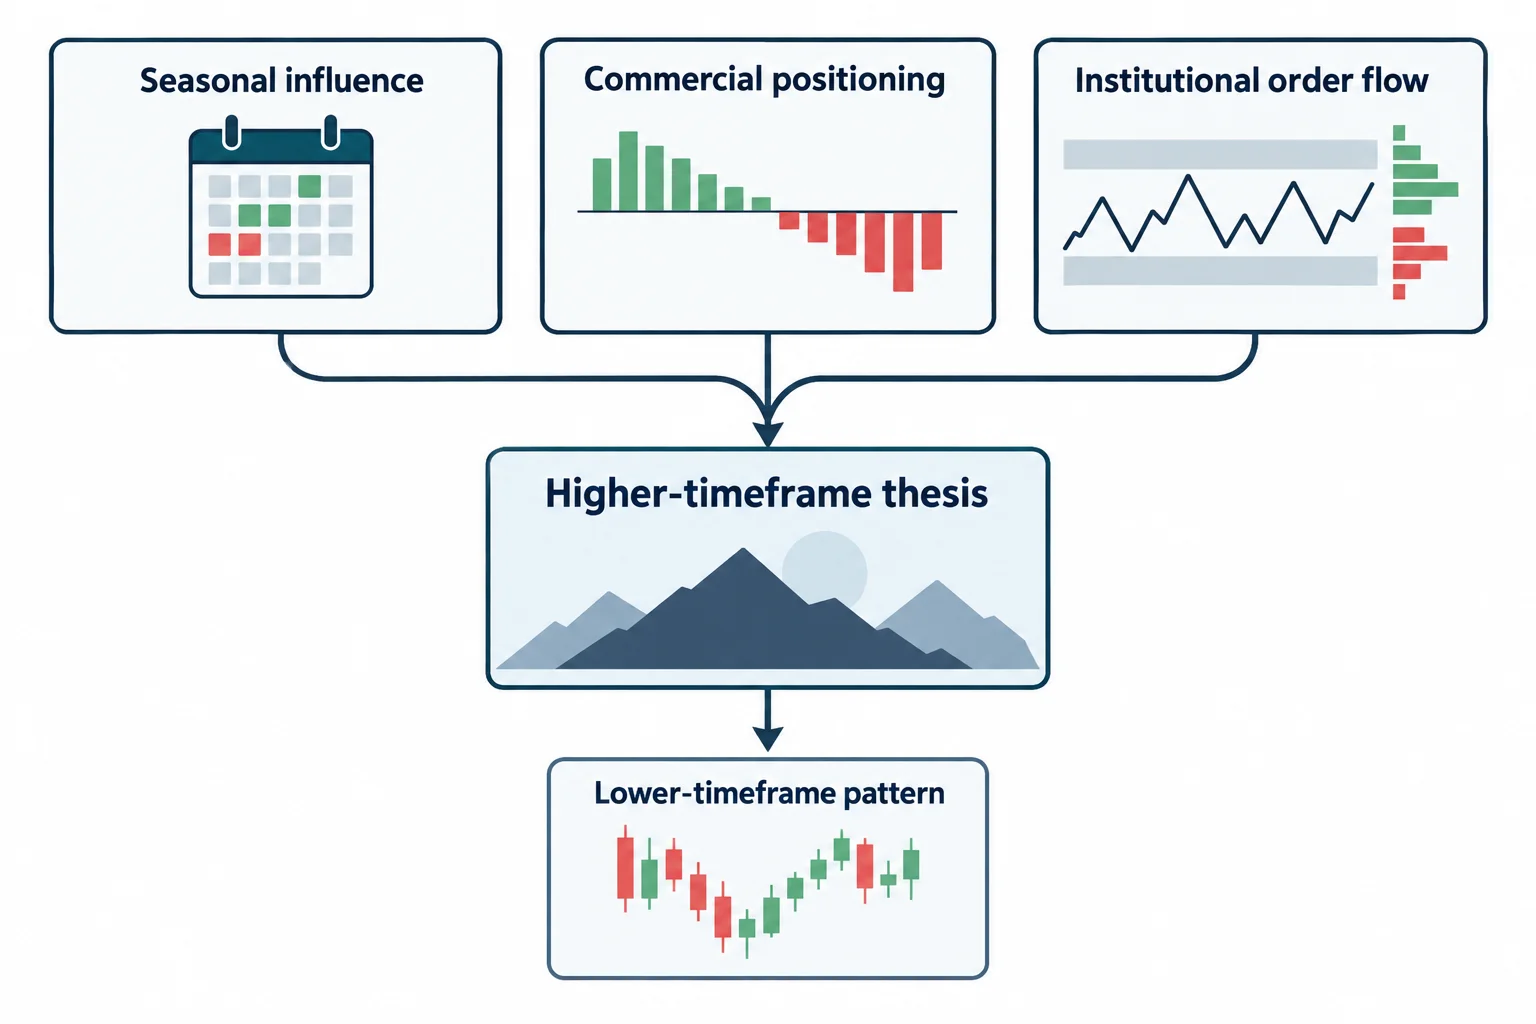
27:58 ICT summarises the lesson as a blend of three elements:
- Seasonal influence: a recurring time window in which the dollar and Swiss franc tendencies appear directionally opposed.
- Commercial positioning: his range-based interpretation of COT data rather than a simple net-long/net-short reading.
- Institutional order flow: his use of premium/discount arrays, order blocks, imbalances, liquidity pools and market-maker models.
The practical educational takeaway is that the lower-time-frame pattern is subordinate to the higher-time-frame thesis. Under ICT’s model, a swept intraday low does not automatically imply bearish continuation; its meaning depends on seasonality, positioning, location within the larger range and whether the proposed liquidity objective remains intact. He adds a caution about scope rather than frequency — the same seasonal setup will not appear in every market or every week, so the discipline is to wait for these conditions rather than trade “willy-nilly” (29:11).
The lesson concludes on the hourly chart, where ICT reviews several low sweeps followed by rallies and says the next model will demonstrate the opposite configuration on another currency pair (36:25). Because the transcript is generated by automatic speech recognition of the recording’s audio and the charts cannot be inspected from text alone, viewers should use the closing summary from 36:31 and the chart sections themselves to verify the visual examples and terminology directly.
This article is for education only and does not constitute investment advice. The video presents ICT’s interpretation of historical examples; it does not establish future performance or a proven trading edge. No trade described in the recording has been verified, and no chart, order panel or account was inspected by this review.
Watch the original recording
The video mapped to this article is ICT Charter Price Action Model 6.2 – Amplified Lesson, a public upload on the channel The Inner Circle Trader dated 25 January 2024 and running 2,193 seconds. Every timestamp link above points into that recording. The transcript used for this guide was produced by local automatic speech recognition of the complete original audio rather than from YouTube captions, so its wording should be treated as automated, not human-verified. The recording’s charts and on-screen annotations were not examined by this review.
Reference sources and provenance
These references support specific points in the guide above. None of them is an ICT publication, none endorses or tests the approach, and none is offered as evidence for the statements made in the recording.
How COT data is actually constructed
The lesson leans on the commercial category of the Commitment of Traders report. The CFTC describes what the report contains: “The COT reports provide a breakdown of each Tuesday’s open interest for futures and options on futures markets in which 20 or more traders hold positions equal to or above the reporting levels established by the CFTC.”[2] Two limits follow from that description and matter for reading the lesson. The data is reported as of Tuesday and published later in the week, so it is inherently dated; and trader category is based on predominant business purpose self-reported by the trader, with the CFTC stating it does not publish how individual traders are classified. The recording’s “commercials” reading therefore describes a reported aggregate, not verified intent.
Why the worked example is an illustration, not an audited result
The lecture’s examples are retrospective chart walkthroughs rather than a disclosed track record, and 17 CFR 4.41 explains why a performance presentation needs care: the regulation’s prescribed statement notes that “these results are based on simulated or hypothetical performance results that have certain inherent limitations,” and adds that “simulated or hypothetical trading programs in general are also subject to the fact that they are designed with the benefit of hindsight.”[4] The recording does not present its example in that form, so no outcome on this page should be read as an audited or independently verified result.
Why the price levels are not position-sizing guidance
The levels quoted in the lesson — 95.42, 95.47, 95.50, 95.78, 95.84 — are the speaker’s own chart readings inside a teaching walkthrough, and the lecture supplies no sample size, win rate or transaction-cost assumptions. The U.S. Commodity Futures Trading Commission states on its Forex Frauds page that “two out of three retail foreign exchange traders lose money each quarter.”[3] That figure is quoted as general context for retail participation across leveraged markets and says nothing about this speaker, his method or the example in the recording.
Why a self-reported example is not independent evidence
The lecture describes a chart callout said to have been posted on social media the same morning and cites that commentary as corroboration. The CFTC’s own investor material advises readers to “learn how to spot and avoid the scams” and to research before acting, and it warns that bad actors exploit social media and mobile platforms in particular.[5] That guidance is cited only as a reason to treat self-reported examples on social platforms as claims rather than verification; it makes no allegation about this speaker or this channel.
Why the player above is the check on every timestamp
The whole article rests on the mapped upload, so the reader’s own control is the embedded player. YouTube’s help documentation states that “you can add a YouTube video or playlist to a website or blog by embedding it,” and that age-restricted videos cannot be watched on most third-party sites, redirecting viewers back to YouTube instead.[6] The upload used here is publicly listed and not age-restricted, and the embed was play-tested rather than assumed to work.
Sources
- [1] Primary source: ICT Charter Price Action Model 6.2 – Amplified Lesson (The Inner Circle Trader)
- [2] CFTC: Commitments of Traders (COT) reports — descriptions and classification methodology
- [3] CFTC Learn & Protect: Forex Frauds
- [4] 17 CFR 4.41: Advertising by commodity pool operators, commodity trading advisors, and the principals thereof
- [5] CFTC Learn & Protect: Advisories and articles
- [6] YouTube Help: Embed videos & playlists
Any ICT, SMC or third-party indicator, script, transcript, note set, spreadsheet or social summary circulating outside the publishing channel’s own upload page is unofficial and untested here. Market maker buy and sell models, PD arrays, Turtle Soup, Power of Three and the range-based COT hedging program are the speaker’s own teaching labels; this page describes them as he presents them and does not validate them. No claim of profitability, win rate or future performance is made or implied about the method, the speaker or the channel.