
Key takeaways
ICT Charter Price Action Model 5 is a day-trading plan for currency futures and forex pairs built around 40 to 50 pip objectives rather than fixed percentage returns.
Read the full summary
ICT Charter Price Action Model 5 is a day-trading plan for currency futures and forex pairs built around 40 to 50 pip objectives rather than fixed percentage returns. It defines a dealing range from the highest high and lowest low of the previous 20 trading days excluding Sundays, identifies the next liquidity draw above a prior daily or intra-week high for bullish trades or below a prior daily or intra-week low for bearish trades, and requires at least 40 pips of room. Entries use a 15-minute discount fair value gap for longs or premium fair value gap for shorts, converging with a standard-deviation level during the London or New York open, with five-minute or one-minute models available to refine risk. The plan trades only Tuesday through Thursday, skips Thursday when Tuesday and Wednesday already delivered large favorable ranges, and uses demo-account limit orders five pips beyond the convergence, plus five pips for longs and minus five pips for shorts. Initial stops sit 15 pips beyond the setup low or high, targets take one position off at 40 pips and another at 50 pips, and a third position closes 80% at 50 pips while leaving 20% to run. Stop distance may be reduced 25% after price reaches 25% of the objective, halved at 50%, and must move to break even at 75%. A full-R loss halves account risk R%, another loss at reduced risk halves it again, and original risk resumes after 50% of the prior loss is recovered, while five consecutive wins also trigger a 50% risk reduction. The recording presents rules and demo orders only, with no verified fills, win rate, sample size, backtest results, drawdown record or proof of profitability, and the bullish standard-deviation threshold is unavailable because the automated transcript cuts off.
How we researched this article
BestProps used document-based research from primary firm sources, checked September 24, 2026. The complete source list, scope, limitations, and commercial-state record appear near the end of this article.
In ICT Charter Price Action Model 5 \ Trade Plan, a 14-minute-12-second upload from the Inner Circle Trader, ICT walks through the trade plan that accompanies the fifth of his charter price action models. The presentation is a plan rather than a lesson in the underlying concepts, and he opens by stating that viewers should work through the Model 5 presentation and the supplementary lesson first, because the plan assumes that prior study.
Two framing choices matter for reading the rest of it. The first is the size of the objective. At 0:10 he describes the plan as focusing on 40 to 50 pips per trade, and at 2:38 he says the model concentrates on the low end of 40 pips with an average of about 50. The second is that all order placement he describes is on a demo account (8:11 and 9:45). A pip objective is not a return: converting either figure into account performance depends on position size, stop distance, instrument characteristics, spreads, commissions and losses.
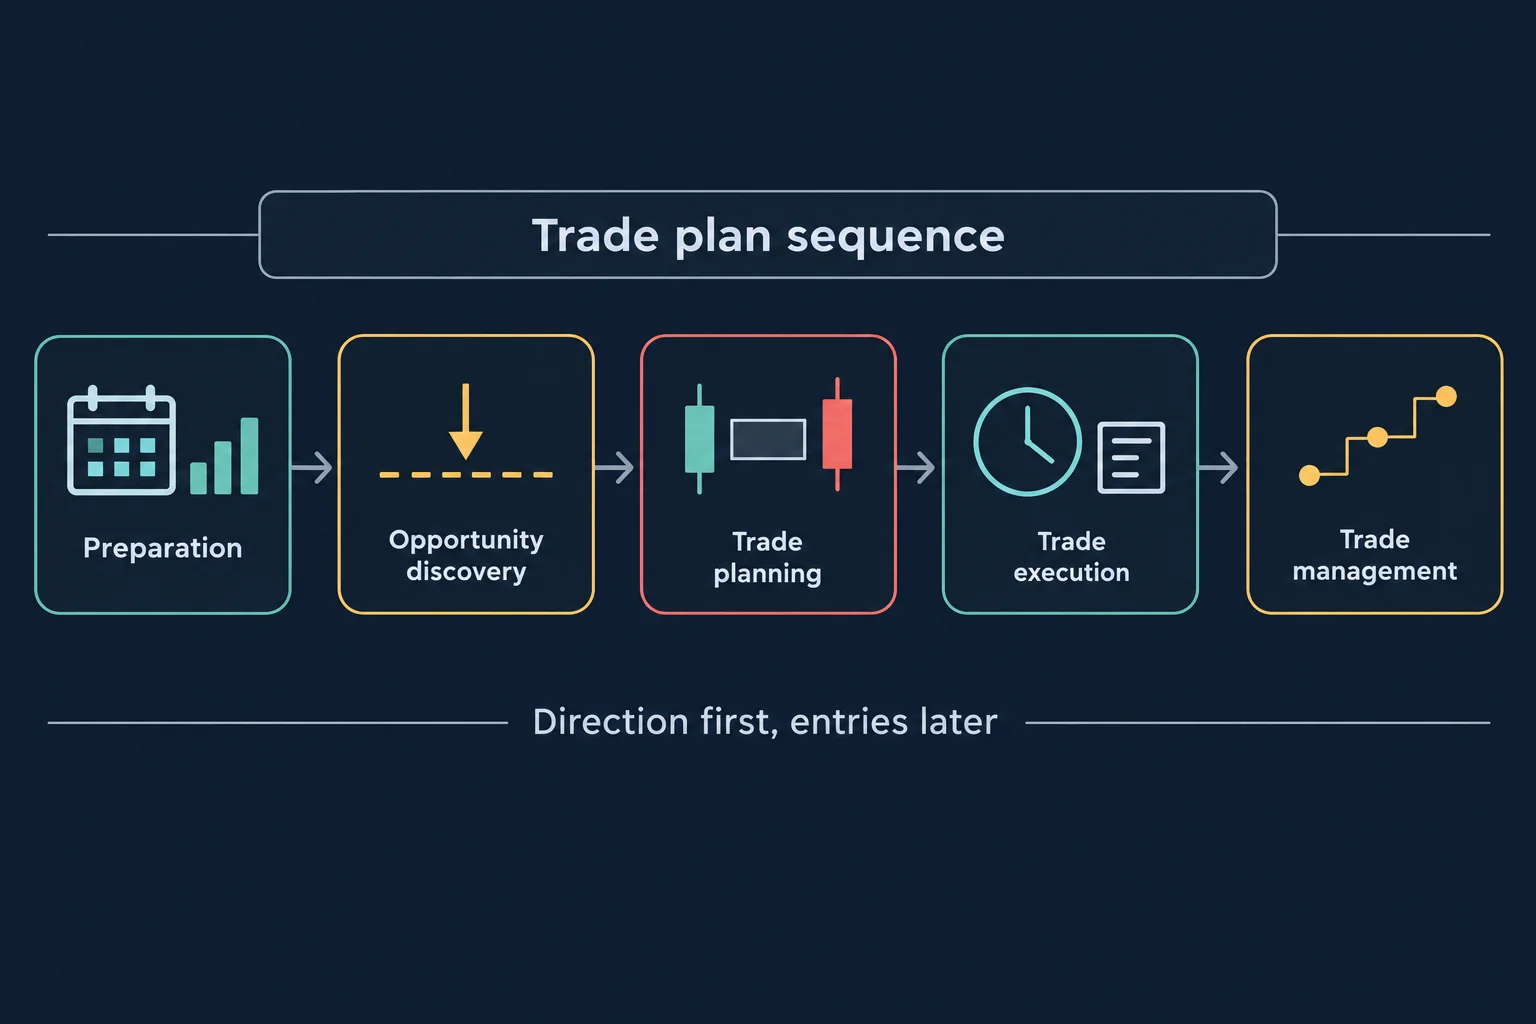
Build the Model 5 20-Day Trade Range
The preparation stage has two inputs. ICT says at 1:28 that he notes every medium- and high-impact economic event for the markets being followed and studies the coming week’s calendar against current market structure to form a view about that week’s range. This is his stated method of combining structure with scheduled events; the recording does not test whether the combination predicts anything.
The structural input is what he calls the dealing range, defined at 1:46 as the highest high and the lowest low of the past 20 trading days, with Sundays excluded. He is explicit that this is the only 20-day range the plan uses. Inside it, at 2:26, he looks for the next draw on liquidity – above a previous day’s high or below a previous day’s low – and requires that it offer at least 40 pips. He then looks for a price-delivery array aligned with the weekly bias and waits for a day when a calendar event could support that move (2:54). The automated transcript renders his term as “IPTA data range” throughout; this is the same 20-day range, and the garbled form is a transcription artifact rather than a separate concept.
Define the Model 5 Trade Direction
Opportunity discovery is deliberately symmetrical. At 3:21 ICT sets out the three steps:
- With a bearish bias, identify a previous day’s low or an intra-week low.
- With a bullish bias, identify a previous day’s high or an intra-week high.
- Expect daily range expansion in the direction of the bias.
The old high or low therefore acts as an objective rather than an entry. The entry is sought on the pullback against the bias, which is the next stage.
Plan Model 5 Trades Around Fair Value Gaps
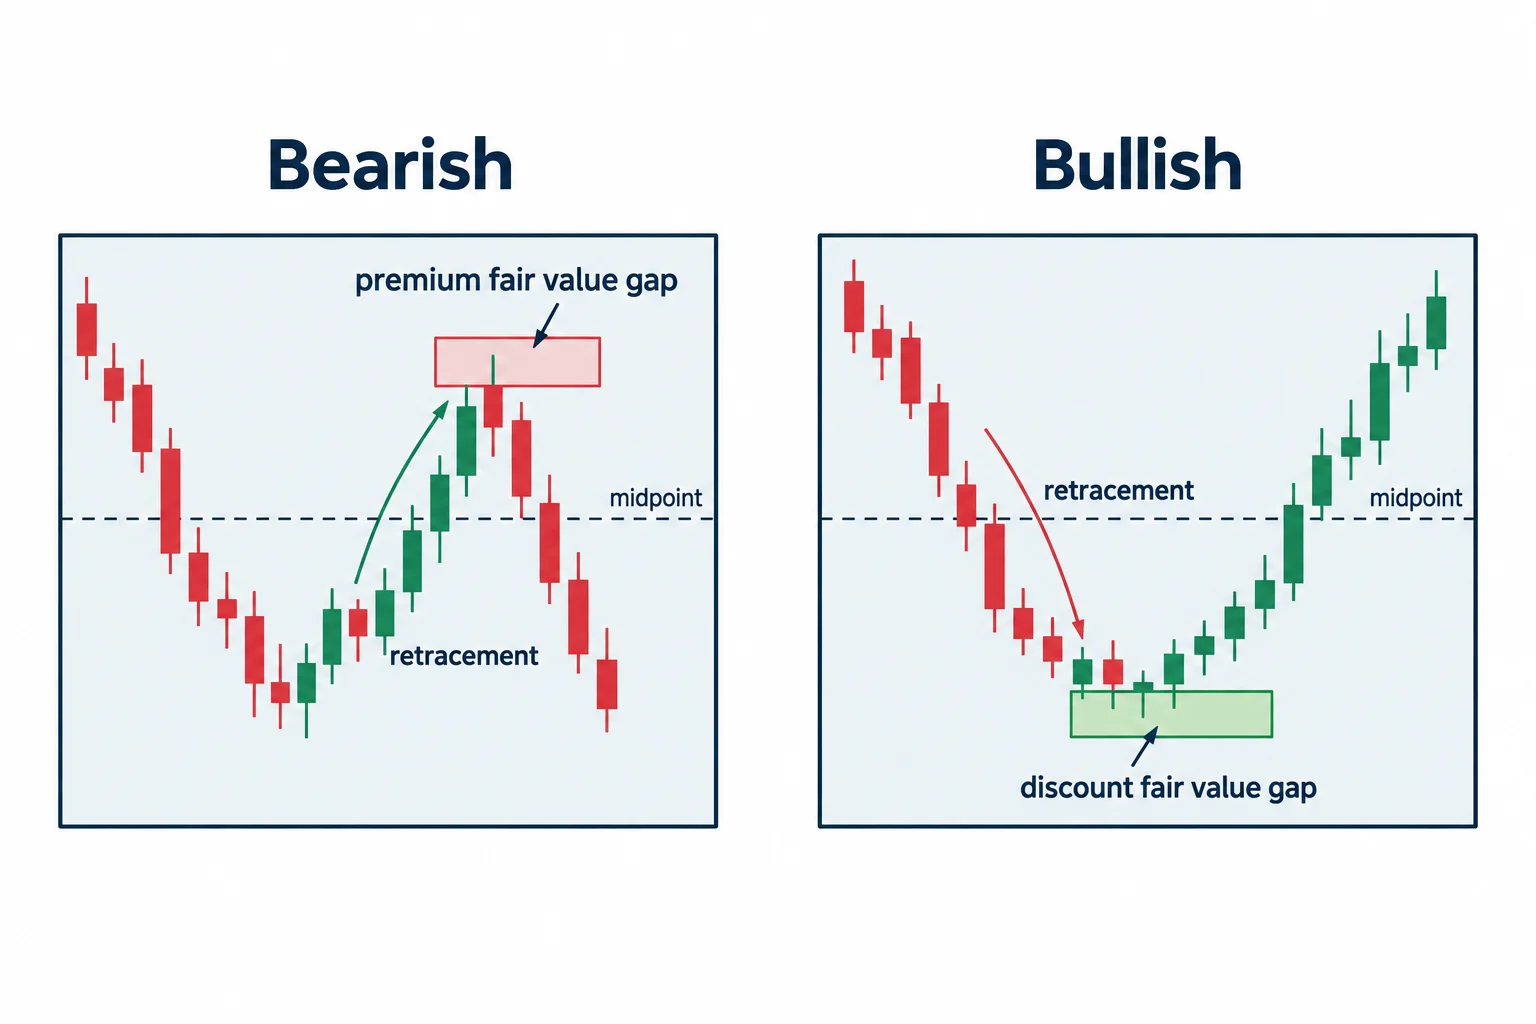
At 3:47 he describes what he is waiting for: a convergence of manipulation and price moving opposite to the trade bias, at a time the calendar suggests volatility. From 4:00 he states the setup in both directions – sell a premium fair value gap, buy a discount fair value gap.
The bearish version at 4:07 frames a short when price has moved up into a 15-minute premium fair value gap that converges with a standard deviation of no more than three, during the London or New York open. The bullish version at 4:52 mirrors it for a discount gap, but the automated transcript breaks off at that point on the phrase “no more than negative” and never supplies the number. The bullish standard-deviation threshold is therefore not recoverable from the audio and is stated here only as an unresolved gap rather than a figure. The same passage also points back to the Model 5 presentation itself, where he says the specific standard-deviation and range choices – central bank dealers range, Asian range or a floating option – are broken down (4:39).
Both directions permit scalping protocols for smaller risk, which he explains at 5:15 as applying his five-minute and one-minute chart models to reduce exposure. Refining the entry on a smaller timeframe narrows the stop; it does not change the odds of the idea working.
Set Model 5 Trade Objectives Within the Range
At 5:28 ICT describes the initial bearish objective as the sell-side liquidity below a previous day’s low or an intra-week low inside the 20-day range, with the next logical discount array at 40 pips as the first target. He notes that multiple old daily or intra-week lows will usually sit inside that range and says to pick the one that frames at least 40 to 50 pips (5:47). The bullish version at 5:54 targets buy-side liquidity above a previous day’s or intra-week high, with the next logical premium array as the first objective.
Selecting the objective this way is a filtering rule rather than a forecast. It picks the nearest candidate that satisfies a minimum distance, and the recording contains no worked example with stated price levels, so it cannot show whether a chosen objective was reachable.
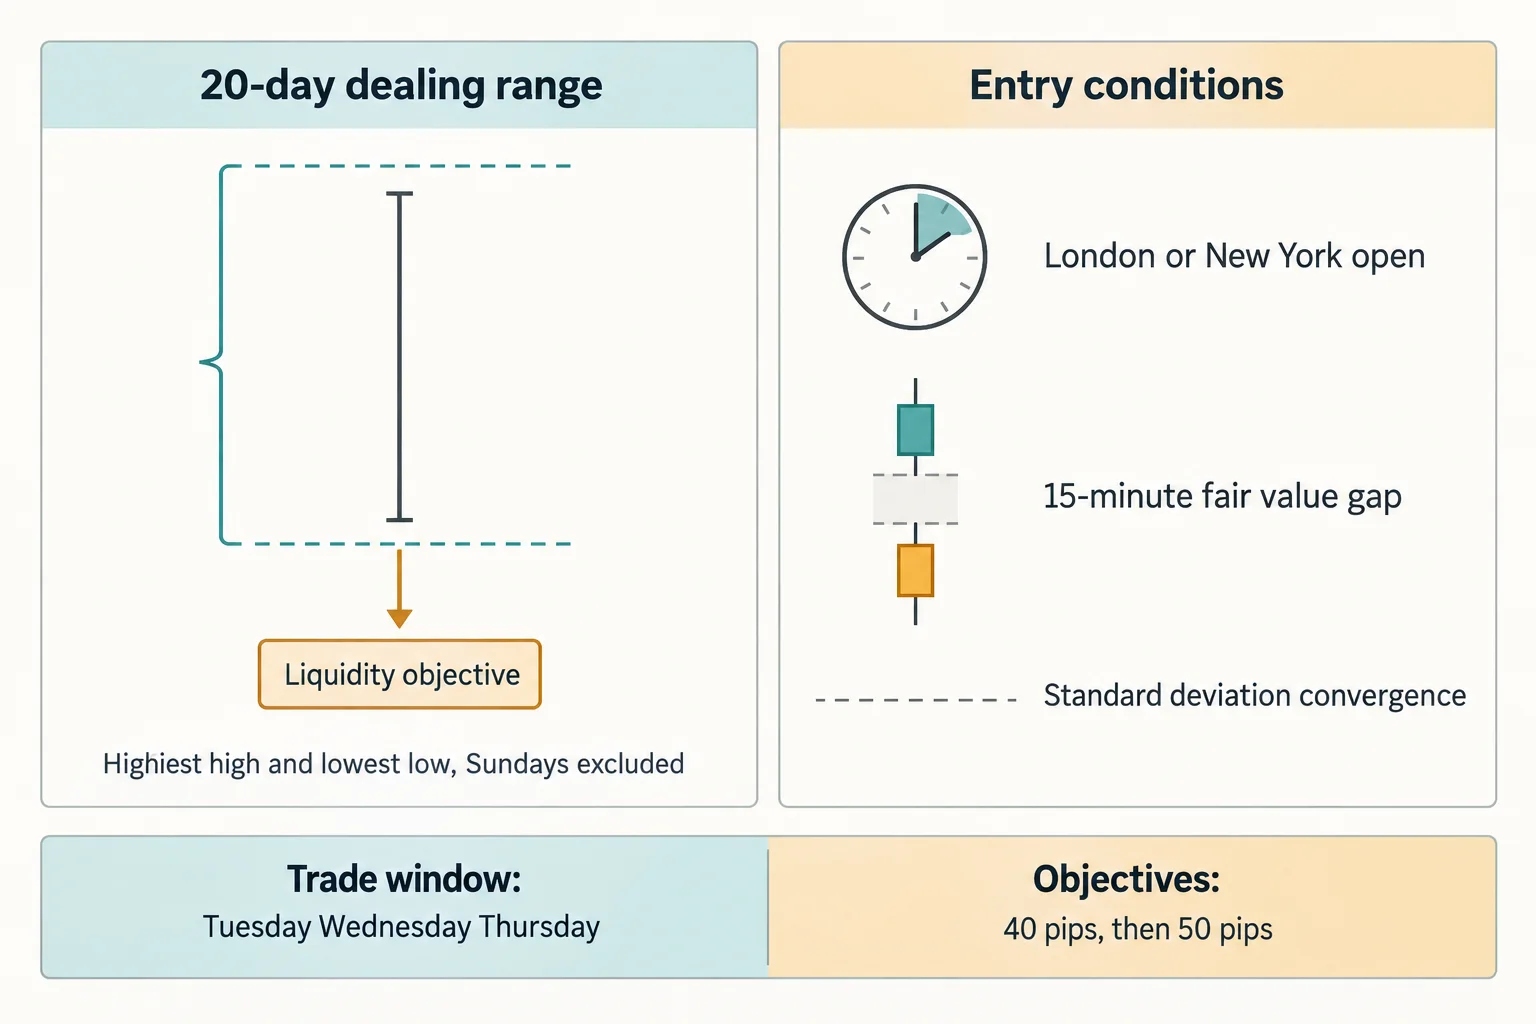
Apply the Model 5 Tuesday-to-Thursday Trade Filter
Execution starts at 6:19. For a bullish bias he takes the European open price on Tuesday and filters longs at or below that level when it overlaps a 15-minute discount fair value gap, then anticipates a five-minute institutional order flow entry on the retracement lower during the London or New York kill zone, or after a sell-stop raid (6:21). The bearish process reverses each element: premium gap, retracement higher, and a possible buy-stop raid (7:45).
The explicit filter is the day of the week. At 6:56 he says the underlying model can be traded any day, but this plan skips Monday and Friday (7:03), leaving Tuesday, Wednesday and Thursday. Thursday is conditional, and at 7:15 he describes it as a wild card: if Tuesday and Wednesday both produced large range days that went the trader’s way, he says to skip Thursday because consolidation or retracement is likely; if Tuesday’s favorable range was small and Wednesday’s was large, Thursday may have more room. He calls this the plan’s only caveat. These are his stated filters, not established tendencies of the market.
Manage Model 5 Trade Entries Stops and Objectives
Both management sections assume demo-account limit orders. For a short at 8:11, the entry is the standard-deviation and price-delivery-array convergence minus five pips, and if multiple orders are used they all take the same entry price. The objectives are staged – one position off at 40 pips, a second at 50 pips, and if a third order is working, 80% of it closed at 50 pips while the remainder is left to run (8:36 and 8:48). The long section at 9:45 repeats the structure with the entry at the convergence plus five pips.
Initial protection is 15 pips beyond the extreme of the setup: above the high for a short (plus 15 pips) and below the low for a long (minus 15 pips), as stated at 9:27 and 11:00. He then says he re-enters after a stop-out and monitors for a secondary entry, adding that day trades may take several attempts and that this should not be feared. Re-entry after a loss compounds the cost of being wrong, and the recording offers no statistics on how often the second attempt succeeds.
The stop policy is progressive and is described as identical across his models. At 25% of the expected objective the stop distance can be cut by a quarter, and at 50% it can be halved (11:19). At 75% of the objective the stop must be at break even (11:50). He stresses that at the halfway point the trader is still holding a losing stop by design and should not rush it to break even, strangle the position or try to push it into profit (11:34).
Adjust the Model 5 Trade Plan After Wins and Losses
From 12:34 he describes risk as R%, the percentage of the account risked per trade, and gives three rules for changing it. A full washout at the maximum stop cuts R% by half; once half of that loss is recovered, the original R% is permitted again – his example is that losing $100 requires earning back only $50 before returning to full size. A further loss at the reduced level halves it again, and the reduction continues until the earlier loss is 50% recovered (13:19). Separately, after five consecutive winning trades he drops R% by half, on the reasoning that a loss is likely eventually and that this levels the equity curve (13:29).
He closes at 13:51 by directing viewers to backtest the plan, collect multiple sample sets, and rewatch the Model 5 lessons if any step is unclear, adding that they should not wait on the samples he intends to provide (14:01). Backtesting rules against historical charts is how a trader checks whether the rules were applied consistently; it does not establish that the plan makes money going forward.
Understand the ICT Model 5 Source Limits
What the recording contains is a ruleset and a rationale. What it does not contain is evidence. No win rate, sample size, backtest result, drawdown profile or account record appears in the 14 minutes, and no trade in the video is identified as a real-money fill – the orders he describes are demo-account limit orders. The 40-to-50-pip framing is his stated objective for the model, not a measured average.
One limit is specific to this article’s source. The transcript used here is a local automatic speech recognition of the recording’s complete audio, not human-checked captions. It renders several words loosely – “IPTA data range” for the dealing range, “longs” as “lungs”, “conversions” for convergences, “PDRA” for price-delivery array – and one sentence it does not complete is the bullish standard-deviation limit noted above. The video’s charts and slides were not reviewed while writing, so every price, level and pip distance here is reported as something the speaker said rather than as verified chart data. The timestamp links point at the passages being described.
Watch the Original ICT Model 5 Recording
The embed above is the upload’s own YouTube player and it is left in place because it plays. This exact iframe markup was loaded from a BestProps origin on 15 September 2026 and clicked: playback advanced to 4.7 seconds of the recording’s own 852.0-second duration with no error notice and no owner restriction reported by the player, and the watch page reports the video as playable in an embed. All timestamp links in this article point into the same recording.
Explore ICT Model 5 Sources and Further Reading
- ICT Charter Price Action Model 5 \ Trade Plan – the recording itself. Watch page read 15 September 2026: about 61,900 views, 14 minutes 12 seconds, published 17 January 2024 at 6:11 p.m. Pacific (18 January 2024 UTC), playability status OK.[1]
- The Inner Circle Trader – the publishing channel’s own page, and the first-party record of what it uploads and when. It takes precedence over any reupload, mirror or third-party archive of the same lesson.[2]
- CFTC fraud advisory – commodity trading systems sold on the internet – the U.S. derivatives regulator’s warning that hypothetical results assume fills at specific prices, that stop orders may execute at a worse price or not at all, and that commissions raise the break-even point. Directly relevant to a plan whose objectives and stops are stated in pips.[3]
- CFTC Learn & Protect – forex frauds – the regulator’s statement that most retail foreign exchange traders lose money and that past results do not guarantee future success.[4]
- 17 CFR 4.41 – advertising by commodity pool operators and trading advisors – the rule governing hypothetical performance presentation, cited because the plan’s targets are stated rules rather than an audited track record.[5]
- Investor.gov – leverage – the SEC investor-education page explaining how leverage magnifies both gains and losses, since pip objectives are meaningless without the position size and margin behind them.[6]
Any ICT, smart-money or third-party indicator, script, spreadsheet, note set, transcript or social-media summary circulating outside the publishing channel’s own upload page is unofficial and untested here. Dealing range, draw on liquidity, price-delivery array, fair value gap, premium and discount are the speaker’s own vocabulary; this article reports his usage of them rather than endorsing them as verified market mechanics.
- [1] ICT Charter Price Action Model 5 \ Trade Plan – The Inner Circle Trader (watch page read 15 September 2026)
- [2] The Inner Circle Trader – official YouTube channel
- [3] CFTC – Beware of fraudulent trading systems (read 15 September 2026)
- [4] CFTC Learn & Protect – Forex Frauds (read 15 September 2026)
- [5] 17 CFR 4.41 – Advertising by commodity pool operators and trading advisors (read 15 September 2026)
- [6] Investor.gov – Leverage (read 15 September 2026)
This is independent educational commentary on one speaker’s framework. It is not official ICT material, it is not a tested trading system, and it is not investment advice or a promise that the approach will produce profits. Leveraged trading involves substantial risk and is not suitable for everyone.