
Key takeaways
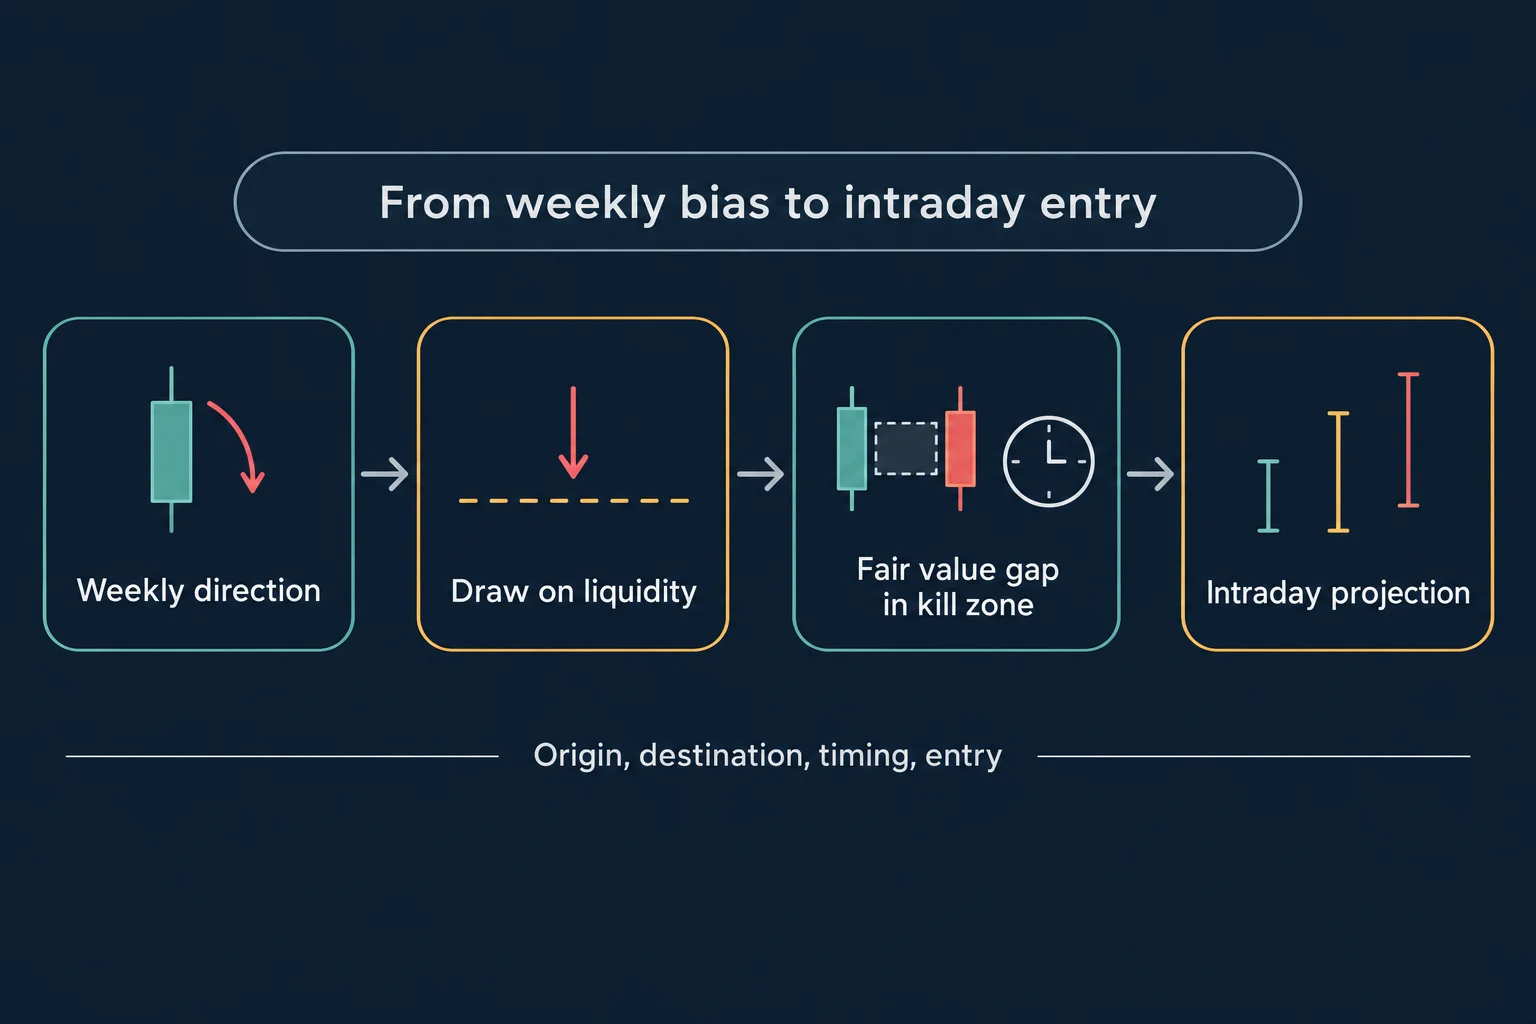
ICT’s supplementary Model 5 lesson walks through one historical USD/CAD week to show how the model joins four decisions: higher-time-frame direction, a specific draw on liquidity, a fair value gap entry filtered by where the gap sits inside the previous day’s range, and an intraday standard-deviation projection used as the target.
Read the full summary
ICT’s supplementary Model 5 lesson walks through one historical USD/CAD week to show how the model joins four decisions: higher-time-frame direction, a specific draw on liquidity, a fair value gap entry filtered by where the gap sits inside the previous day’s range, and an intraday standard-deviation projection used as the target. The example week is the one ending 28 June 2019; the video itself was uploaded 16 January 2024, and the two dates should not be confused. His bearish weekly read is a “power of three” profile – a weekly open, little or no upside, and most of the range expanding downward. The objective is an old low and the sell-side liquidity resting beneath it, which he quotes as 130.67 and 7 pipettes and rounds to 130.68 for feeds without fractional pips, then calibrates to 130.70 as the nearest full level. Entries are the first return to a fair value gap inside a London or New York kill zone, taking the low end of a bearish gap or the high end of a bullish one rather than waiting for a full fill. The stated aim is 40 to 50 pips per setup. Every price, level and outcome here is spoken over charts he was annotating; the recording is not evidence that the example was traded or that the levels were reachable as described.
How we researched this article
BestProps used document-based research from primary firm sources, checked September 24, 2026. The complete source list, scope, limitations, and commercial-state record appear near the end of this article.
In ICT Charter Price Action Model 5 \ Supplementary Lesson, a 48-minute-44-second upload from the Inner Circle Trader, ICT revisits the day-trading model he presented in the Model 5 lessons and applies it end to end to a single week of USD/CAD. He frames the session at 0:13 as a day-trading model, and at 4:43 describes day trading and very short-term participation inside the weekly range as his own expertise – while adding that this is what suits him, not a claim that it suits everyone.
The stated purpose is assembly rather than new concepts. At 1:49 he calls it a simple recipe, on the basis that the components were already covered in his core material and students may simply not know how to fit them together. His sequence is to establish a point of origin, determine the direction of the move, define what price is being drawn toward, and only then look for an intraday entry consistent with that thesis (2:53).
One dating point needs care. The market example is the week ending 28 June 2019 (2:16), while the upload page records the video as published 16 January 2024 at 6:00 p.m. Pacific – 17 January 2024 UTC. These describe two different things: when the market example occurred, and when the recording was published. They do not conflict.
Start the ICT Model With Higher Time Frame Direction
The example opens with a bearish weekly read on USD/CAD. At 6:11 ICT describes using “power three” on the weekly chart – looking for the weekly open, very modest upside if any, and the majority of the range on the downside – and states at 6:22 that his weekly power-of-three read is bearish, so he wants to be short. He is explicit at 5:59 that this is not an attempt to predict the weekly close, only to anticipate expansion in one direction rather than the other.
The direction alone is not treated as sufficient. He says a bias needs a destination and supporting context, and at 3:26 names the fair value gap as the setup’s point of origin before dropping to the weekly and daily charts to frame the expected range expansion. This is his interpretation of that chart, not an independently established forecasting rule.
Define the ICT Model Draw on Liquidity
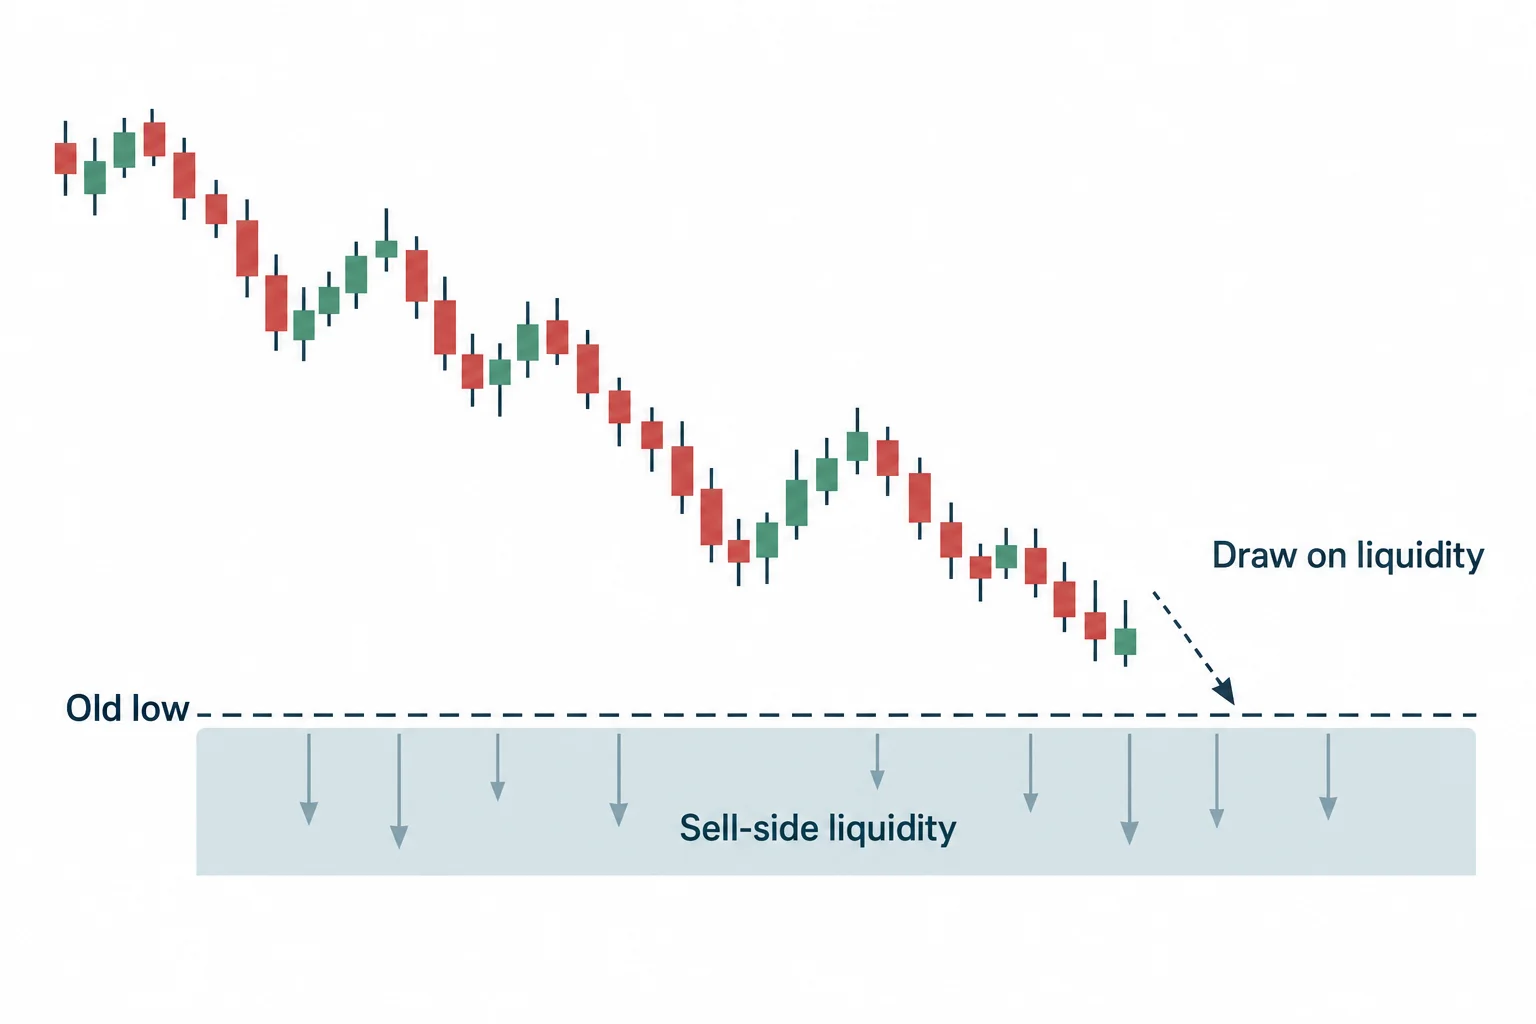
At 6:34 he identifies the draw on liquidity as an old low, with the sell-side liquidity resting beneath it as the objective – described again at 10:20 as the terminus of the analysis. He notes that a previously filled fair value gap (his phrasing is a sell-side imbalance and buy-side inefficiency) had already been filled, and that he had recently taken a bearish near-term stance on the dollar, mentioning gold as a related market worth watching because of how it might interact.
The specific level he quotes is “130.67 and 7 pipettes” (8:58), which he says becomes 130.68 on any broker that does not display fractional pips (9:02). He then applies a calibration rule: target the nearest full 10 or 5 level, without rounding lower than the actual low when price is expanding down toward it (23:51). Applying that to the 130.68 low makes the working level 130.70, since 70 is the nearest full 10 level above it (21:52 and 20:49).
He also reports how that level resolved in the example: the Friday low he describes came in at 130.59, roughly 10 to 11 pips below the 130.70 level (22:17 and 22:36). All of these numbers come from his narration over an annotated historical chart. The transcript cannot verify the feed, the displayed prices or the markings, and none of it establishes that he traded the levels.
Filter ICT Fair Value Gaps by Daily Range and Session
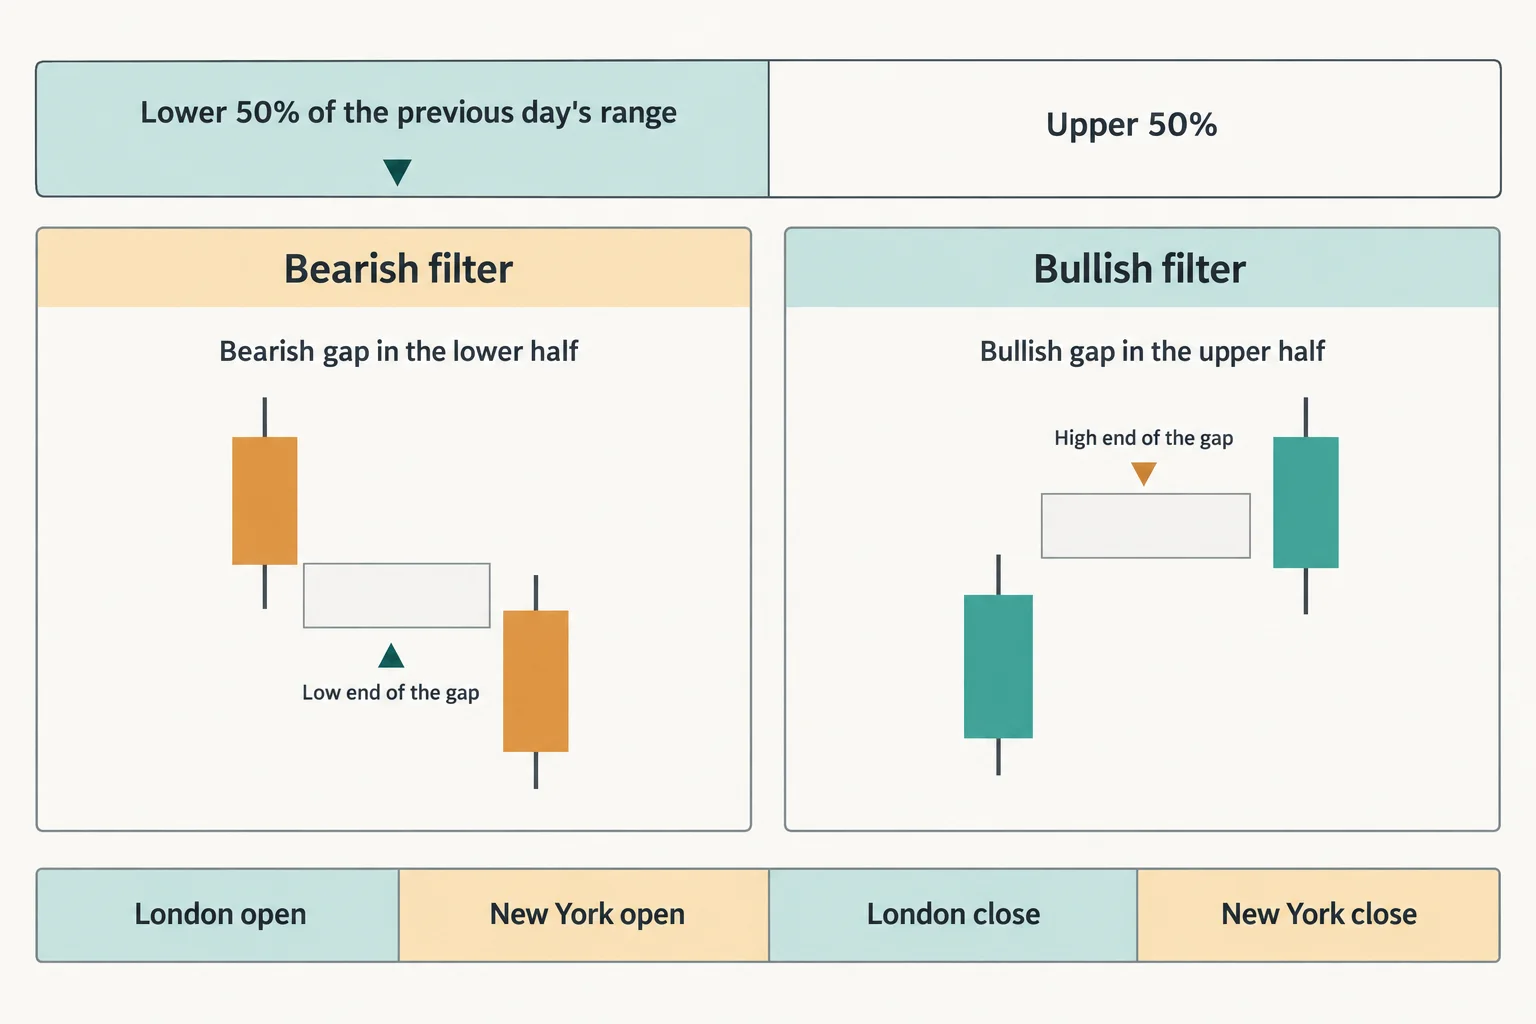
The next step is daily. At 9:10 he says he stocks a fair value gap each day using the previous day’s range, and at 9:23 gives the positional filter: in a bearish market the higher-probability gaps form in the lower 50% of the previous daily range, and in a bullish market the inverse applies, with gaps in the upper half (9:59). He conditions the bullish version on the higher-time-frame factors also supporting higher prices – the gap position alone is not the trigger.
Timing is the second filter, and the first return matters. At 10:51 he specifies the first return to a fair value gap during a kill zone, naming the London and New York kill zones as the ones specific to this model, with the London close available and New York close described as more suited to longer-term continuation entries rather than the day-trade setup (11:13 and 11:27).
For the entry itself he refers to his institutional order flow entry drill and states at 13:13 that he is not waiting for the whole gap or for its midpoint: the entry is the lowest point of a bearish gap when selling short, or the highest point of a bullish gap when buying (13:26). These are his own definitions and should not be read as standard market terminology.
Use ICT Intraday Projections as Price Objectives
Once the setup is identified, he uses confluence among intraday standard-deviation projections derived from several ranges – the central-bank dealers range and the Asian range are named alongside one term his captions render repeatedly as “flout” (13:45). That term is not resolvable from this transcript. It appears throughout the lesson as a range parameter he plots daily alongside the other two, and its exact meaning cannot be confirmed from the audio without the original course vocabulary or the charts, so it is left unexpanded here rather than guessed at.
The stated objective is at 13:57, where he says the model specifically aims for 40 to 50 pips per setup, adding at 14:55 that holding for more can be treated as a modular route to the 50 to 75 pips he says he personally works toward. Those are stated targets for the model and for his own use, not measured averages.
He is also explicit that the setup is not automatic. At 15:05 he says he does not always get the 75-pip upper end in a single setup and may need two or more trades across a week, and at 15:12 he allows for a loss, a missed move, or exiting a position before it resolved either way – which he calls a scratch – followed by another attempt.
How ICT Applies Model 5 to a Historical Week
The 15-minute review begins at 16:07, where he overlays a 40-pip band on the week’s day dividers and argues there was little in the way of resistance to a 40-pip run on the Thursday (16:32), then walks successive days describing roughly 40-pip downside ranges offered on each (16:48 and 17:09). On which days to hunt, he says at 17:36 that the model can be traded on any day but can be filtered to Tuesday, Wednesday and Thursday, and at 17:46 that Tuesday and Wednesday are, in his opinion, the highest-probability days – while noting plainly that this does not mean a setup will appear.
A methodological point follows. At 18:55 he removes the labels from the standard-deviation lines, explaining at 19:24 and 20:25 that the labels had caused confusion and that what matters is clustering rather than matching one numbered deviation to another. He plots ranges on both wicks and bodies, since Model 5 calls for calibrating standard deviations on both (25:33), and treats projections within about five pips of one another as a meaningful level of confluence (27:07).
The five-minute review at 34:06 identifies specific historical bearish fair value gaps, an order block and session-based retracements that he reads as repeated opportunities aligned with the bearish weekly objective. Because the source is a transcript rather than chart images, the article can record what he said about those markings but cannot confirm them, nor any hypothetical entry, stop placement, drawdown or obtainable fill.
ICT Model 5 Supplementary Lesson Takeaways
Four habits carry across the walkthrough. Build the thesis from larger to smaller time frames, since the weekly direction and the daily objective are settled before any five- or 15-minute entry is considered. Keep invalidation and execution rules separate, because a bias, a target, a session window and an entry pattern do different jobs. Do not read hindsight examples as performance evidence – this is one historical week annotated after the fact, not a controlled test. And treat the analysis as probabilistic: at 45:57 he says directly that he does not know with absolute certainty, and at 46:03 that he only holds a high degree of probability that the market will do what he expects “most times”.
What the recording does not contain is evidence of results. Across 48 minutes there is no win rate, no sample size, no backtest output, no drawdown profile and no account statement, and no trade in the example is identified as a real-money fill. The pip targets and the quoted levels are the speaker’s stated plan and his reading of a chart he was annotating.
One limit is specific to this article’s source. The transcript used here is a local automatic speech recognition of the recording’s complete audio, not human-checked captions. It renders the one unnamed range parameter inconsistently as “flout”, turns “pipettes” into a spoken form he has to explain, and occasionally garbles ordinary words. Where a term could not be resolved from context it is left flagged rather than normalized, and the video’s charts were not reviewed while writing. Every price and pip distance is reported as something the speaker said.
Watch the original recording
The embed above is the upload’s own YouTube player and it is left in place because it plays. This exact iframe markup was loaded from a BestProps origin on 15 September 2026 and clicked: playback advanced to 5.8 seconds of the recording’s own 2923.8-second duration with no error notice and no owner restriction reported by the player, and the watch page reports the video as playable in an embed. All timestamp links in this article point into the same recording.
Source and further reading
- ICT Charter Price Action Model 5 \ Supplementary Lesson – the recording itself. Watch page read 15 September 2026: about 80,100 views, 48 minutes 44 seconds, published 16 January 2024 at 6:00 p.m. Pacific (17 January 2024 UTC), playability status OK.[1]
- The Inner Circle Trader – the publishing channel’s own page, and the first-party record of what it uploads and when. It takes precedence over any reupload, mirror or third-party archive of the same lesson.[2]
- CFTC fraud advisory – commodity trading systems sold on the internet – the U.S. derivatives regulator’s warning that hypothetical results assume fills at specific prices, that stop orders may execute at a worse price or not at all, and that commissions raise the break-even point. Relevant to a walkthrough built on annotated historical charts.[3]
- CFTC Learn & Protect – forex frauds – the regulator’s statement that most retail foreign exchange traders lose money and that past results do not guarantee future success.[4]
- 17 CFR 4.41 – advertising by commodity pool operators and trading advisors – the rule governing hypothetical performance presentation, cited because the lesson’s examples are annotated chart walkthroughs rather than audited outcomes.[5]
- Investor.gov – leverage – the SEC investor-education page explaining how leverage magnifies both gains and losses, since a pip objective means nothing without the position size and margin behind it.[6]
Any ICT, smart-money or third-party indicator, script, spreadsheet, note set, transcript or social-media summary circulating outside the publishing channel’s own upload page is unofficial and untested here. Power of three, draw on liquidity, fair value gap, kill zone, institutional order flow entry drill and standard-deviation projection are the speaker’s own vocabulary; this article reports his usage of them not as verified market mechanics.
- [1] ICT Charter Price Action Model 5 \ Supplementary Lesson – The Inner Circle Trader (watch page read 15 September 2026)
- [2] The Inner Circle Trader – official YouTube channel
- [3] CFTC – Beware of fraudulent trading systems (read 15 September 2026)
- [4] CFTC Learn & Protect – Forex Frauds (read 15 September 2026)
- [5] 17 CFR 4.41 – Advertising by commodity pool operators and trading advisors (read 15 September 2026)
- [6] Investor.gov – Leverage (read 15 September 2026)
This is independent educational commentary on one speaker’s framework. It is not official ICT material, it is not a tested trading system, and it is not investment advice or a promise that the approach will produce profits. Leveraged trading involves substantial risk and is not suitable for everyone.