
Key takeaways
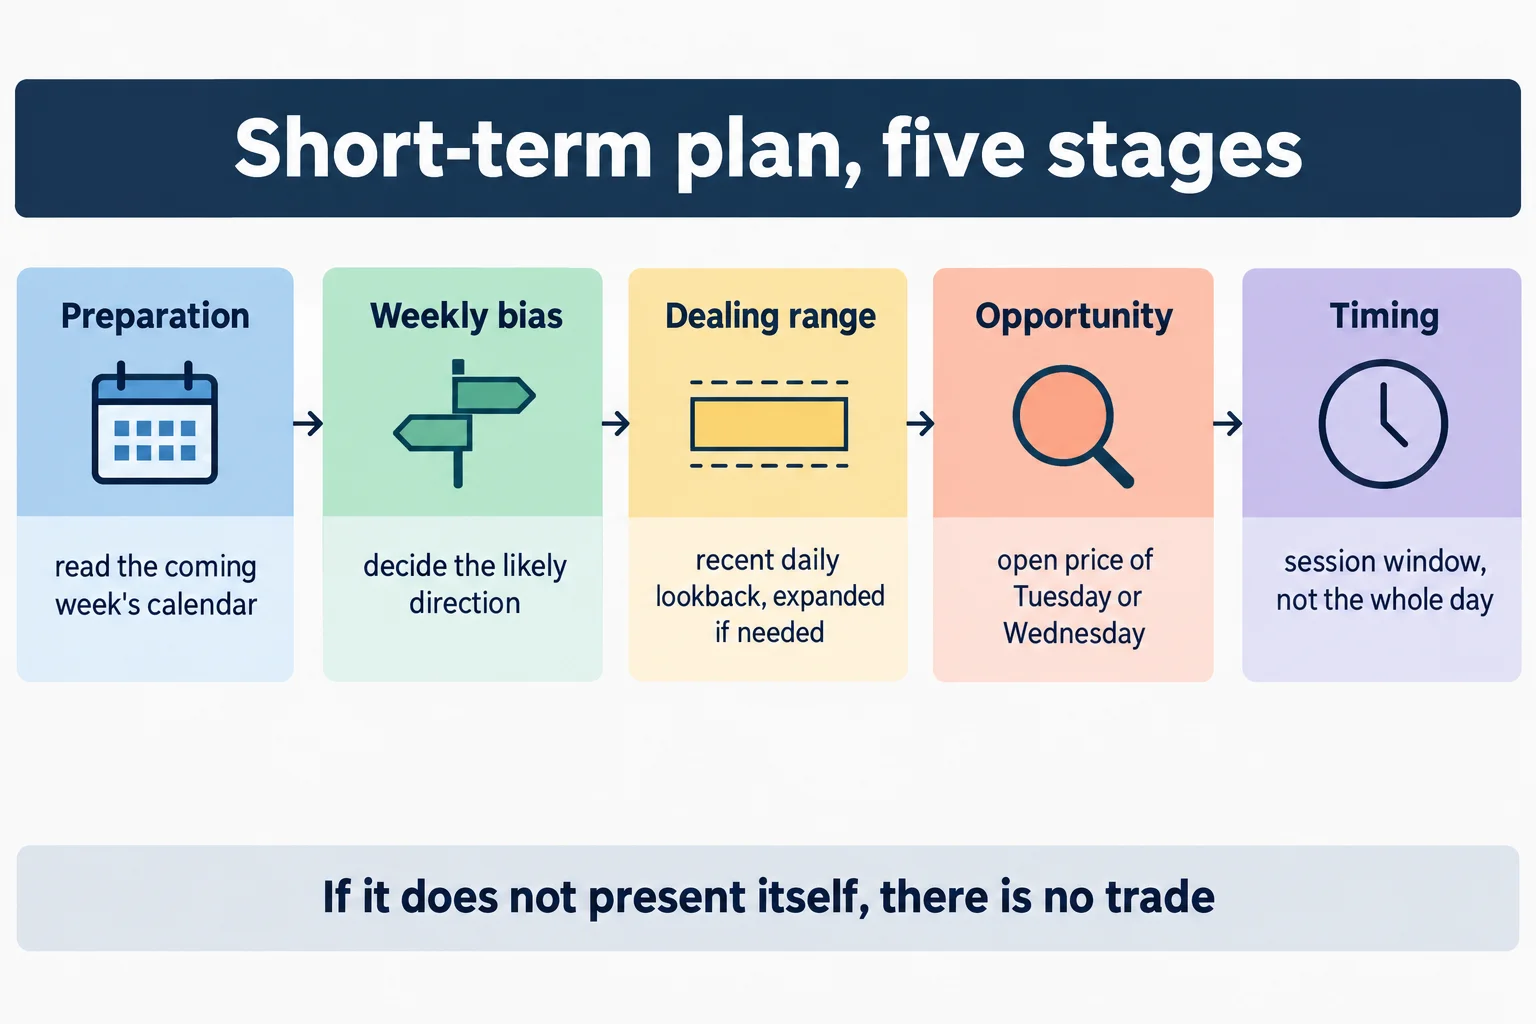
ICT Charter Price Action Model 2 \ Trade Plan & Algorithmic Theory, published on the channel in early January 2024, sets out a short-term plan organised into five stages: preparation, opportunity discovery, trade planning, trade execution and trade management.
Read the full summary
ICT Charter Price Action Model 2 \ Trade Plan & Algorithmic Theory, published on the channel in early January 2024, sets out a short-term plan organised into five stages: preparation, opportunity discovery, trade planning, trade execution and trade management. The stated objective is 50 to 100 pips per trade, with entries framed around the Tuesday or Wednesday opening price, a 20-day dealing range that expands to 40 or 60 days when it holds nothing useful, and a fixed progression of targets. The second half is a 40-minute retrospective walkthrough of EUR/USD in the week of 4 April 2022, which he presents as live-called ahead of time. Everything here is his spoken instruction read from slides and charts this source cannot see: the recording is automatic speech recognition of the audio, no chart was inspected, and his pip figures, fills and reward claims are reported as his statements rather than verified results. He also states that the orders in the plan sit in a demo account.
How we researched this article
BestProps used document-based research from primary firm sources, checked September 24, 2026. The complete source list, scope, limitations, and commercial-state record appear near the end of this article.
What ICT Price Action Model 2 Covers
At 0:03 he introduces the recording as “price action model number two, short-term trading plan, 50 to 100 pips per trade”, and at 0:26 he repeats the objective. At 0:52 he names the process every trade plan follows – preparation, opportunity discovery, trade planning, trade execution and trade management – and those five stages are the spine of the first half.
At 20:16 the recording changes gear. He says he is moving to “algorithmic theory” and that he has removed members who leaked or resold his material, and at 20:43 he explains that this is why he will no longer type out slides for the audience. The practical consequence for a reader is that the second half is delivered over charts rather than a written rules list, which is exactly the material this audio-only source is weakest at conveying.
The example and the publication date are separate facts. The watch page records the recording as published 3 January 2024 at 18:00 Pacific, which is 4 January 2024 in UTC – the inventory date reflects the UTC day. Inside the recording he says at 24:23 that “today is the 9th of April 2022” and that the week being discussed had just closed, and at 24:28 that it is a Saturday. Those are statements about a session recorded in April 2022, not a claim about the recording’s upload date.
ICT Trade Plan Preparation and Weekly Price Bias
At 1:10 he says preparation always begins with the coming week’s economic calendar, noting the medium- and high-impact events for the markets he intends to follow. At 1:22 he says the study is how the current market structure and those calendar events may suggest a specific weekly profile, and at 2:09 he gives the concrete version: if a high-impact event is centred on the Tuesday London Open, he will be looking at the Tuesday-low-of-the-week profile, or the Wednesday equivalent. At 2:01 he concedes the process is “not going to be 100% based on just that because there’s always a variable”.
The dealing range comes next. At 2:31 he defines a lookback he calls the “IPTA data range” of the last 20 trading days, and at 2:35 adds that Sundays are not counted; the highest high and lowest low of that window become the current dealing range. That acronym is not defined in the recording, and at 9:24 the same automated transcript renders it as “IFTTT data range” – so the label is reported as the transcript produced it, not normalised into a term the source does not confirm. The mechanics attached to it are unambiguous, which is what matters for a reader.
At 3:12 he covers what to do when that window is exhausted: look back 40 days, and if the same problem persists, 60. At 3:40 he gives the fallback – if nothing clear and logical appears even in the 60-day lookback, “you’re going to have to choose another market to trade or sit on your hands”. At 3:54 the objective is framed as the next draw on liquidity: an old high, old low, fair value gap or liquidity pool. At 4:01 he sets direction: premium arrays are sought when bullish and discount arrays when bearish, which reads as the reverse of the usual framing and is a place the transcript may have swapped the pair. At 4:41 he states the gate plainly: “if it doesn’t present itself, then we have no trade”.
Finding ICT Trade Opportunities Tuesday or Wednesday
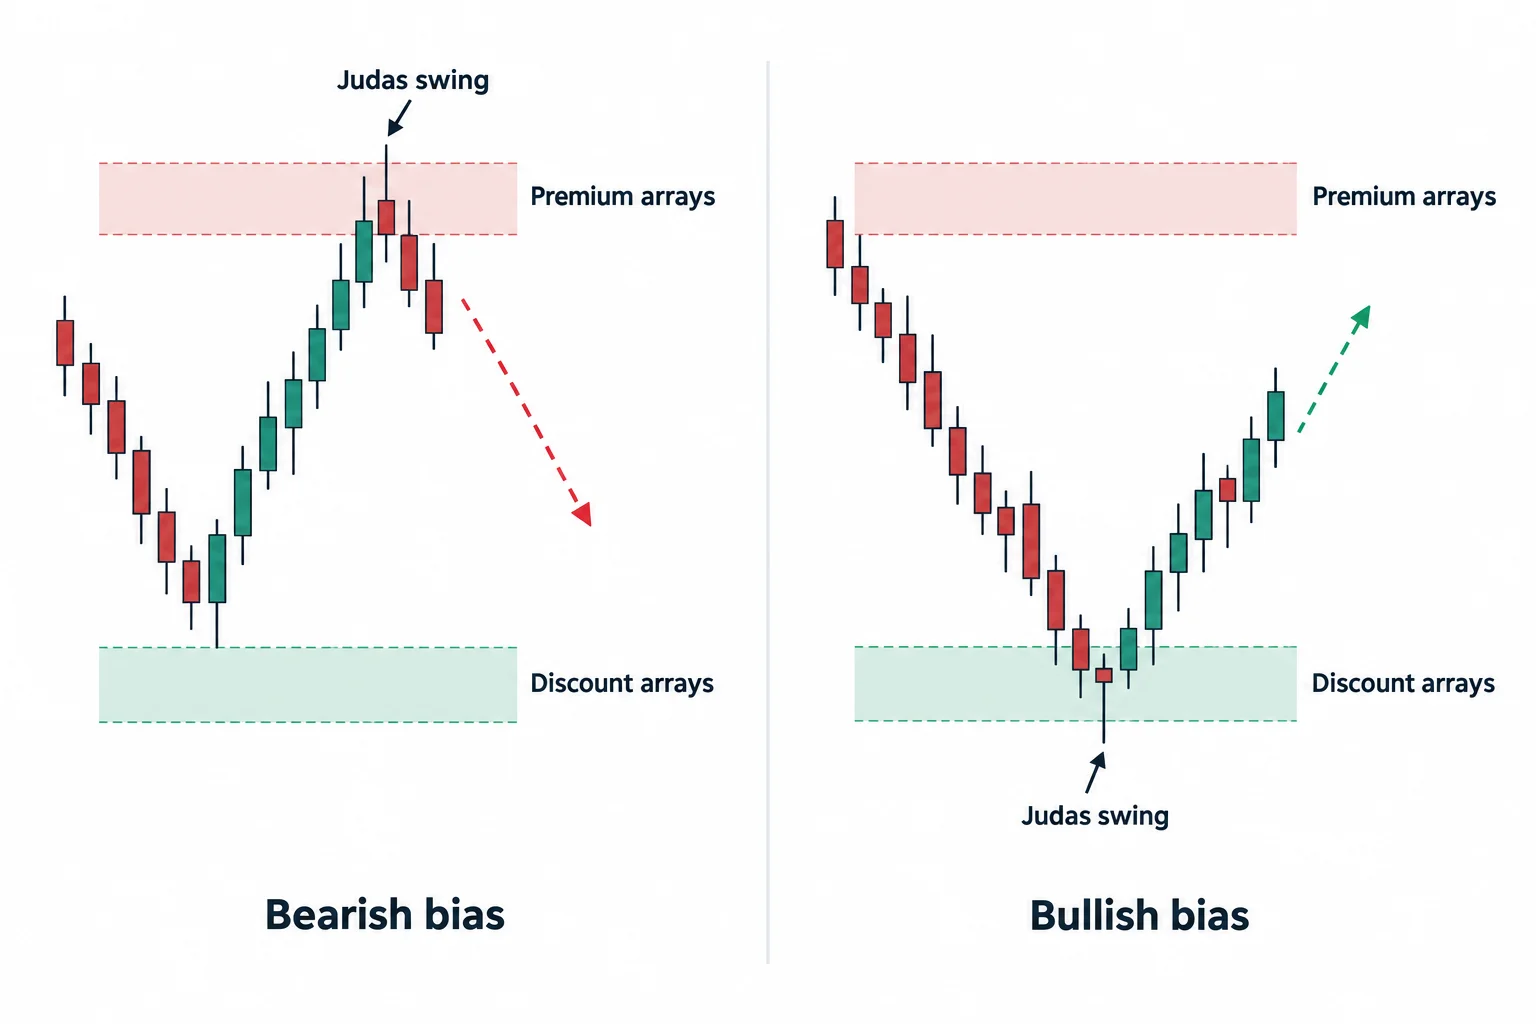
At 4:52 the search narrows to two days. At 4:54 he identifies discount arrays beneath Tuesday’s European opening price, at 5:05 premium arrays above it, and at 5:17 and 5:28 the same two operations against Wednesday’s opening price. At 5:42 he sets the priority: if the setup does not form on Tuesday, Wednesday is still considered.
What he then waits for is a move against his intended direction. At 6:00 he describes looking for manipulation opposite the trade bias at a time the calendar suggests a volatility injection, at 6:08 sharp movement in the opposite direction trading into his predetermined entry, and at 6:22 he names it a “Judas swing”, restated at 6:24 as a period of market protraction. At 6:31 he puts it in directional terms – shoot up when going short, shoot down when going long – and at 6:39 insists the plan is not chasing price. He also flags the Thursday time element at 7:25 and 8:15, where he says the weekly low, or in the inverted case the weekly high, tends to form during the Thursday New York session.
ICT Price Action Entry Rules and Time Filters
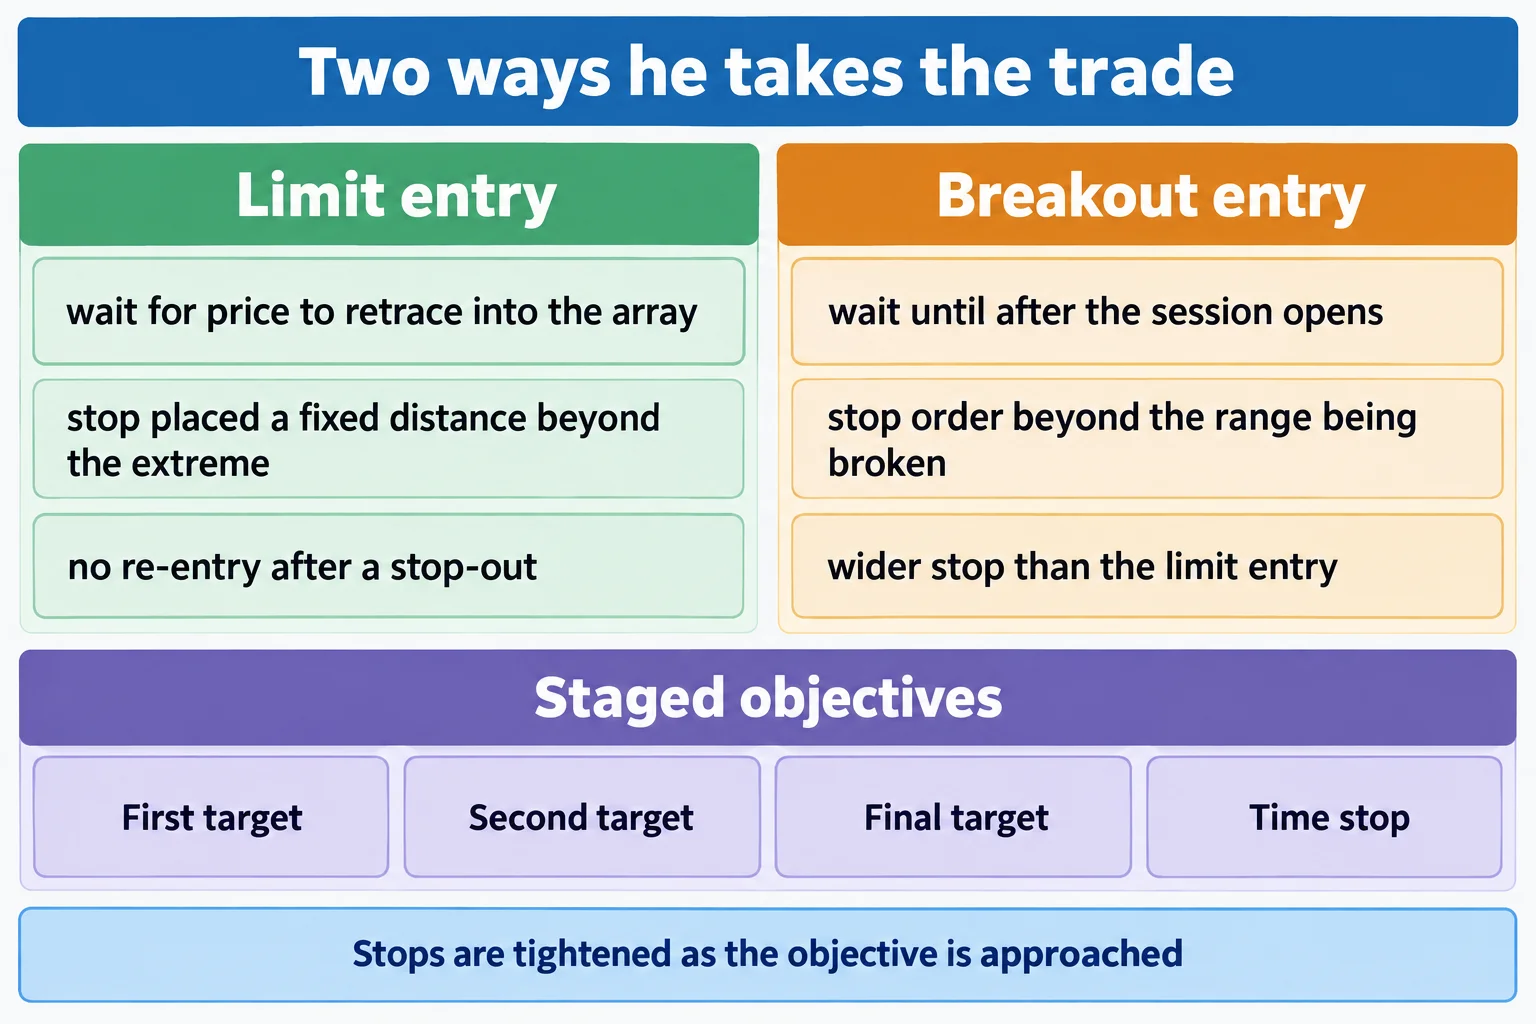
The primary entry is a retracement entry. At 6:50 he describes framing a short when price moves up into a 15-minute premium array that converges with a standard deviation of no more than three, and at 10:15 he says the 15-minute optimal trade entry is expected to form during the London Open or New York Open kill zones. At 7:07, 7:55 and 8:04 he names the three reference ranges he will project from: the Asian range, the central bank dealers range, and a term the transcript renders as “FLOUT” or “flout levels”. At 40:33 he says a trader can use FLOUT or the Central Bank Dealers Range, whichever they prefer. As with the data-range acronym, FLOUT is left unresolved here because the recording never defines it.
The alternative is a breakout entry. At 10:29 he says that when bullish he will note the Asian range high on Tuesday and place a buy stop one pip above it after 2:00 a.m. Eastern, and at 12:18 that when bearish he will note the Asian range low and place a sell stop one pip below it after the same time. At 10:40 he defends it as buying strength rather than chasing, and at 11:37 describes letting the market seek its own low and then buying the breakout. At 11:53 he adds the mirror filter, saying that when bearish he filters shorts to those at or above Tuesday’s European opening price. At 12:01 the transcript describes the bearish case as a 15-minute optimal trade entry inside the retracement higher “or a buy-stop read”; that phrase is uncertain in the audio and is reported rather than corrected, because the alternative execution he expands on immediately afterwards is the sell stop described above.
ICT Trade Plan Targets, Stops and Management
At 13:16 he describes the entry price for the limit method as the standard-deviation and PD-array convergence adjusted by five pips, and at 13:36 gives the objective ladder: a limit order to take 50 pips on one position, a second to take 75 pips, and at 13:51 the instruction that if the 100-pip objective is captured the trade is closed. At 14:10 he places the protective stop above the high plus 25 pips for the short version, and at 15:15 below the low minus 25 pips for the long. At 14:14 and 14:21 he states the no-re-entry rule he calls “one and done”, and at 13:46 he notes multiple orders are used to manage one idea.
The stop is then tightened in stages. At 15:29 he says the stop can be reduced by 25% once the trade is 25% of the way to the expected objective, at 15:35 by 50% at the halfway point, and at 15:42 that at 75% of the objective the stop must be at break-even or better. In the walkthrough he restates the same 25/50/75 progression at 62:10 and 62:39.
The time stop is the least conventional part of the plan and appears to be an explicit acceptance of foregone profit. At 31:41 he says Thursday is the day the trade must be closed on time regardless of where it stands, at 31:50 that if it is more than 50 pips in profit it is closed, and at 32:03 that the New York Open is where the trade closes for this model. At 32:06 he says plainly that it will leave pips on the table and can exit before a larger Thursday move, and at 32:20 that the point is a short-term approach the student is expected to adapt or strip the time element out of.
ICT Trade Plan Position Sizing and Loss Risk
At 15:52 he introduces money management, and at 16:00 gives the sizing formula as account equity times the risk percentage divided by the stop distance in pips. His worked example at 16:24 uses a 20,000-dollar account and 1.5% risk, and at 17:05 and 17:11 he compares the resulting micro, mini and standard lot sizes, telling the viewer to always round down. At 18:34 he points out that the 25-pip stop in the management rules would require recalculating that example, so the demonstration and the rules as written are not perfectly consistent.
The risk rules after a loss are stated in the third person, which is worth noting. At 19:08 the transcript says the risk percentage is dropped by 50% after an assumed loss and permitted back to maximum once half the loss is recovered, and at 19:15 that a loss on the reduced size halves it again. At 19:31 he adds the unusual counterpart: after a series of five winning trades in a row, drop the risk percentage by 50%. At 19:37 and 19:45 he gives the rationale – building in equity levelling and aiming for a smooth equity curve rather than deep declines. Those are his stated aims, not demonstrated outcomes, and the recording offers no sample showing the scheme working.
One more detail matters for anyone reading the sizing paragraph closely: at 13:10 and 14:25 the transcript has him placing the orders “on a demo account”. The plan therefore arrives as instruction set against a practice account, and no funded account record is presented anywhere in the recording.
ICT Price Action Model 2 EUR/USD Walkthrough
The second half is a retrospective application. At 23:59 he says the model hinges on what the weekly range is going to do, and at 24:23 sets the scene as the week that had just closed, on 9 April 2022. At 26:09 he identifies what he calls a volume imbalance, at 26:41 he begins the 20-day lookback to find the discount arrays, and at 27:23 locates the lowest low of that window. At 27:34 he describes price retracing into a premium array formed between a recent range high and range low, and at 28:06 states the expectation of lower prices in the coming weekly candle.
At 29:55 he lists the three discount arrays he is aiming at: an old low, a rejection block, and the midpoint he calls the consequent encroachment of the lowest candle’s tail. At 30:50 he notes that explaining the process takes longer than doing it, and at 31:09 adds that the best-case array is not actually required to be profitable. He then descends through the timeframes – weekly context first, then daily from 30:40, hourly and 15-minute around 35:49, and the five-minute chart from 37:11.
At 40:10 he points to three standard deviations on the chart, at 40:23 explains he prefers measuring with candle bodies rather than wicks, and at 42:06 moves to the 2:00 a.m. kill zone. At 50:15 and 51:07 he reads levels off the chart that the transcript renders as 1.0891 and 1.08815, and at 52:15 describes a 100-pip move from entry clustering with a negative nine standard deviation. At 52:30 he says the day delivered the 100 pips, and at 52:58 argues the model does not need more than that.
At 56:42 he demonstrates the alternative entry on the same example, placing a sell stop one pip below the Asian range low after the rally, at 56:58 calling it selling weakness once the intraday high is established, and at 57:25 noting that this entry carries a 50-pip stop. At 45:41 he had made the same comparison in the other direction, saying the premium-array entry uses a 25-pip stop while the alternative uses 50.
He closes the walkthrough with the order management and a claim about his own calls. At 61:01 he describes placing two orders, taking 50 pips off one and holding the second for the 100-pip objective, and at 61:37 notes the first fill came before Thursday was ever reached. At 62:58 he says the model could have been applied to this actual event, and at 63:01 says “we called Euro lower”. Those are claims about the value of a prior call. Nothing in the recording is an audited record: there is no account statement, no broker confirmation and no way for this source to check the chart coordinates he is reading.
ICT Price Action Model 2 Trade Plan Checklist
- Read the coming week’s calendar and form a weekly profile, then decide the direction of the weekly range (1:10, 1:22).
- Build a 20-day dealing range excluding Sundays, expanding to 40 or 60 days if it holds nothing usable, and leave the market if it still does not (2:31, 3:12, 3:40).
- Locate the next draw on liquidity and mark the arrays that sit between price and it (3:54, 29:55).
- Restrict entry work to the Tuesday or Wednesday opening price, and to the London or New York session windows (4:54, 10:15).
- Choose between the limit entry at the array convergence and the breakout stop one pip beyond the Asian range extreme after 2:00 a.m. Eastern (13:16, 10:29).
- Stage the exits at the stated interim levels, tighten the stop on the 25/50/75 schedule, and treat a stop-out as final (13:36, 15:29, 14:21).
- Close on the Thursday New York Open time stop, accepting that it gives up some move (31:41, 32:06).
What the Recording Does Not Establish
The source used here is automatic speech recognition of the recording’s audio, not human-checked captions, and none of the charts were seen. That limits what can be asserted. The transcript returns several terms it cannot resolve – the “IPTA data range” at 2:31 and again as “IFTTT data range” at 9:24, the “FLOUT” range at 7:13, and the “buy-stop read” at 12:01 – and it also renders “sell limit” as “cell limit” and “sell stop” as “cell stop” in the management slides. Prices read aloud are the most fragile values of all, which is why the levels above are given as the transcript produced them.
Several things a reader might expect are absent. There is no win rate, no sample size, no backtest and no drawdown record. The worked example is a single week of one currency pair, and at 19:58 he tells viewers to collect a month or two of sample sets of their own rather than rely on his. The stated objective of 50 to 100 pips per trade is an aim, not a measured distribution. He asserts at 23:42 that the models “absolutely work” and at 66:30 that it “absolutely works” and is “very, very precise”; those are statements of confidence about his own material, and the recording contains no evidence independent of his own chart reading to support them.
One further point deserves stating because it is easy to miss in the walkthrough. The example is presented after the fact, over a week he describes as already closed, and he says at 26:55 that it is “using a hypothetical” while also describing it as a call made in advance. A retrospective chart walkthrough of this kind cannot distinguish a model that works from a model that was fitted to a week that already happened, and nothing in the recording is designed to make that distinction.
Watch the ICT Price Action Model 2 Recording
The recording runs about 66 minutes 50 seconds and is the only primary source used here. The channel is The Inner Circle Trader on YouTube. Because the plan is presented on slides and the walkthrough runs over charts, watching it is the only way to see the levels and arrays named above.
Resources
These are the sources checked for this article. The Federal Reserve series is the official publication of the exchange-rate data underlying the example, and the CFTC pages are regulator and investor-education material. None of it is an assessment of ICT, of Price Action Model 2 or of anything said in the recording. Copies, notes and second-hand summaries of this charter lesson circulating elsewhere are unofficial and untested here.