
Key takeaways
In ICT Charter Price Action Model 2 \ Amplified Lecture, ICT sets out a short-term plan built on the expectation that a weekly candle expands away from its opening price.
Read the full summary
In ICT Charter Price Action Model 2 \ Amplified Lecture, ICT sets out a short-term plan built on the expectation that a weekly candle expands away from its opening price. The base model has three parts he names at 1:01 – a weekly directional stage, a range-expansion setup and a pattern drawn from opposing arrays. Its only reference price is the opening price of Tuesday’s 400 candle, and its minimum time objective is Thursday’s New York open; he states a target band of roughly 50 to 100 pips at 21:21. The amplified half answers a narrower question – what to do once that objective has already been reached at a premium or discount array – and answers it by waiting for a market-structure shift and then switching the filter to what he calls the 600 European open (24:23). He works a USD/CAD example for the base half and a GBP/USD and USD/CAD set for the amplification, with a stated aside that he teaches on a demo account. Every price, level and outcome in the lesson is spoken over charts this article cannot see, no fill or statement accompanies any of it, and nothing here is a tested result or a recommendation.
How we researched this article
BestProps used document-based research from primary firm sources, checked September 24, 2026. The complete source list, scope, limitations, and commercial-state record appear near the end of this article.
This is a summary of ICT’s stated model, not evidence that it has an edge. The examples are discussed retrospectively, and a transcript can establish what he said; it cannot verify chart markings, quoted prices, entries, fills or later results. Where a claim rests only on his own assertion, the article says so.
Stage, setup and pattern: the three parts of Model 2
ICT opens by describing Model 2 as a short-term approach to weekly range expansion rather than a restatement of his wider teaching, saying at 0:45 that the point is to pull selected segments of that material into a logical order. At 1:01 he names the three parts:
- Stage: a directional bias for the weekly candle.
- Setup: expansion of that week’s range.
- Pattern: opposing PD arrays, using the set of arrays he calls the PD array matrix (1:29).
He keeps that pattern deliberately narrow. At 2:18 he says a bullish weekly expectation is looking above the week’s opening price at one of three things – a buy-side liquidity pool, an old high, or a fair value gap. At 2:33 the bearish version mirrors it with a fair value gap, an old low or a sell-side liquidity pool, and at 2:58 he confirms he is limiting the model to those arrays rather than the full mentorship vocabulary. “Liquidity pool”, “PD array” and “fair value gap” are his teaching labels; they are not independently validated market classifications.
He then walks the weekly USD/CAD chart to show how he frames a draw. At 4:20 he points to equal highs with an old down-close candle above them, a fair value gap left behind by an earlier advance, and a liquidity pool resting beyond the old high, and says at 4:30 that the example is one he says he traded. That is his own account of the example, not a verified fill.
The Tuesday reference open and the fixed 400 hour
The model’s single reference price comes next. Beginning at 6:54, ICT says he could use Sunday’s open, or Monday’s midnight New York open, but for this model he uses Tuesday’s opening price, at 7:48 at 400 – and that he keeps that hour fixed all year rather than adjusting it when daylight-saving time changes.
At 22:51 he explains the convention he is using. He says the model runs on Eastern Standard Time, that 400 is the midnight candle in New York while standard time is in force, that the same fixed hour becomes the 500 candle once daylight-saving time shifts, and that he deliberately stays on 400 regardless (23:04). At 22:34 he frames that refusal as an edge, arguing it disrupts traders whose systems are built on adjusted clock times.
One limit is worth stating plainly. The transcript gives his rule and his reasoning, but not the chart platform’s own clock setting, so 400 cannot be converted into a universal local time from this recording alone. The practical reading is that the reference is a fixed hour on his chart, held constant across the year – not a New York clock time that shifts with the calendar.
The base plan: entry, stop and the Thursday objective
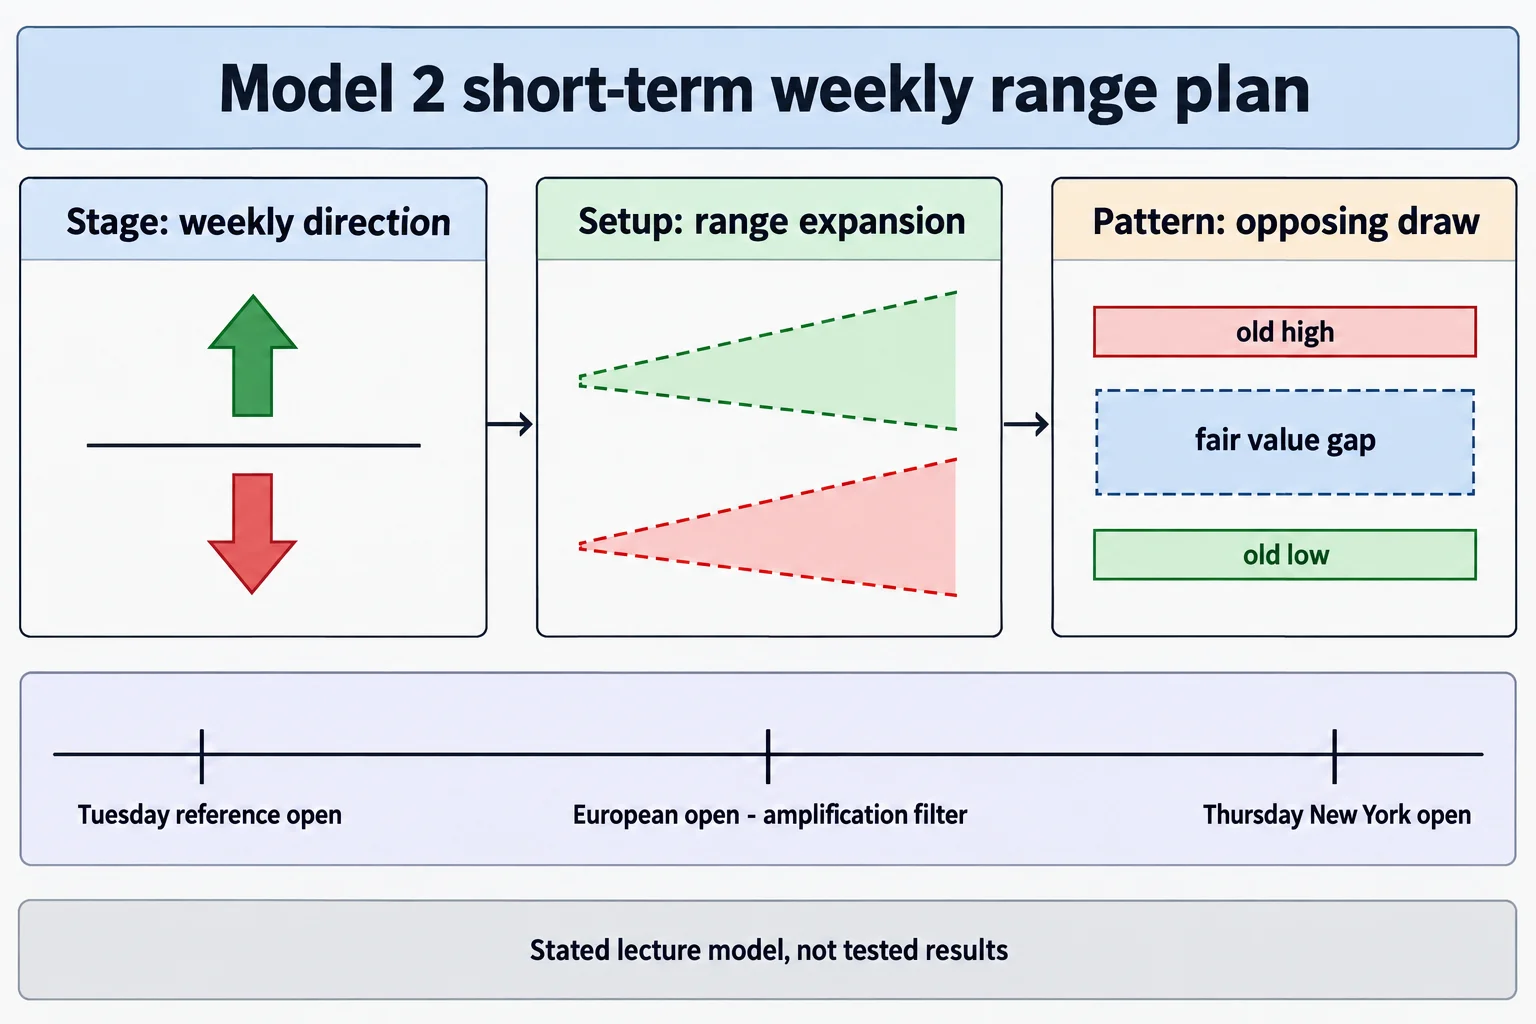
On a bullish weekly thesis, ICT’s stated entry is at or below the Tuesday reference open, on Tuesday or Wednesday (8:16, 10:20). On a bearish thesis it inverts and he sells above that price (12:56). Monday is excluded from the model at 10:49, though he still uses Monday’s trade to inform whether the idea looks likely (12:33).
His stated protective stop is 50 pips (8:29). At 9:11 he refines the entry itself: rather than buying at the reference price, look for a short-term swing low beneath it, place a limit order there or a few pips above it, and keep the 50-pip stop below that. These are the lecture’s own parameters. They are not risk guidance, and he does not present them as tested.
The time objective is Thursday’s New York open. At 9:49 he says the holding period runs until that hour or until the stop is hit, and at 10:00 he explains why he wants a time element at all – because he cannot know how far the week will expand, so the plan takes the middle portion of the weekly range between Tuesday and Thursday rather than trying to name the weekly high or low. At 13:13 he restates that as getting the bulk or lion’s share of the range. He adds the size of the objective he is aiming at – about 50 to 100 pips – at 21:21. That figure is a stated target band, not a measured outcome.
His working charts are named at 14:21: the weekly for the candle itself, the daily for context, and the one-hour for timing, with a 15-minute chart offered as an alternative.
What changes when the weekly objective is already met
The amplified half of the lecture begins at 14:41. He introduces it as covering what the automated captions render as intra-week or intermediate reversals (14:51), and restates the three parts for this variant: the reversal condition becomes the setup, and the European open becomes the pattern (15:35).
The question he sets up is what to do once price has already traded into the objective the base model was aiming at, if that objective sits at a premium or discount array (16:04, 18:26). Arriving at the level is not his entry. At 20:20 he looks for signatures in the price action to build the short case, and at 19:31 he says he will not sell on any old price or on a whim.
The context he gives for the recorded week is a set of seasonal and news conditions, not a signal: at 17:19 he describes an expectation of dollar-index weakness with the euro and the British pound rallying, and at 25:51 adds a Brexit vote falling on that Tuesday. At 21:04 he also warns that if Tuesday itself is the turning point, the base model has no entry that day and only Wednesday and Thursday remain.
The 600 European open as the reversal filter
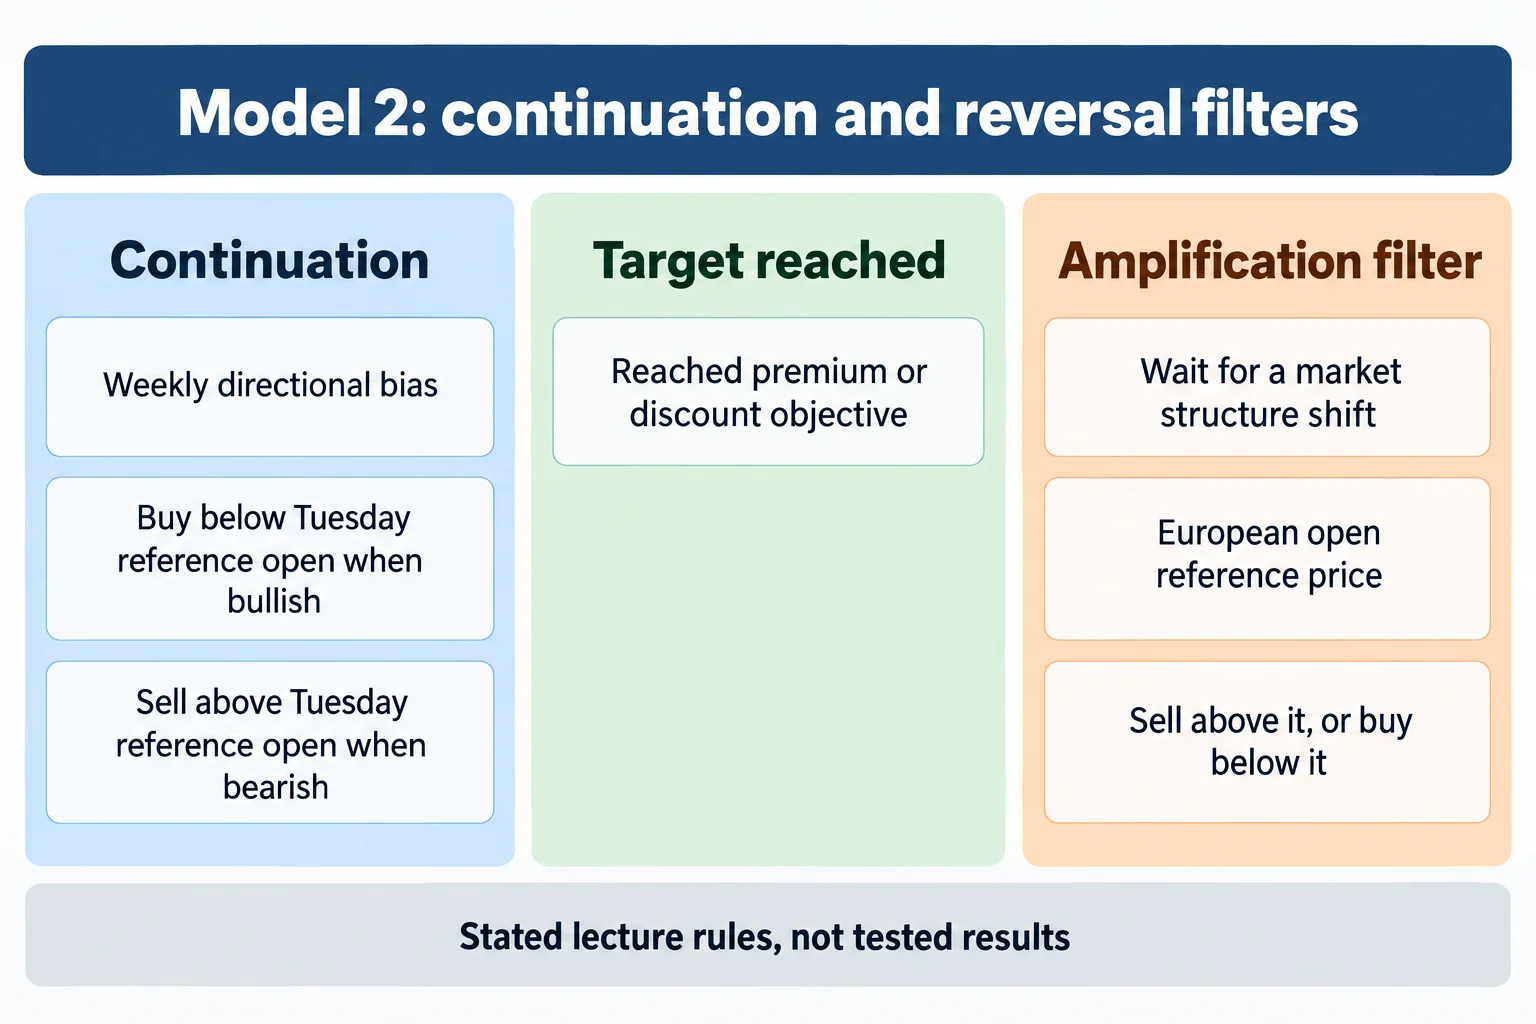
At 24:09 ICT abandons the base model’s Tuesday reference and its 50-pip stop for this profile, and at 24:23 names the replacement: the 600 European open, selling short above that price. The mirror case appears at 26:25, where a bearish objective already met becomes a reason to buy below the European open once a market-structure shift appears.
He then sets out two ways to take the short. The first is to sell at or above the European open once the higher-time-frame objective and the structure shift are both in place. The second, from 41:16, is what he calls selling on weakness using the Asian range: wait for price to rally above that range and place a sell stop below its low, which fills on the break lower. At 41:32 he presents it as the version for a trader who does not trust his own read of how far the intraday swing will run, and at 43:07 puts the protective stop at the day’s high at the time of the entry, adding at 43:29 that he would reduce position size if the market keeps extending so the same risk is not carried on a wider stop.
Structure and targets in the USD/CAD walkthrough
The worked example starts at 27:35 on USD/CAD. He first marks a higher-time-frame level he describes as already rebalanced, then points to a short-term low beneath the prior rally into it (37:49). He calls the break of that low at 37:41 the market-structure break, and at 38:12 says a wick through the level is enough – he requires no close beyond it.
From there he maps downside objectives with balanced price ranges, old lows, resting liquidity, gaps and order blocks (32:54). Two calibration habits show up here. He rounds chart levels to the nearest price ending in five or zero, walking through a low of 13,468 becoming 13,465 at 28:32, and states the rule at 30:56 – round down to the level when the reference is above it, round up when it is below. He then selects an hourly down-close order block at 36:06, noting that the level is also a round figure. Those readings depend on charts the captions cannot reproduce, so they are reported here as his annotations rather than as checked observations.
He closes the technical walkthrough at 47:44 by restating the division of labour: he keeps using the fixed reference open in the ordinary continuation profile, and switches to the European open when he believes a reversal profile is active. From 49:44 he asks the student to study the European open every day, arguing it removes the ambiguity of the New York midnight open, and at 50:21 says he leans on it most in the first two weeks after the standard-time to daylight-saving transition. He also remarks at 55:20 that he leaves mid-range levels on his chart so he can read them without a full set of projections.
How to study the recording
ICT gives the study instruction directly. At 14:06 he asks the viewer to go through charts and find weekly-range scenarios, and at 61:38 explains that he annotates his charts because the viewer has to learn the timing, not because he needs the markings himself. Anyone testing the definitions should work from the recording and the chart settings he describes rather than from a summary, including this one.
What the lesson does not establish
Several things a reader might expect are absent. There is no win rate, sample size, backtest, drawdown or account record anywhere in the recording, and no statement that any quoted example was a live fill. The execution framing is explicitly a demo account – he calls the 50-pip stop a stop on a demo account at 10:41 and at 32:13 says that is one reason he teaches on one. He also distances the teaching from direction calls, saying at 32:00 that he shows where price may be drawn to, not when. The 50-to-100-pip band is a stated target rather than a measurement, and the fixed 400 hour and the European-open filter carry no validation study in this lesson.
The recording also sits in two different times, and the distinction matters. The lesson is delivered as a live market week he dates to February 2019 at 17:23, yet he signs off at 61:57 promising another insight in 2020 and a Model 3 amplification the following month. The YouTube upload itself is dated 2 January 2024. Those are three separate facts – the market week discussed, the period of the recording, and the upload date – and none of them makes the others wrong. Nothing in the recording should be read as a claim about the market at the time it was posted.
Practical takeaways
- Treat the weekly candle as the unit of analysis: set a directional bias, expect range expansion, and pick the draw from a short list of opposing arrays (1:01, 2:18).
- Use Tuesday’s fixed 400 opening price as the reference in the base model, and hold the reference constant rather than shifting it with the clock (7:48, 23:04).
- Take the entry on Tuesday or Wednesday, skip Monday, and set Thursday’s New York open as the minimum time objective (9:49, 10:49).
- If the objective has already been reached at a premium or discount array, stop applying the continuation logic and require a structure shift first (16:04, 19:31).
- Switch the filter to the 600 European open for that reversal profile, and review the day’s high or the Asian range as the invalidation reference rather than a fixed pip count (24:23, 43:07).
The model leans on discretionary judgement – which structure matters, which array is the draw, when a shift has happened. Two readers watching the same chart can disagree on every one of those calls. Chart study can clarify ICT’s definitions; it cannot establish prospective profitability, and it does not remove trading risk.
Watch the original recording
The recording runs about 62 minutes and is the only primary source used for this article. The channel is The Inner Circle Trader on YouTube.
Resources
These are the sources checked for this article. The CFTC and Investor.gov pages are general regulator and investor-education material – on leveraged foreign-exchange fraud, on trading systems sold online, and on what leverage is. They are not assessments of ICT, of Model 2 or of anything said in the recording. He notes at 55:01 that copies of his material circulate in chat rooms outside his own distribution; anything of that kind is unofficial and nothing in it was tested here.
- [1] ICT Charter Price Action Model 2 \ Amplified Lecture – The Inner Circle Trader (primary source; watch page read 15 September 2026, 62M12S)
- [2] CFTC Learn & Protect – Forex Frauds (read 15 September 2026)
- [3] CFTC – Fraud Advisory: Commodity Trading Systems Sold on the Internet (read 15 September 2026)
- [4] Investor.gov – Glossary: Leverage (read 15 September 2026)
This is independent educational commentary on one paid charter lesson. It is not official ICT material, it is not a tested trading system, and it is not investment advice. The speaker frames the execution discussion in the recording as demo-account work. Leveraged foreign-exchange and futures trading involves substantial risk and is not suitable for everyone. No performance figure quoted here is verified.