
Key takeaways
In ICT Charter Price Action Model 13 – Charter Lecture on 2022 YouTube Model, ICT restates the framework he calls Model 13 for index futures: trade intraday market structure toward what he terms an opposing PD array objective.
Read the full summary
In ICT Charter Price Action Model 13 – Charter Lecture on 2022 YouTube Model, ICT restates the framework he calls Model 13 for index futures: trade intraday market structure toward what he terms an opposing PD array objective. Bearish ideas take buy-side liquidity above relative equal or single highs, break a recent short-term low with what he calls displacement, and seek a discount objective; bullish ideas take sell-side liquidity below a low, break a short-term high, and seek a premium objective. He then gives entry rules built on a three-candle fair value gap, a stop at the opposite candle boundary, a 2%-or-less initial risk halving after full losses, a separate afternoon version of the same setup using morning or lunch-hour highs and lows, targets at opposing premium or discount arrays and prior session or prior day extremes, and a list of session times for reassessing whether the sequence has formed. He states plainly that the listed times are not invitations to trade every slot, that the material assumes the earlier 2022 mentorship, and he closes by describing the purpose as one good setup per session in line with the trader’s own bias and narrative. The lecture contains no account records, no controlled test and no demonstrated result, and this article reports his spoken framework rather than a verified edge.
How we researched this article
BestProps used document-based research from primary firm sources, checked September 24, 2026. The complete source list, scope, limitations, and commercial-state record appear near the end of this article.
The recording is an “amplified” community version of the model ICT published publicly in the 2022 mentorship. He opens by saying it specialises in index futures and that it assumes the viewer has already worked through the lessons and lectures channel, because without that foundation the model will not feel clear (0:00, 0:23, 0:37). The upload sits on The Inner Circle Trader channel and runs just under 23 minutes; the inventory records it as uploaded on 16 February 2024, and at the close he refers back to the 41 free videos of the 2022 mentorship as the prerequisite material (22:36).
How this article was sourced
The source behind this article is a timestamped transcript produced by local automatic speech recognition of the full original audio rather than human-verified YouTube captions. Timestamps are automated and the recogniser mis-hears some market terms and figures, so where a passage is unclear this article says so instead of resolving it. No chart, order ticket or account statement was reviewed, and the reviewer did not see the screen at any point; the levels and procedures below are therefore the speaker’s spoken references, not values confirmed against the charts he was showing. Where he reports a result or an interpretation, it is attributed to him.
What the model is, in his terms
He names the framework Model 13 and describes the logic as trading intraday market structure that targets opposing PD array objectives: if the idea is bearish the objective is a discount array, and if the idea is bullish the objective is a premium array (0:52, 1:10, 1:20). “PD array” is his own label for price areas he treats as points of interest; premium and discount are his shorthand for the upper and lower halves of the dealing range he is measuring.
He also frames the model as a foundation to build on rather than a fixed system, saying viewers can run with it or construct their own model from these ideas (1:00). That framing matters for how the rest of the lecture should be read: everything below is his stated procedure, not a tested specification.
Session windows and chart time frames
The model’s time element is stated as two windows: 7 a.m. to 10 a.m. for the foreign-exchange kill zone, and 8:30 a.m. to 11 a.m. Eastern Time for index futures. Within either window he says he monitors charts from five minutes down to one minute after a liquidity event occurs and a short-term shift in market structure unfolds (1:30, 1:48). He notes he has deliberately given a wide range of parameters that could be used, and the narrower session times come later in the lecture.
The transcript repeatedly renders his term liquidity raid as something close to “liquidity rate” (2:50). Context — a prior high or low being taken and purged before price turns — supports reading it as raid, and this article uses that term on that basis; the automatic transcript does not spell it that way in every instance.
The setup, in both directions
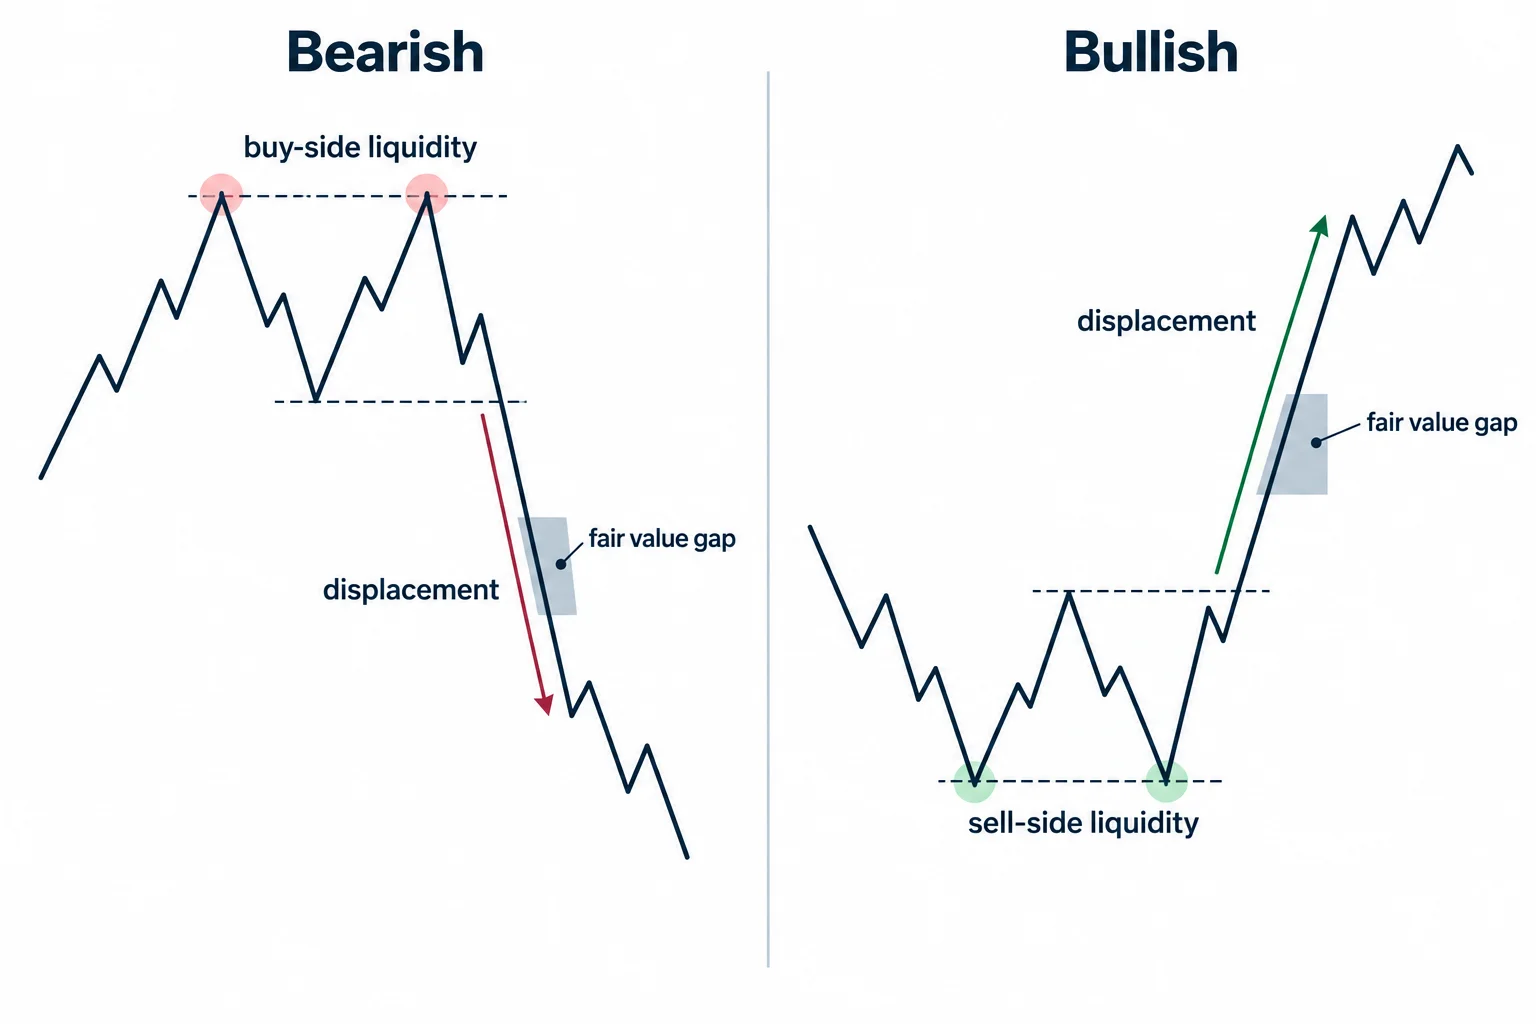
He describes the two directions as mirror images (3:00):
- Bearish: look for buy-side liquidity to be taken and purged — relative equal highs, or a single high taken and run out, with price jumping quickly up into it. Then wait for a rapid break of a recent five-minute down to one-minute low. He calls that break displacement, and he says the setup is ideal when the drop leaves a fair value gap behind (3:03, 3:19, 3:32).
- Bullish: look for sell-side liquidity to be purged, then a rapid market-structure shift above a recent five-minute down to one-minute high, ideally with displacement higher and a fair value gap (3:38, 3:51).
He adds a positional condition: inside that displacement leg the fair value gap should sit at or above the equilibrium of the dealing range for a bearish setup, and at or below equilibrium for a bullish one (4:21). He also says the concept is fractal and could be studied on larger charts, while the execution framework he is teaching here stays on the intraday charts.
Entry, stop and which gap to use
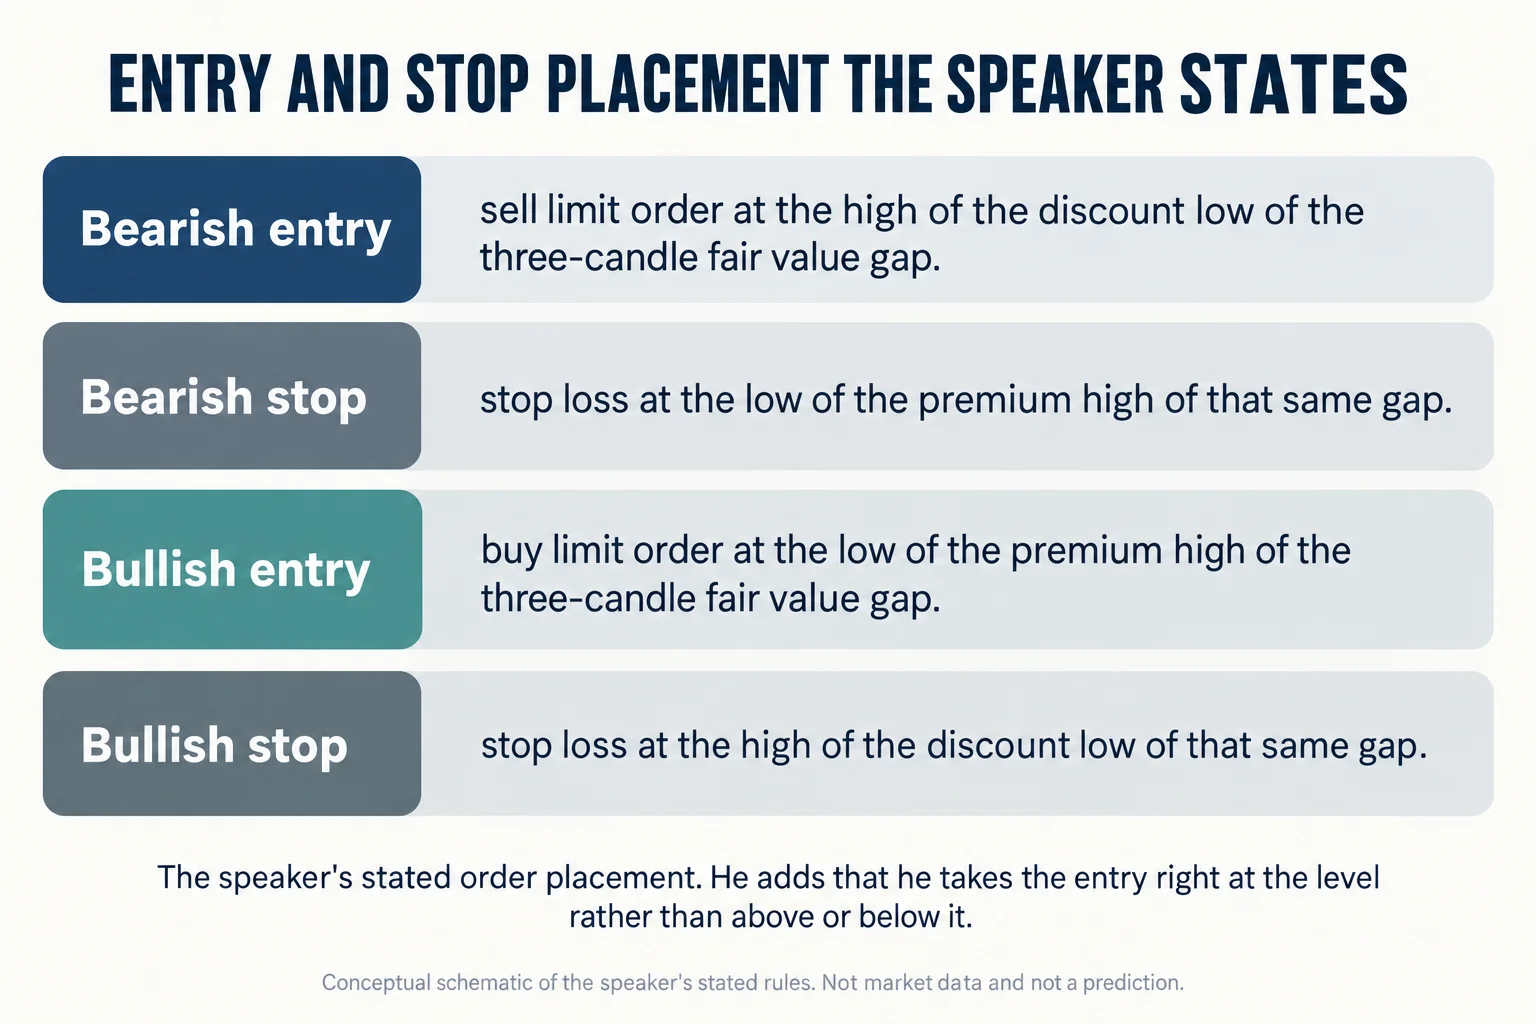
The entry rules start at 4:33. For a bearish setup he places a sell limit order at the high of what he calls the discount low of the fair value gap — the lower candle of the three that create the gap frames that boundary, and the order goes at its high (4:48, 4:53, 4:59). For a bullish setup he places a buy limit at the low of the premium high of the gap (6:53).
He is specific about taking the level rather than improving on it, saying he places the order right at that high because if structure, idea and narrative are all in play he wants the fill, and that being a quarter or half a point away has left him unfilled on moves that ran away. He accepts that this choice means slightly more risk and says he does not consider it decisive on such a small time frame (5:01, 5:18, 5:37).
The stop sits at the opposite boundary of the same gap: for a bearish trade, the low of the premium high of that gap, which he identifies as the low of the first and uppermost of the three candles; for a bullish trade, the high of the discount low (5:57, 6:26, 6:32). He states it as the smallest risk placement available to him: not a tick beyond, not a handle beyond, right at the boundary.
Which gap to use is settled by the first one that appears while scanning down through the time frames: it may form on the five-minute chart, or on the four, three, two or one-minute chart, and he works with whichever one creates the gap first going from five down to one (7:03, 7:15). The naming here — discount low, premium high — is his convention and is difficult to apply safely without the charts he was showing; the transcript alone cannot establish the exact visual boundaries, whether an order would have filled, or how slippage and fast markets would affect the fill.
Risk per setup and the drawdown ladder
At 7:27 he gives the risk figure as 2% or less of total trading-account equity per setup, preferably less. He illustrates it with a demo account holding $25,000 and says he would rather trade 1% or a half percent because these setups form frequently and that frequency can tempt a trader into using far more leverage than intended. He argues that smaller risk per trade keeps an account viable even at a hit rate he puts below 70% or 60%, and even at 50% (7:50, 8:10).
The drawdown rule is the same reduced-risk approach he says he gave in every previous model: after losing a full 2% on a trade, the next trade uses half the leverage; if that one also loses, halve again, continuing down until it can go no lower, and hold there until half of the previous loss has been recovered in equity. His illustrative ladder is 2%, then 1%, then half a percent, then a quarter percent repeatedly (8:37, 9:22). He says the intent is a plateau in the equity curve rather than a blowout (9:33).
These are his stated rules for a demo or trading account, presented as risk management rather than as evidence of performance. The lecture supplies no account records, no controlled test and no outcome data, so nothing here establishes a real-money result, and no percentage should be treated as suitable for any particular trader.
Afternoon setup and lunch-hour references
The PM version begins at 9:39 and mirrors the morning framework with different liquidity references. Bearish: a buy-side raid on the morning session highs or the lunch-hour highs, followed by displacement lower and ideally a fair value gap. Bullish: a sell-side raid on the morning session lows or the lunch-hour lows, followed by displacement higher (10:42). In the recording he notes a typo in his own notes on the short side of this passage and decides to leave it standing rather than correct it, so the wording on screen there should be read as he intends it rather than literally (10:01, 10:27).
He defines the lunch hour as 12 p.m. to 1 p.m. New York local time, and says a swing high or swing low inside that hour becomes the reference. He then sets a precedence: if the morning session produced relative equal lows or relative equal highs before noon, those interest him more than a lunch-hour high or low alone. If the morning had no relative equal highs or lows and only a single high, he will use the higher low inside the lunch hour instead — a case he calls rare but possible (10:54, 11:26, 11:37). The same entry and stop rules then apply, again on whichever of the five-minute down to one-minute charts produces the gap first (12:01, 12:36).
Profit taking and targets
At 12:57 he turns to exits, and the objective is again an opposing PD array: for a short, ride an intraday swing lower to get below equilibrium into discount; for a long, ride higher above equilibrium into premium (13:00, 13:05).
His short-side target list is any discount PD array at or closest under the equilibrium of the dealing range, under the previous session low, under the previous day’s low, or inside a fair value gap below those references — and he notes there may be several gaps below, which he says gives multiple targets to work with. The long-side list is the mirror: a premium array at or closest above equilibrium, above previous session highs, above the previous day’s highs, or inside gaps above those levels (13:10, 13:20, 13:36, 15:36). He also clarifies which session counts as “previous”: in the PM he looks at the AM session, and in the AM he looks at yesterday’s PM session (15:45).
Partials are described as a personal skill rather than a rule. He says there is no hard and fast formula that fits everyone, tells the viewer to find the lowest-hanging fruit that suits them, and admits openly that exit selection is the weakest part of his own trading and that he remains unsatisfied with it after thirty years (14:20, 14:44, 15:02). No price, fill or outcome for any trade is reported in the recording, so nothing in this section can be checked against an execution.
Time-of-day checkpoints
From 16:57 he lists the morning times he watches for the sequence to form, in Eastern Time: 8:30 a.m. when the news embargo lifts and high or medium impact news is released; 9:30 a.m. when US equities markets open; 10:00 a.m. after the first thirty minutes, when he says sentiment is established — the point at which he suggests looking for what he calls the Judas swing; 10:30 a.m. after the first sixty minutes, when he says the opening range is established and the first hour’s trading becomes influential for the rest of the day; and 11:00 a.m. as the last opportunity on days that offer conditional conditions (17:04, 17:16, 17:22, 17:59, 18:18). He treats 11:00 as conditional: he says he is not excited about 11 o’clock setups unless the day is Thursday or Friday with what he calls TGIF conditions, or unless a longer-horizon reversal is in play, in which case he would use the 11 o’clock window to align with what his group calls London close (18:33, 18:59).
His afternoon list at 19:24 is: 1:30 p.m. when New York lunch volume completes and intraday volatility returns; 2:00 p.m. when PM trends start to unfold and potential AM or lunch-hour stops are purged; 2:30 p.m. when the final two hours of the New York day session begin; 3:00 p.m. at the start of the final hour; and 3:30 p.m. when market-on-close conditions begin (19:28, 19:38, 19:51, 20:12). He says the last two windows demand a very proficient scalper working 30-second and one-minute charts, that such a trader can find this setup in the last hour almost every day, and that it needs precision and nimbleness most viewers probably do not have yet; he also says he does a lot of ultra short-term trading in that final hour himself (20:16, 20:30, 20:43).
He closes the timing section with the caveat that matters most for reading the list: these are not invitations to trade every time one of the windows begins, and not five setups in the morning and five in the afternoon. The intention, he says, is to find one good setup per session, in alignment with your bias and with the narrative of the day inside the weekly range profile you have been studying — a one-sided read where it is hard to make the analysis point the other way (21:40, 21:54, 22:05).
What the lecture does and does not establish
Read as a study framework, Model 13 reduces to a checklist: form a directional premise, wait for the relevant high or low to be taken, require a short-term structural shift with displacement, identify the associated three-candle fair value gap, place the entry and stop at the gap’s stated boundaries, size the position at 2% or less with the halving ladder after losses, and map an opposing premium or discount objective with prior session and prior day extremes as candidate targets. The session times narrow when he watches for the sequence rather than dictating when to act.
What the recording does not supply is any check on the framework’s reliability. There is no track record, no order history, no statement and no independent record of the setups he refers to, and the hit-rate figures he mentions are hypothetical illustrations of why he prefers smaller risk rather than observed results. The instrument context is index futures, which trade in a far wider electronic session than the New York equity hours these time windows are anchored to; TradingView’s help material defines the reduced regular-trading-hours window commonly used for intraday futures analysis[1], and the 9:30 a.m. checkpoint he ties to the equity open matches the NYSE core session running 9:30 a.m. to 4:00 p.m. Eastern[2]. For the leverage and loss characteristics of the instruments involved, the CFTC’s customer material is a reasonable starting point and states plainly that there is no such thing as a risk-free trade or investment[3]; CME Group’s introductory futures course covers how the contracts trade[4]. Nothing on this page demonstrates a tested, repeatable or profitable result, and no setup described here should be copied without independent evaluation.
Watch the original recording
This embedded player was opened and clicked from a BestProps page on 14 September 2026 and began playing at the recording’s own duration, so the lecture can be watched in place. The timestamp links above point to the passages being described.
Primary source and further reading
- The original Inner Circle Trader recording, 16 February 2024 — the primary source for everything above; the transcript used here is automatic speech recognition of this audio, not human-verified captions.
- TradingView — Regular and electronic trading hours for CME futures — how the reduced regular-trading-hours session is defined against the full electronic session the model’s index-futures windows sit inside.[1]
- NYSE — Holidays and trading hours — the 9:30 a.m. to 4:00 p.m. Eastern core session behind the 9:30 a.m. checkpoint.[2]
- CFTC — Learn and Protect — the U.S. derivatives regulator’s customer risk and fraud material for futures and forex.[3]
- CME Group — Introduction to Futures — background on how futures contracts trade and how customers use them.[4]
BestProps is not affiliated with the Inner Circle Trader, TradingView, NYSE, CME Group or the CFTC, and nothing listed here endorses this article or any setup. Terms such as liquidity raid, displacement, market structure shift, fair value gap, PD array, premium, discount, equilibrium, dealing range, Judas swing and TGIF are used as descriptive study terms taken from the recording. The transcript is automatic, so individual words and figures may be mis-heard and unclear passages are flagged rather than resolved. The speaker’s claims, reported procedures and interpretations are attributed to him throughout, and this article is educational commentary only and not investment advice.