
Key takeaways
ICT Charter Price Action Model 1 is the first of a twelve-model Inner Circle Trader demo-account series and defines a discretionary five-minute intraday scalping framework for Cable and other reviewed markets during the New York session.
Read the full summary
ICT Charter Price Action Model 1 is the first of a twelve-model Inner Circle Trader demo-account series and defines a discretionary five-minute intraday scalping framework for Cable and other reviewed markets during the New York session. It maps a rolling 20-day IPDA range excluding Sundays into premium, equilibrium and discount, treats selected prior daily highs and lows as liquidity, and targets 10, 20 or 30 pips beyond a previous day’s range, where previous day can mean any selected day inside the lookback. Buy programs require a swing high taken within 20 days with price outside premium or at equilibrium, while sell programs require a swing low taken within 20 days with price outside discount or at equilibrium. Monday through Wednesday are preferred, Thursday is conditional on unswept liquidity, and late-week long leverage is reduced to roughly 25% to 40% of normal. From 7 a.m. to 11 a.m. New York time, traders seek a 62% retracement against London-session momentum, adding five pips for long spreads or subtracting five pips for shorts. Stops sit at or five pips beyond the high or low formed from 7 a.m. to 10 a.m., remain unchanged until 20 pips are scaled out, then lock in 5 to 10 pips, with no re-entry after a stop-out. Scaling occurs near the initial session extreme and at two Fibonacci targets, with an optional small remainder for a symmetrical swing when news follows noon. The protocol continues until daily liquidity is reached or swept, while rejection blocks, turtle soup, market structure shifts, breakers and order blocks guide the discretionary directional read. The February 2018 lesson was uploaded to YouTube by The Inner Circle Trader on 26 December 2023 and runs about 27 minutes 26 seconds, but provides no audited performance record, sample size, win rate, drawdown, slippage, cost modelling or evidence of an edge.
How we researched this article
BestProps used document-based research from primary firm sources, checked September 24, 2026. The complete source list, scope, limitations, and commercial-state record appear near the end of this article.
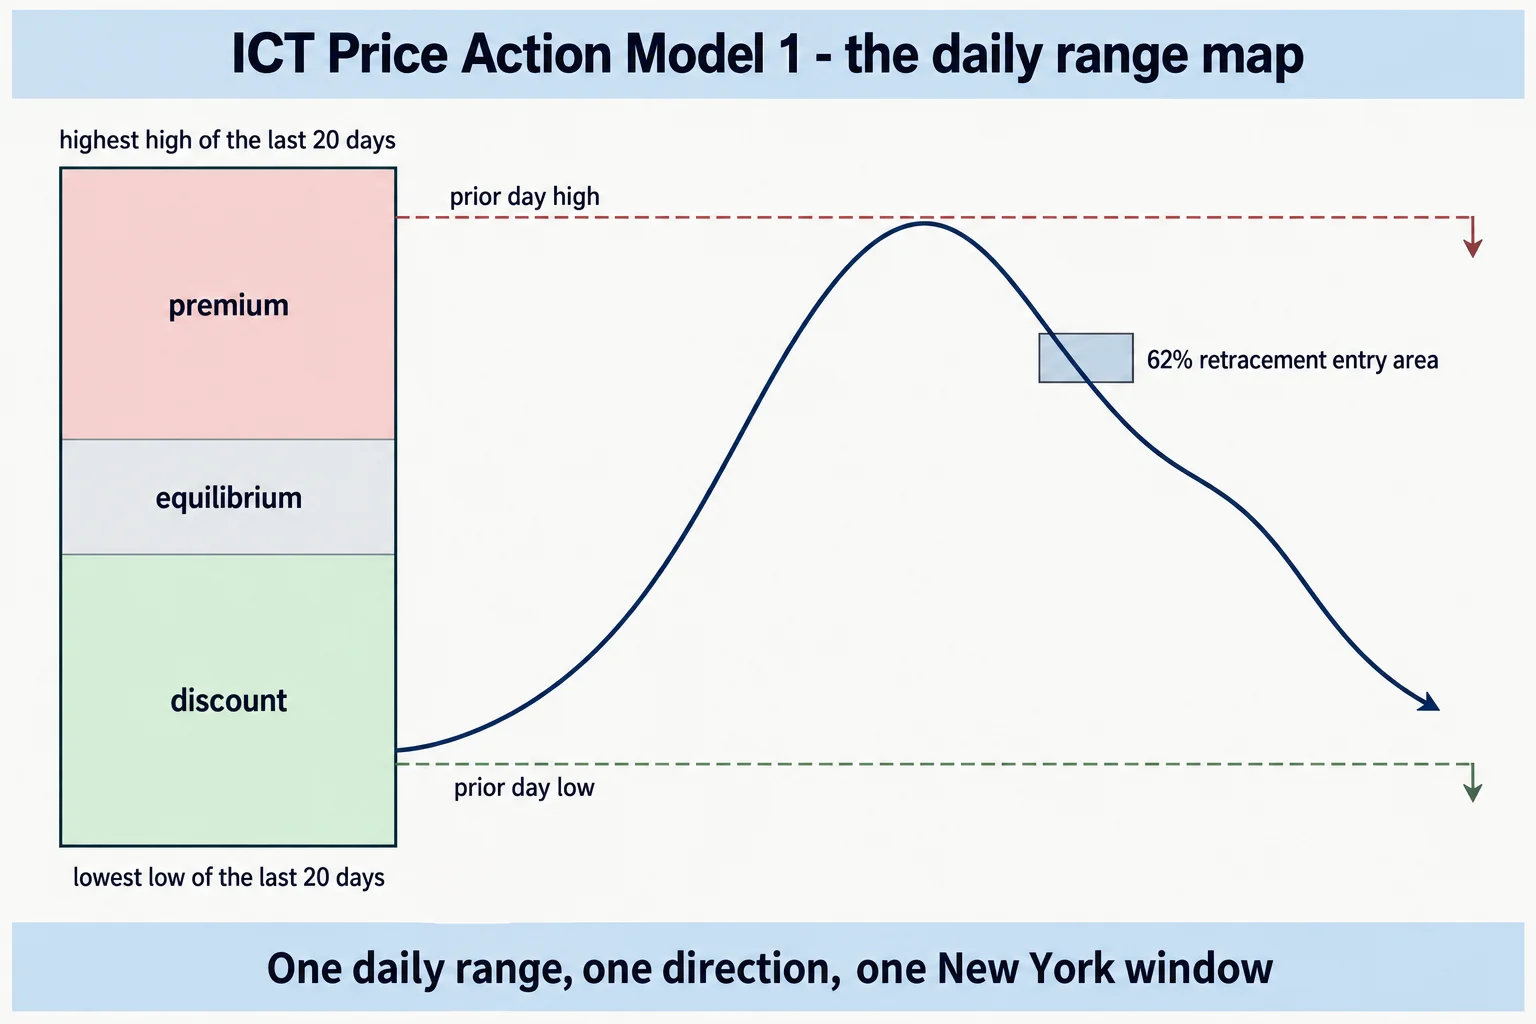
In ICT Charter Price Action Model 1, the Inner Circle Trader opens a twelve-part series of proposed price-action models intended for a demo account. This first model is built around intraday scalping of previous daily highs and lows, with entries sought during the New York session and defined by what he calls an optimal trade entry, or OTE. The recording is a February 2018 session that was published on YouTube in December 2023, so the material is older than its upload date.
What follows is a restatement of the speaker’s stated methodology against his own timestamped captions, not evidence that the model has a trading edge. Every price level, chart reading and trade result in the recording is his own account of charts this source cannot show, and no performance record is presented.
What ICT Price Action Model 1 Does
The pattern setup is stated at 2:58 as the optimal trade entry inside the New York kill zone, focused on raids of previous daily ranges. The overview at 3:16 sets out three parts:
- Buy intraday New York-session bullish OTEs while anticipating a rally to the previous day’s high.
- Sell intraday New York-session bearish OTEs while anticipating a decline to the previous day’s low.
- Project 10, 20 or 30 pips beyond the previous day’s range as the target (3:35).
He is explicit at 3:42 that “previous day” does not mean the calendar day before the trade. It means any previous day inside the current 20-day range, which he refers to as the IPDA data range. That range supplies the premium and discount framework; he notes the same logic is applied over 40 and 60 days, and that Sundays are disregarded in the lookback (5:48).
Who ICT Price Action Model 1 Suits
At 1:10 he describes a hypothetical trader who will not hold overnight, makes up his mind easily, prefers frequent setups over waiting for long-term ones, reviews a basket of markets the night before, and does not expect large trades. The model is framed as a rule-based foundation rather than a replacement for prior learning, and as the first of twelve it carries the fewest rules.
He names his earlier “Mastering High Probability Scalping” volumes one to three as prerequisite material, and several concepts used in this presentation – breaker, rejection block, turtle soup, market structure shift, premium and discount – are shown on his charts rather than defined here. Viewers are told he is drawing the mentorship material into a free tutorial, which is also why the explanation leans on concepts the recording never spells out.
Reading Daily Ranges for ICT Intraday Price Action
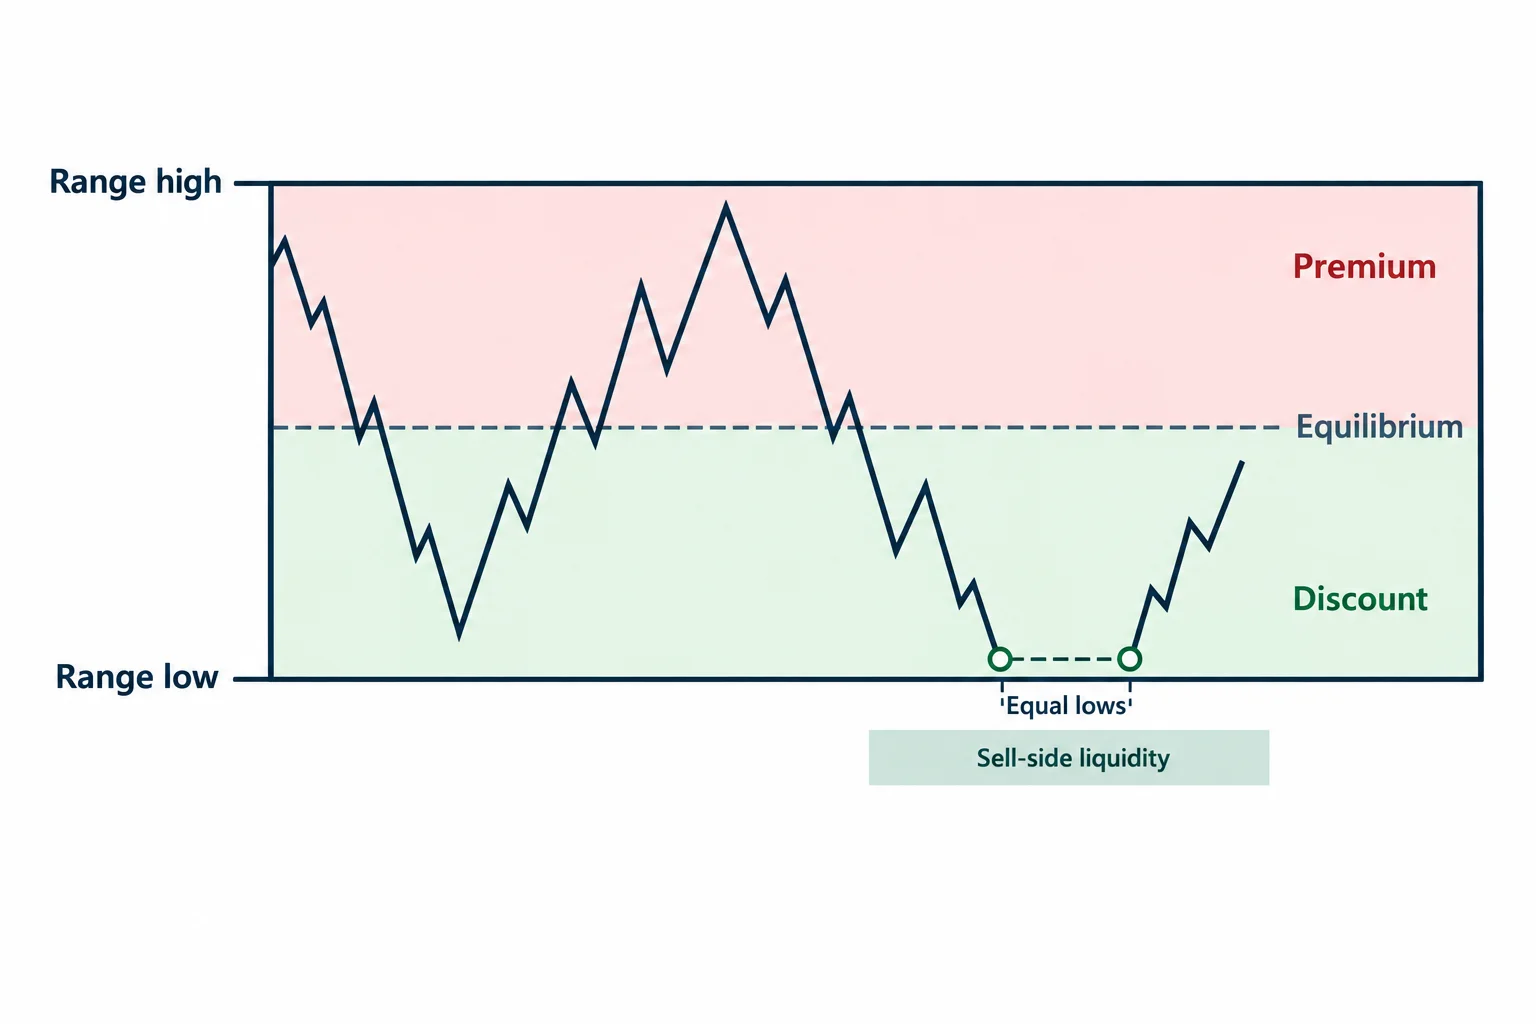
From 5:00 he walks through the 20-day range. The highest high and lowest low of the lookback bound the range; premium is the upper part, discount the lower, and equilibrium the midpoint. Selected daily lows within that range are extended across the chart as reference lines: a swing low, a low that followed one of the strongest up moves, another earlier low, and a pair of relatively equal lows. The liquidity he expects to be raided rests below those lows, and he says plainly that the liquidity void to the lower left is not the focus of a scalping lesson.
The example is Cable, and he dates the recording to 11:09, the Friday before the week he is analysing. This is not a selection problem that can be solved mechanically: the levels are chosen because they fit his reading of the range and the direction he expects, and he acknowledges the freedom he is taking with assumed prior knowledge.
Behind the level work he layers a chart story from 7:00: a rejection block at the high, a reversal pattern he calls turtle soup, a market structure shift lower, a breaker, and a bearish order block, all stacking in the premium part of the range. His stated conclusion was a run down toward the liquidity resting below the equal lows. This cannot be verified from the captions; it is his reading of charts that were shown on screen.
ICT Intraday Buy Model
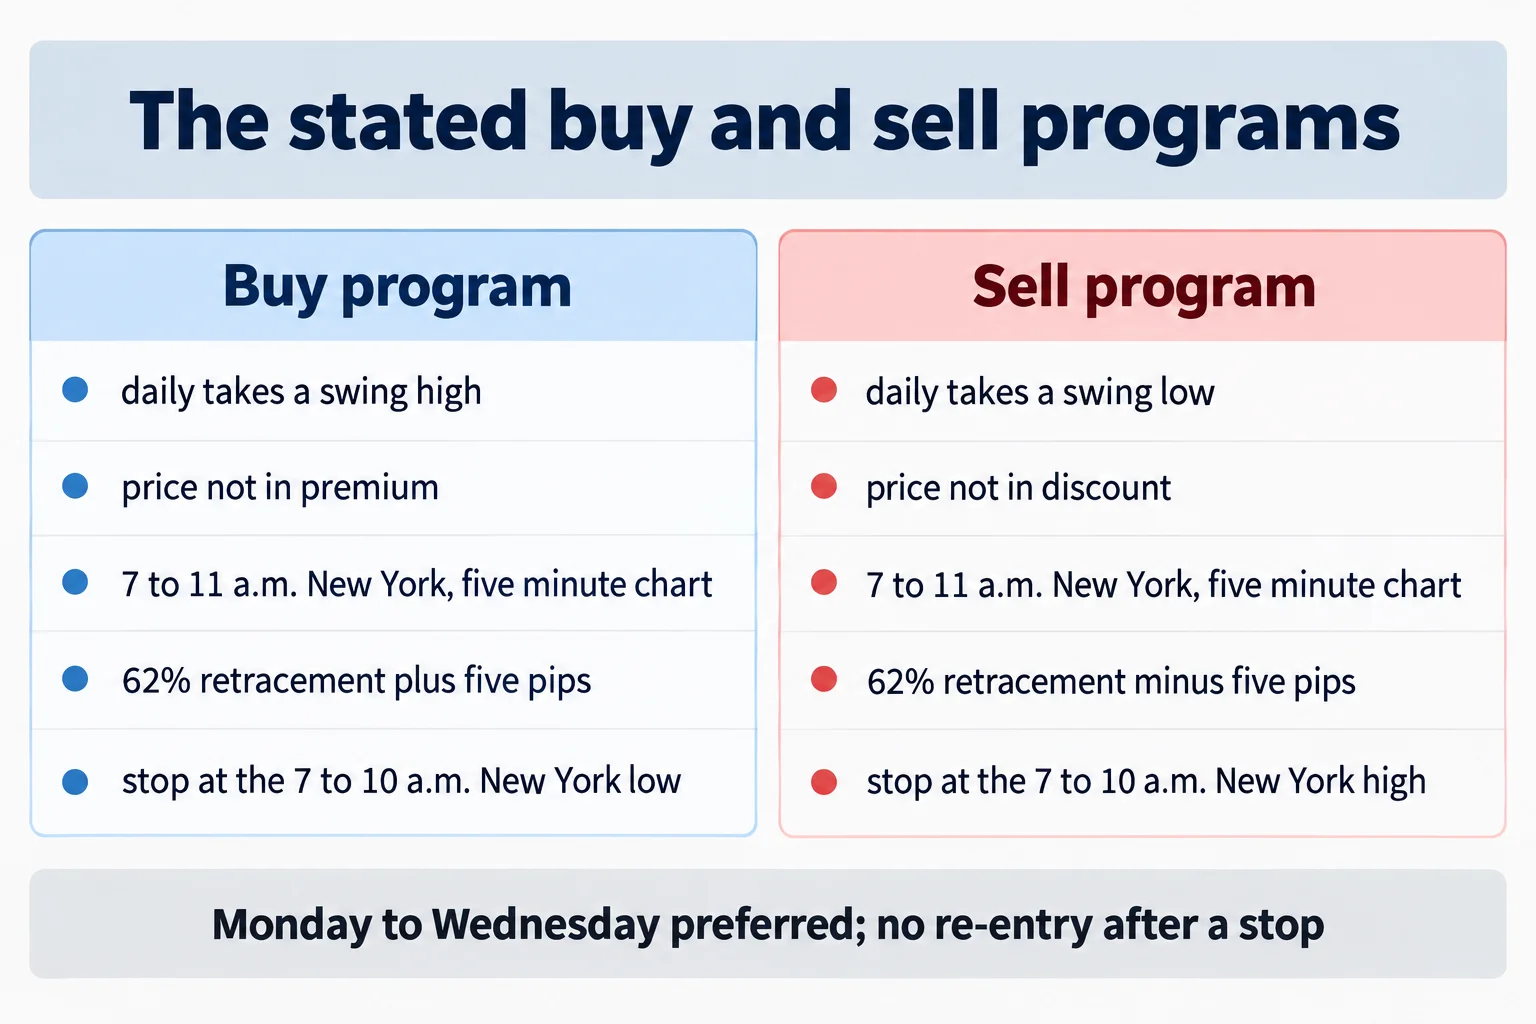
At 12:18 he defines a buy program: buying is considered only when the daily has taken out a swing high within the last 20 days and price is not in premium. Buying can also be considered at equilibrium of the daily range, and he describes parabolic expansion runs above equilibrium as the way price reaches the previous day’s high and the liquidity resting above it.
The entry process from 13:34 has these stated elements:
- Monday through Wednesday are the ideal buy days in the New York session. Thursday can still be considered while the liquidity remains for a low-resistance run, but he says leverage would be dialled back to roughly 25% to 40% of normal that late in the week (14:05).
- Between 7:00 a.m. and 11:00 a.m. New York time on a five-minute chart, look for a retracement lower against the London-session momentum of the day (14:24).
- Key off the 62% retracement level specifically – he says he is not using 70.5% or 79% – and add five pips for the spread on a long (14:53).
- Place the protective sell stop at the low formed between 7:00 a.m. and 10:00 a.m. New York time, or five pips below it (15:32).
- Do not move that stop until 20 pips have been scaled out of the position, then move it to lock in 5 to 10 pips (15:50).
- If price reaches the stop, no re-entry is taken on that trade (16:12).
- Scale out first just before price returns to the initial high of the day, then at target one and target two on his Fibonacci tool. If news is due after noon New York time he leaves a small portion on for a symmetrical price swing, and closes everything if that level is reached (16:26).
ICT Intraday Sell Model
The sell program at 17:43 mirrors it. Shorting is considered only when the daily has taken out a swing low in the last 20 days and price is not in discount, with shorts also possible at equilibrium and parabolic expansion runs described as the path below equilibrium toward the previous day’s low and the liquidity beneath it.
From 19:44 the short entry rules are: Monday through Wednesday are ideal sell days, Thursday only while the liquidity pool has not been probed or taken out on the daily; between 7:00 a.m. and 11:00 a.m. New York time on a five-minute chart, look for a retracement higher against the London-session momentum; key off the 62% retracement level and subtract five pips for the spread (20:42); place the protective buy stop at the high between 7:00 a.m. and 10:00 a.m. New York time or five pips above it, do not move it until 20 pips are scaled out, then lock in 5 to 10 pips, and take no re-entry if stopped (21:00). Targets mirror the long side, scaling out around the initial session low and at the Fibonacci targets.
These are instructional rules rather than personalised risk settings. A fixed five-pip offset does not account for differences between instruments, volatility regimes, spreads or fill quality, and the transcript contains no cost, slippage or loss modelling.
ICT Price Action Continuation and Swing Projection
From 22:26 he says the same protocol is to be followed in the days after a buy or sell program begins, until the daily liquidity pool is reached or swept. He warns against fighting the daily order flow, argues that banks and larger institutions capitalise all PD arrays forming in the New York kill zone, and says not to force another trade after a stop-out – a stop-out is treated as a sign that momentum may be weakening, and the advice is to wait for another day or another New York session entirely.
The final section from 24:32 connects the intraday scalps to a larger projection. He anchors a Fibonacci measurement from the Friday low to the Monday high of the example, notes the symmetrical price swing that follows, and divides the projected decline into four graded sections – a first grade, equilibrium, a third grade, and a final grade he calls the terminus – with scalps available between the quadrants. His claim at 26:00 is that when a scalp lines up with the New York session it “amplifies and increases exponentially” the probability of a positive result. That is his market interpretation. Nothing in the recording tests it.
Where ICT Price Action Stays Interpretive
Read as a checklist, the model is: define the 20-day range, decide whether price sits in premium, equilibrium or discount, mark the older daily highs or lows you expect to be raided, establish one directional program, then wait for a 62% New York-session retracement aligned with London momentum, with stops, scaling and a no-re-entry rule completing the frame.
The precise mechanics are the easy part. The discretionary part is everything before them – which swing points qualify, which lows carry resting liquidity, whether price is “not in premium” at the moment of the decision, and how the rejection block, turtle soup, breaker and order block layers are read on charts the captions cannot show. The transcript also contains no account statement, broker confirmation, sample size, win rate, drawdown profile or cost treatment, and the Cable examples shown near the end of the recording are presented as chart walkthroughs rather than audited outcomes. The recording’s closing note points to a second model based on short-term trading and the London open.
Watch the ICT Price Action Model Recording
The video runs about 27 minutes 26 seconds. It is titled “ICT Charter Price Action Model 1” and was published on the channel The Inner Circle Trader on 26 December 2023, while the session itself refers to February 2018. The embed above was tested as a saved player on this site and starts normally; because the lesson is delivered over charts, watching it is the only way to see the ranges, levels and blocks described here.
ICT Price Action Model Resources
These are the outside sources consulted for this article. The Federal Reserve material is the official publication of the exchange-rate series for the pair used in the example, and the CFTC pages are regulator and investor-education material about how trading systems and hypothetical results are presented. None of it is an assessment of ICT, of Price Action Model 1, or of anything said in the recording. Copies, re-uploads and second-hand summaries of this lecture circulating elsewhere are unofficial and untested here.
- [1] ICT Charter Price Action Model 1 – The Inner Circle Trader (primary source; watch page read 15 September 2026, 27M26S)
- [2] FRED / Federal Reserve H. – U.S. Dollars to U.K. Pound Sterling Spot Exchange Rate, daily noon buying rates for cable transfers (the official series for the pair in the example; read 15 September 2026)
- [3] CFTC Learn & Protect – Forex Frauds (the CFTC states that about two out of three retail foreign exchange traders end each quarter in the red; read 15 September 2026)
- [4] CFTC Fraud Advisory – Commodity Trading Systems Sold on the Internet (on how hypothetical results are presented and why they may not reflect losses, spreads or execution; read 15 September 2026)
This is independent educational commentary on one charter lecture. It is not official ICT material, it is not a tested trading system, and it is not investment advice. The pip targets, retracement levels and trade walkthroughs are the speaker’s own statements rather than verified results, and no profitability claim in the recording has been independently checked. Leveraged and foreign exchange trading involves substantial risk and is not suitable for everyone.