
Key takeaways
The Inner Circle Trader reviews a 827-second YouTube recording of the July 21, 2026 regular-hours session on a one-minute September 2026 Nasdaq futures chart, where a tentative 450-handle premium to prior settlement created a first-hour short bias toward relative equal lows and the midpoint of the opening range gap, but repeated stop-outs, re-entries and weak…
Read the full summary
The Inner Circle Trader reviews a 827-second YouTube recording of the July 21, 2026 regular-hours session on a one-minute September 2026 Nasdaq futures chart, where a tentative 450-handle premium to prior settlement created a first-hour short bias toward relative equal lows and the midpoint of the opening range gap, but repeated stop-outs, re-entries and weak follow-through left the main half-gap objective unreached. The setup used a one-hour buy-side balance sell-side inefficiency from the previous Wednesday at noon Eastern as the entry reference, required a meaningful gap size, and excluded the fair value gap formed by the nine thirty a.m. candle when this opening-gap condition was present. After price overcame a bearish fair value gap, ICT reclassified it as a bullish inversion fair value gap, reported closing his final short near the low and mitigating some drawdown by a couple thousand dollars, then advised leaving the difficult area alone. His next-session plan was conditional, with an overnight decline potentially returning into the day’s opening range gap and an overnight rise supporting continuation, while the article stresses that automated speech recognition, unavailable chart verification and self-reported fills, size and results provide no evidence of a repeatable or profitable edge.
How we researched this article
BestProps used document-based research from primary firm sources, checked September 24, 2026. The complete source list, scope, limitations, and commercial-state record appear near the end of this article.
In Reviewing High Resistance Liquidity Run Conditions – July 21, 2026, ICT walks through a single regular-hours session on a one-minute chart of the September 2026 Nasdaq futures contract. The short version of the review is that the delivery was poor: the directional premise he set in advance was reasonable, price repeatedly failed to follow through, and the opening draw he was watching was never reached.
This page is a transcript-grounded account of that recording. It is not a transcript of it and not an endorsement of the method. Everything below is attributed to the speaker, because the levels, entries, exits and results come from his own narration: spoken audio cannot confirm chart coordinates, order fills, position size or account outcome, and nothing here establishes that the framework produced a repeatable or profitable result. The source is an automatic speech-recognition transcript of the full recording rather than human-checked captions, so terms and numbers are flagged wherever the wording matters.
ICT Liquidity Session on July 21 2026
The inventory entry for this article carries an upload date of July 22, 2026 in UTC, one calendar day after the date in the title. That is a timezone artefact rather than a contradiction. The recording itself sets the day: it refers to the overnight reference as running from “Monday’s regular trading hours settlement price at 4:14 p.m. eastern time to 9:30 a.m. eastern time on tuesday” (12:43) and closes by looking ahead to “tomorrow for wednesday” (13:40). A session whose next trading day is Wednesday, following a Monday-to-Tuesday overnight range, is Tuesday, July 21, 2026, which is the date in the title. The other context is ordinary: the contract is the September 2026 Nasdaq future, the chart interval is one minute, and the speaker moves between regular trading hours and electronic trading hours while describing it (0:52).
ICT Liquidity Bias From the Opening Range Gap
ICT opens with the distance between the prior settlement and the regular-session open. He describes a large premium to settlement, which the automated transcript renders as “450 handles or thereabouts” (0:33). That figure should be treated as tentative: it is speech recognition of a spoken number, not a chart reading. His focus is the midpoint of the opening range gap, which he calls the consequent encroachment, and the half gap is the level his simplified model aims at (1:15).
Because the market had opened significantly above the prior settlement, the first-hour assumption he describes is short. He is explicit that the point of the exercise is not accuracy but a decision made in advance: the aim is to give his son Caleb something that does not require a lot of deliberation during the session, and he accepts that it will not be right every time (1:37). Start the session looking for shorts, he says, and then wait (1:55).
Gap size is a filter in that model, not a formality. If the offset between the open and the midpoint of the gap is small, the setup is skipped; he wants a gap large enough to offer a meaningful distance to travel, and he illustrates the point with worked examples rather than fixed rules (3:49). The specific handle counts he mentions are his own illustration for Caleb and are not presented as thresholds that hold for anyone else.
ICT Liquidity Run Hourly Reference
The array he built the idea around is an imbalance left on the hourly chart at noon Eastern time the previous Wednesday, associated with an older swing low (2:24). The transcript renders that term inconsistently; the reading used here follows the later, clearer passage where he names it as the one-hour buy-side balance sell-side inefficiency from last Wednesday at noon Eastern time (11:21). In ICT terminology that is the array commonly abbreviated BISI. He is specific that this is not support-and-resistance analysis: he says he is not a support-and-resistance trader, not a supply-and-demand trader, and does not work from volume profile or footprint (2:49). His stated reason for preferring this particular reference is that it sits on the hourly chart and offers an obvious visual anchor instead of a broken low that has merely become resistance.
ICT Liquidity Run Execution Sequence
He reports the market running up into that array at about 9:30 a.m. Eastern and going short from there (3:04), with two objectives below: the relative equal lows (3:18), and, as the best case, the midpoint of the opening range gap.
The entry mechanics as he describes them are straightforward: price opened, rallied, overlapped the opening price and then traded back below it, with his fill in that overlap and a stop above it (5:10). He flags the first fair value gap he was tracking a few seconds later (5:25). What follows is messier than the premise: he reports being stopped on a contract, re-entering short, taking one off as price traded lower, and later being stopped again (7:03, 7:24).
He then says that if he were making the market he would come back up to run the relative equal highs and afterwards sink price below the relative equal lows he was targeting, while acknowledging that this would take out his own position (7:42). Roughly that happened. He calls it “probably lucky guess” rather than a prediction, explicitly framing the earlier remark as hypothetical talk that happened to line up (8:08).
He reports further short attempts and says he closed the last one out at the low (8:43), and that he mitigated some drawdown with what he calls a couple thousand dollars of effort shown (8:48). Those are his own recollections from the recording. No source available here establishes position size, realised results or the sequence of fills, and the dollar figure reaches us through speech recognition.
Why ICT Saw High Resistance Conditions
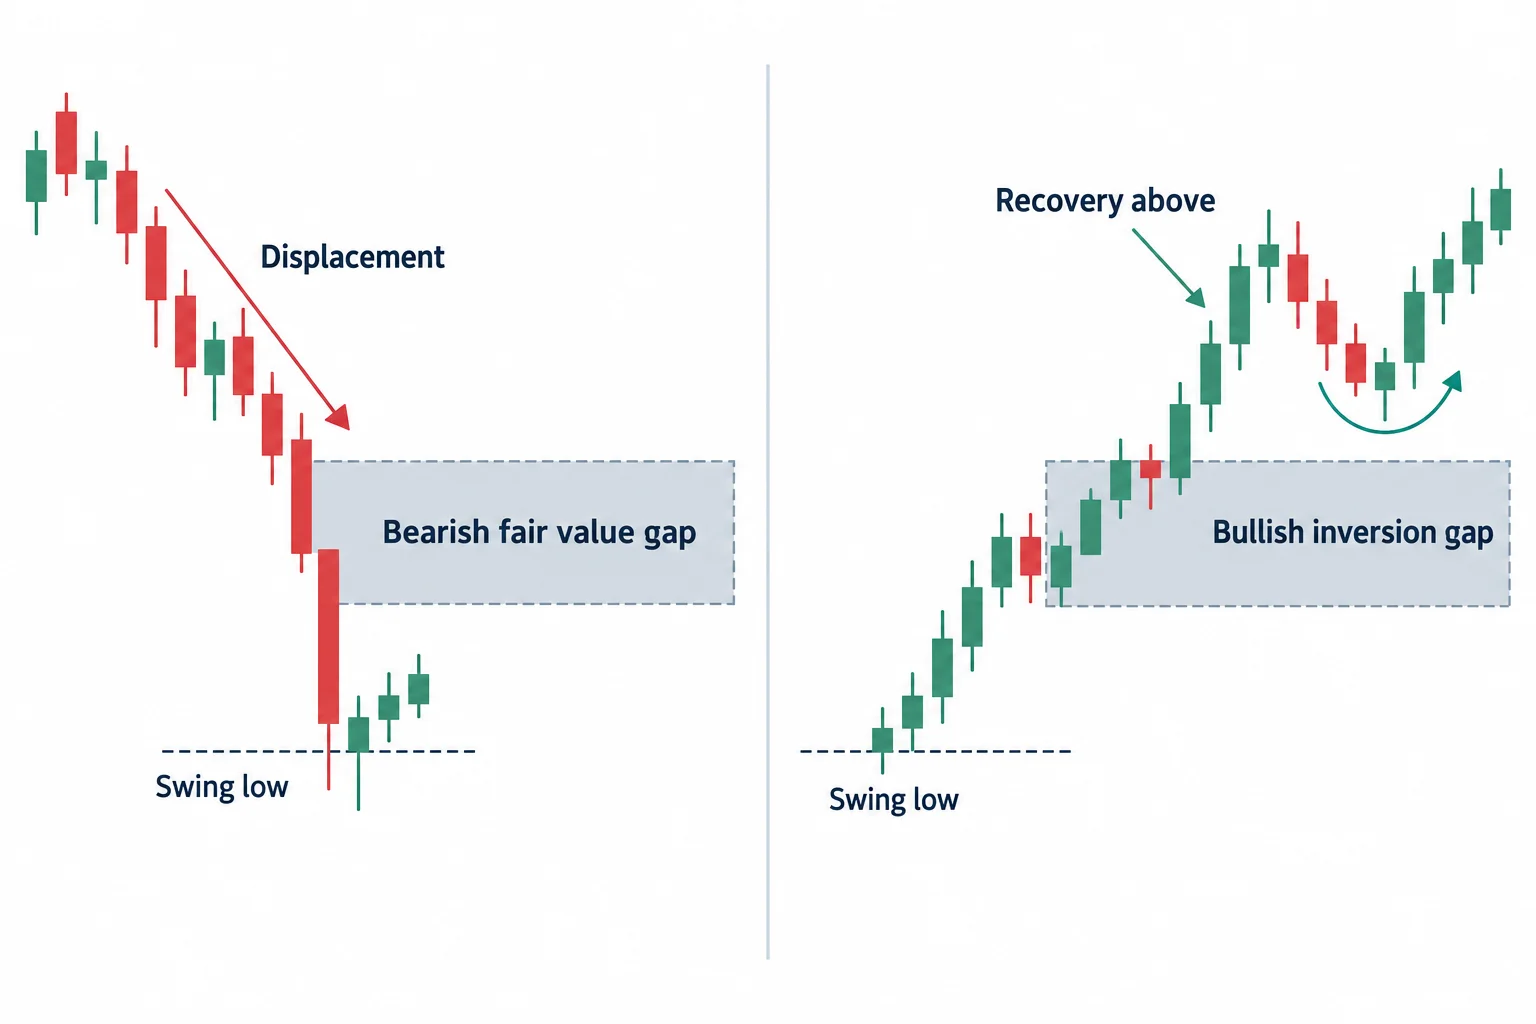
His own summary of the tape is that it was very difficult to trade (8:59), and that the draw he had identified never arrived: price did not work down into the half gap and instead went higher (10:20). That is the practical meaning of a high-resistance run, an objective that stays valid on paper while the route to it repeatedly refuses to deliver.
In the aftermath he reviews a bearish fair value gap created by displacement beneath a swing low (10:29). Under his framework that gap initially implies sell-side delivery; once price overcame it to the upside he reclassifies it as a bullish inversion fair value gap and traces the transition into higher references (11:09). He also notes a restriction inside the model he teaches: the fair value gap formed by the 9:30 candle is not to be used when an opening gap of this kind is present (10:35). That is a rule of that model, not a general property of markets.
Price later reached the midpoint of the earlier hourly array, moved around its upper boundary and spent time just above it. His assessment of that area is that it was very difficult to do anything of significance in it, with the instruction to leave it alone (11:56). The decision not to participate is the part of this review with the widest application.
ICT Checklist for High Resistance Liquidity
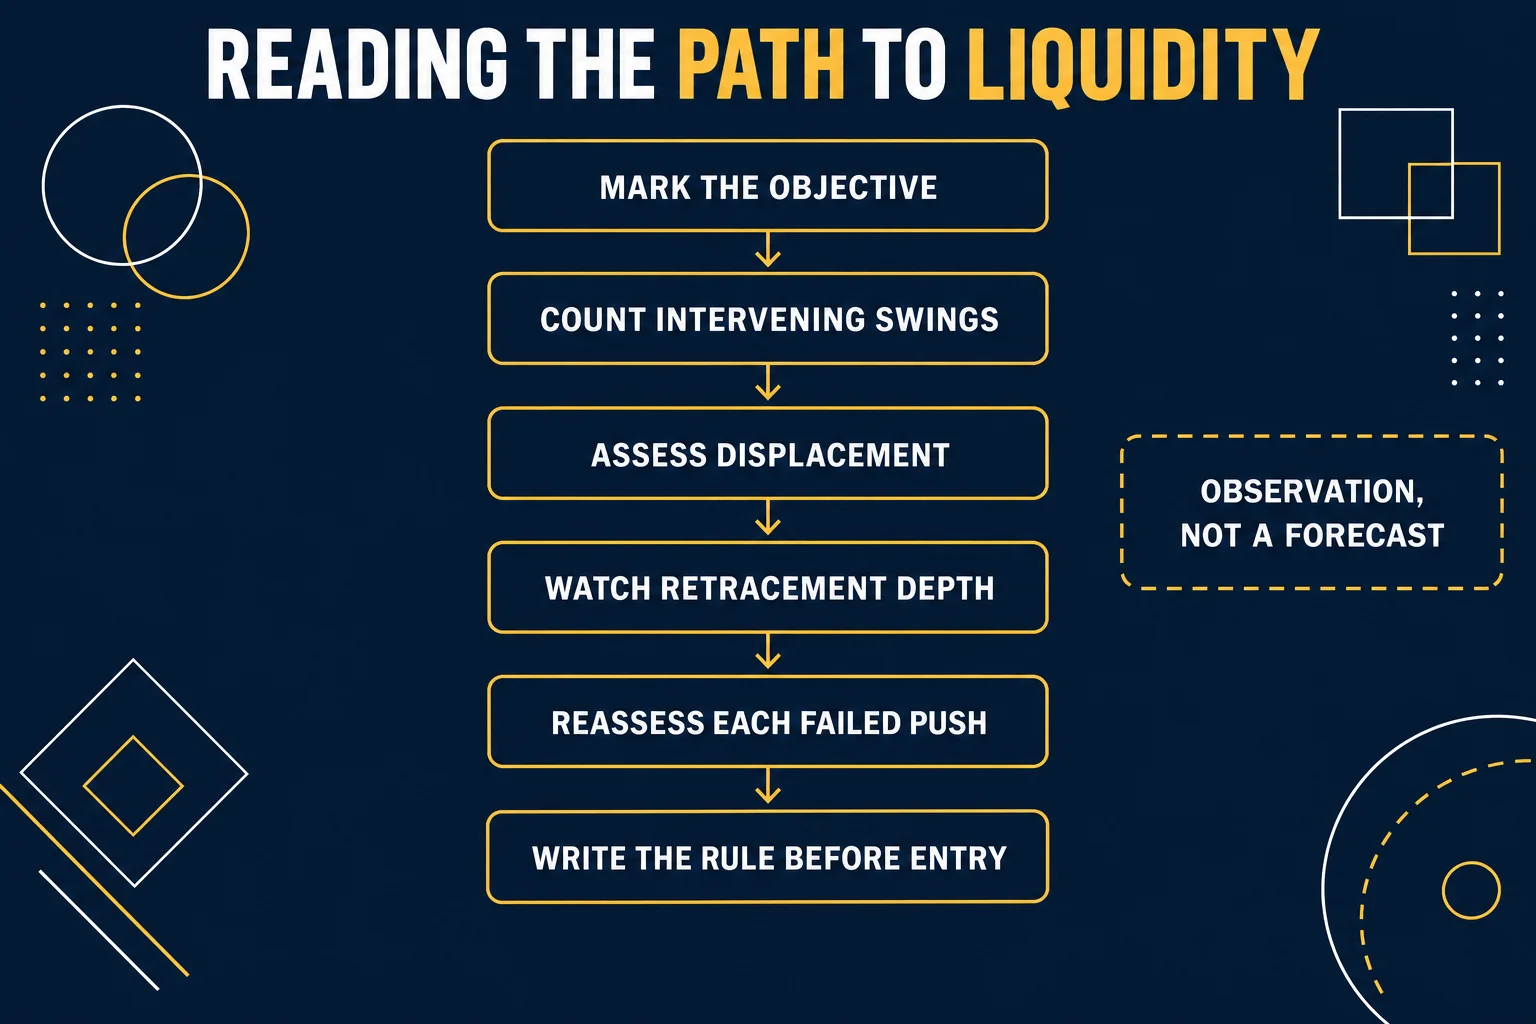
The six steps below are a distillation of the process visible in this recording, written for study rather than presented as a published ICT checklist. Each one maps to something the speaker actually did in the session:
- Mark the objective first. Here it was the midpoint of the regular-hours opening range gap, with the relative equal lows as the nearer reference.
- Count the structure in between. Relative equal lows sat below price and relative equal highs sat above it, which is what made the route congested instead of clean.
- Assess displacement. The gap that mattered in the aftermath was the one created by displacement beneath a swing low, not just any three-candle pattern.
- Watch retracement depth. Entry was tied to price overlapping and then trading back below the opening price, and the later return above the array is what flipped his read of the gap.
- Reassess every failed push. Repeated attempts below a swing low without follow-through were the signal that the original delivery was not working.
- Write the rule before the session. The minimum gap size and the exclusion of the 9:30 candle gap were decided in advance for Caleb rather than improvised live.
ICT Conditional Liquidity Run Plan
Near the end of the review he identifies relative equal highs above the market as possible liquidity in several locations, and sets out two conditional paths: price could come back down overnight and work inside the day’s opening range gap, or a move higher overnight would warrant looking for continuation into the next session (12:21). He labels that a loose expectation or bias and describes his posture as wait-and-see, noting that overnight events elsewhere could act as a catalyst and change the outlook (13:21). He closes by marking the new-day opening gap between settlement and the next open (13:30).
That is a conditional plan with no probability attached to either branch, and it should be read as exactly that.
What the ICT Liquidity Review Establishes
What it establishes is a documented example of one trader’s process: a gap-based opening bias, a higher-timeframe imbalance used as a reference point, a documented rule set given in advance to a student, and a decision to stand aside when price refused to deliver. The checklist above survives the source limitations because it describes method, not outcomes.
What it does not establish is that any of it worked. The only evidence of entries, stop-outs and drawdown mitigation is the speaker’s own narration, the chart was never available to verify, and the transcript cannot show what price did after the recording ended. The methodology here is a framework for structuring attention, and a framework is not a tested edge. For anyone trading a funded or evaluation account, the transferable point is the constraint the speaker applied to himself: a directional premise does not oblige continuous participation, and a rule fixed before the session is worth more than a decision improvised inside it. Nothing on this page is trading advice, and none of it should be copied as a strategy without independent testing.
ICT High Resistance Liquidity Run Source Video
The mapped source for this article is Reviewing High Resistance Liquidity Run Conditions – July 21, 2026 on the channel The Inner Circle Trader. Its watch-page metadata was read on 2026-09-14 and returned that title, a stated length of 827 seconds, public availability, and an upload date of 2026-07-22 in UTC.[1] A decoded copy of the recording’s audio used for this article runs 827.161 seconds, which matches that stated length. All transcript quotations and timestamps on this page come from that audio through automatic speech recognition, which is why ambiguous terms and numbers are flagged rather than asserted. This BestProps page is independent educational commentary: it is not a transcript, not an official ICT lesson, and not evidence about any trade shown in the recording.
Watch the original lesson on YouTube
This video cannot be played inside another website: the embedded player itself reports “Playback on other websites has been disabled by the video owner.” That response was re-read from the player, including a click-to-play attempt, on 2026-09-14 from a BestProps page origin, so no player area is reserved here and no embed is left blank. The recording is available directly on YouTube.
Watch Reviewing High Resistance Liquidity Run Conditions – July 21, 2026 on YouTube ↗
Sources for the ICT Liquidity Review
Three references were read directly for this page: the recording itself, the charting platform’s explanation of how a candle interval is constructed, and the exchange operator’s own product page for the contract discussed in the session. None of them predicts a market outcome, and none is presented as an ICT lesson.
Start With the ICT Recording
The mapped upload Reviewing High Resistance Liquidity Run Conditions – July 21, 2026 was read on 2026-09-14: the fetch returned the title, the channel The Inner Circle Trader, a duration of 827 seconds, public availability and an upload date of 2026-07-22 in UTC.[1] That settles the existence, attribution, length, public status and publication date of the recording, and it is the audio source for every timestamped quotation above. It does not establish what any individual trade achieved. Its embedded player refused to play outside YouTube when tested, which is why the card above is a link and not a player.
How ICT Reads a One-Minute Interval
TradingView’s Time intervals: a quick introduction and tips states that each candle “consists of four pieces of information, also known as prices:: opening, high, low, and closing prices”, that the interval “defines how much time it takes to form one candle”, and that “no matter which time interval you choose, the right-most candlestick on the chart may represent that interval only partly”.[2] Those definitions matter for a review built on one-minute candles: the interval decides what a candle actually contains, and an unfinished candle should not be read as a completed one. The page documents chart construction only and makes no claim about direction, levels or outcomes.
The ICT Trading Instrument
The CME Group page for E-mini Nasdaq-100 futures contract specs describes the product as exposure to the Nasdaq-100 Index and advertises “nearly 24-hour access”, which is the context for the regular-hours and electronic-hours distinction the speaker refers to during the review.[3] It is the exchange operator’s own marketing page: the availability claims there are CME Group’s, not independently tested for this article, and no figure from it is used to support any statement about price or performance.
ICT Review Sources
- [1] YouTube: Reviewing High Resistance Liquidity Run Conditions – July 21, 2026 – The Inner Circle Trader (primary source recording; title, channel, duration, availability and UTC upload date read 2026-09-14; audio transcribed locally with whisper-large-v3-turbo; embed refused by the player)
- [2] TradingView: Time intervals: a quick introduction and tips (how candle intervals are constructed and how to read a partially formed candle; read 2026-09-14)
- [3] CME Group: E-mini Nasdaq-100 Futures Contract Specs (exchange operator product page, read 2026-09-14; vendor claims only)
BestProps is not affiliated with The Inner Circle Trader, TradingView or CME Group, and no source listed here endorses this article, this site or any setup. High resistance liquidity run, opening range gap, half gap, consequent encroachment, relative equal highs or lows, fair value gap and inversion fair value gap are used on this page only as descriptive study terms. Nothing here demonstrates a tested, repeatable or profitable result, and no claim is made that any session setup predicts price or was verified on a live account.